To enable live process monitoring in Datadog Agent, follow these steps:
- Log in to Datadog:
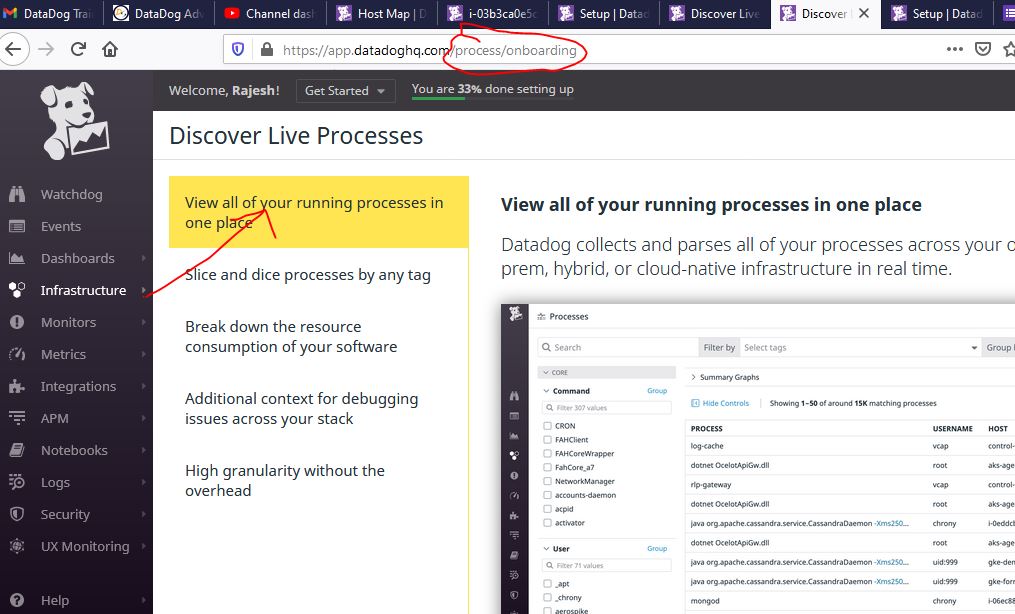
- Go to the Datadog website (https://app.datadoghq.com/).
- Log in to your Datadog account.
- Install and Configure the Datadog Agent (if not already done):
- If you haven’t already installed and configured the Datadog Agent on the host(s) you want to monitor, follow Datadog’s installation guide for your specific environment. The process may vary depending on your operating system and setup.
- Edit the Agent Configuration:
- SSH into the host where the Datadog Agent is installed.
- Locate the Agent Configuration File:
- The Datadog Agent configuration file is usually located in
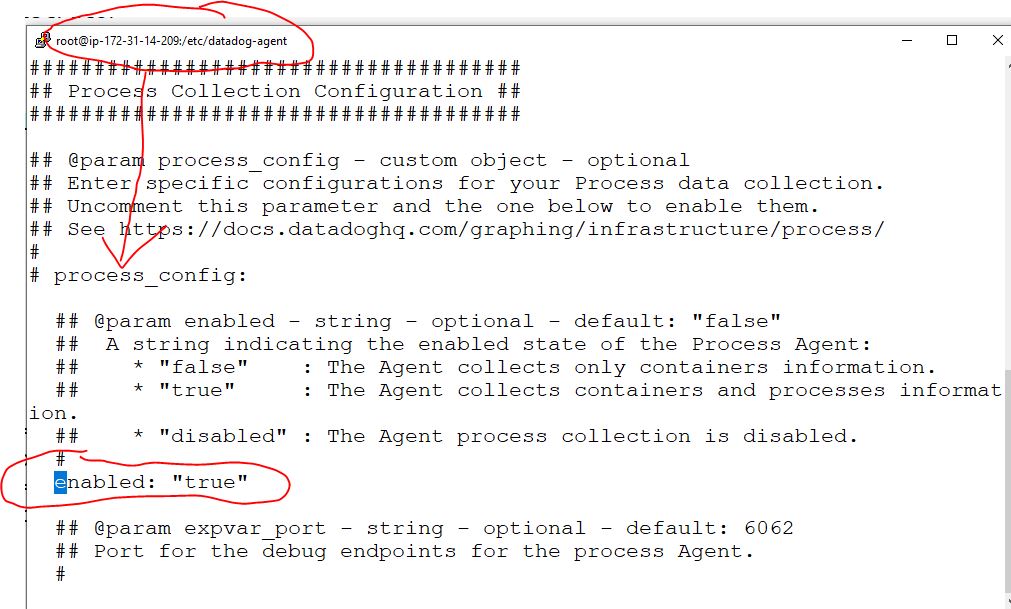
/etc/datadog-agent/datadog.yamlon Unix-like systems. You can use a text editor (e.g., nano or vi) to open this file.
- The Datadog Agent configuration file is usually located in
- Enable Live Process Monitoring:
- Inside the
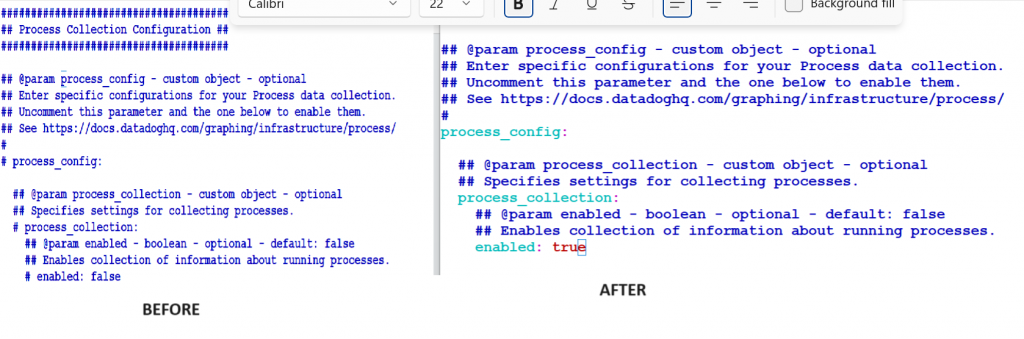
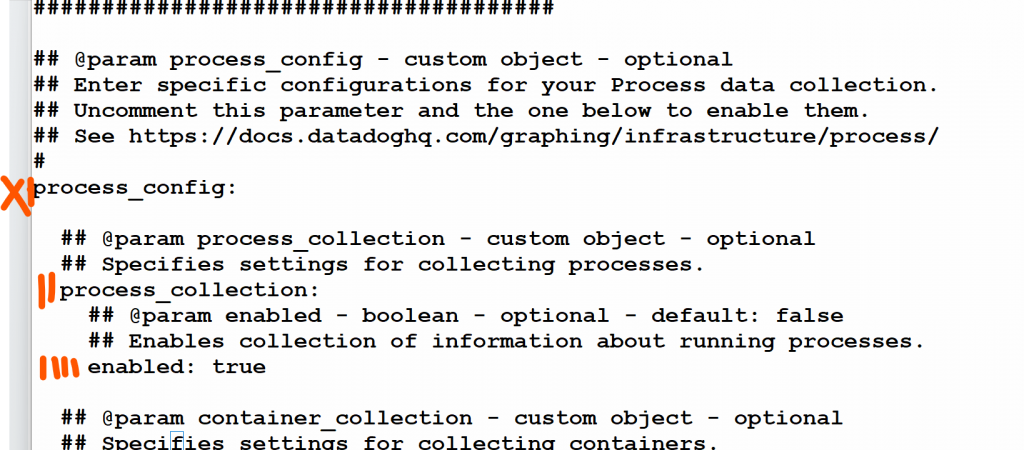
datadog.yamlfile, locate the section related to process monitoring. It typically looks like this:
- Inside the
######################################

## @param process_config - custom object - optional
## Enter specific configurations for your Process data collection.
## Uncomment this parameter and the one below to enable them.
## See https://docs.datadoghq.com/graphing/infrastructure/process/
#
process_config:

  ## @param process_collection - custom object - optional
  ## Specifies settings for collecting processes.
  process_collection:
    ## @param enabled - boolean - optional - default: false
    ## Enables collection of information about running processes.
    enabled: true

================================================- Save and Close the Configuration File:
- Save your changes to the
datadog.yamlfile and exit the text editor.
- Save your changes to the
- Restart the Datadog Agent:
- To apply the changes, you’ll need to restart the Datadog Agent. The command to restart the agent depends on your operating system. For example, on Linux, you can use the following command:bashCopy code
sudo systemctl restart datadog-agent
- To apply the changes, you’ll need to restart the Datadog Agent. The command to restart the agent depends on your operating system. For example, on Linux, you can use the following command:bashCopy code
- Verify Live Process Monitoring:
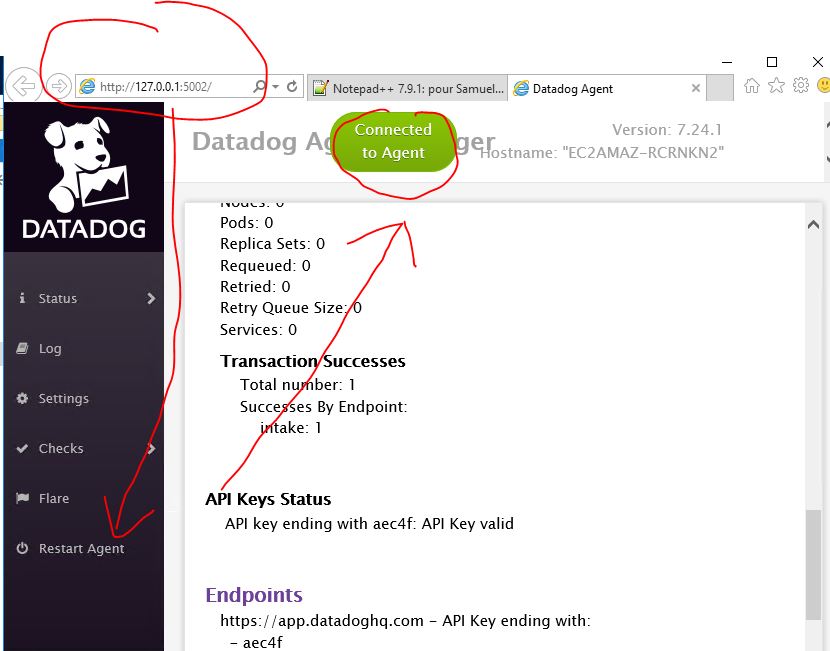
- After restarting the agent, go back to the Datadog web interface.
- Access Process List:
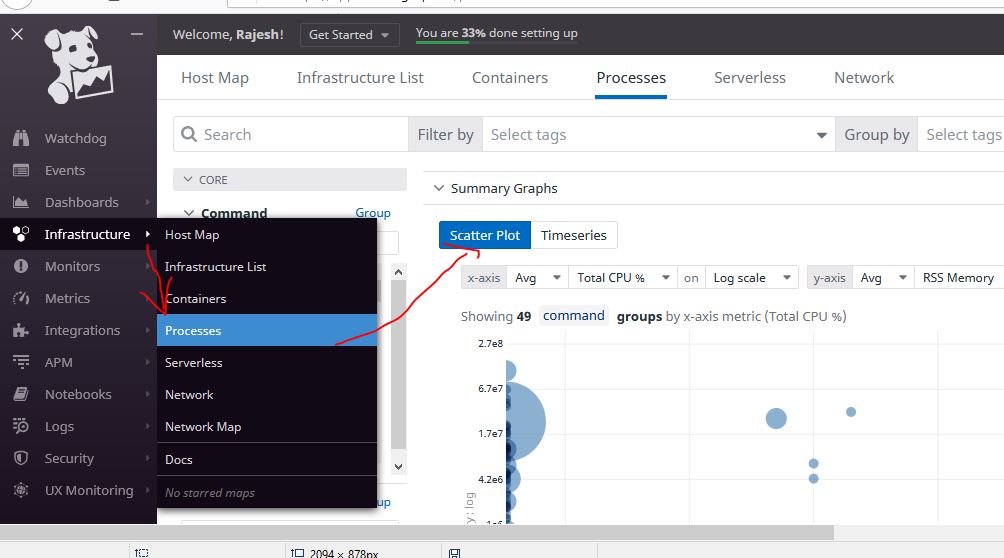
- In the Datadog dashboard, navigate to the “Infrastructure” tab and select “Processes” from the left sidebar. This will allow you to access the live process list.
- Explore Process Data:
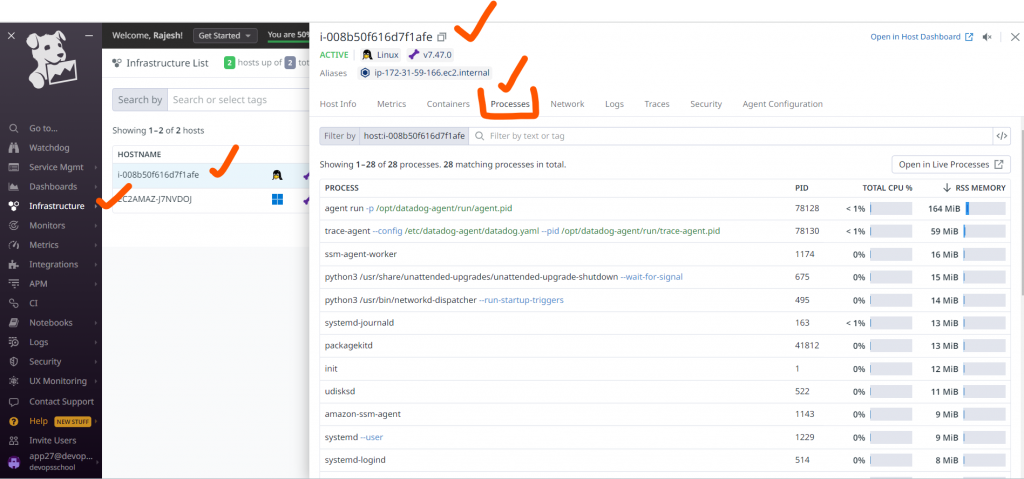
- You should now be able to see live process data for the host(s) where you enabled live process monitoring. You can explore running processes, resource usage, and other relevant information.
Enabled Process Monitoring
How to restart Datadog Agent after enabling process check?
$ systemctl start datadog-agent
$ systemctl stop datadog-agent
$ systemctl restart datadog-agent
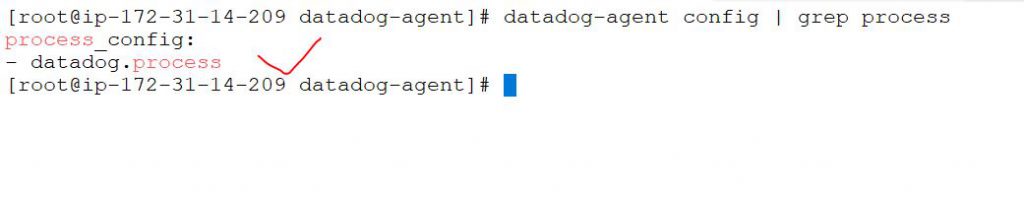
$ systemctl status datadog-agentHow to check if process monitoring is enabled or not in Linux?
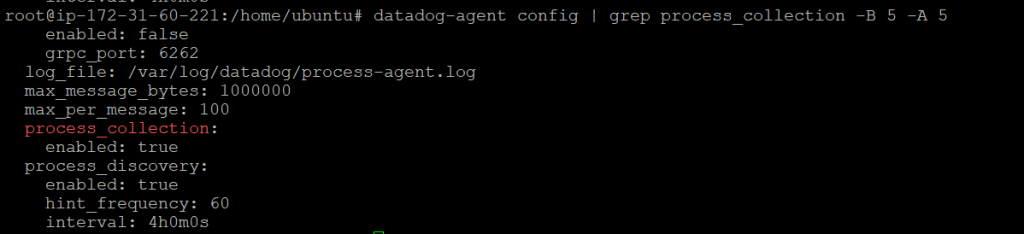
root@ip-172-31-60-221:/home/ubuntu# datadog-agent config | grep process_collection -B 5 -A 5
    enabled: false
    grpc_port: 6262
  log_file: /var/log/datadog/process-agent.log
  max_message_bytes: 1000000
  max_per_message: 100
  process_collection:
    enabled: true
  process_discovery:
    enabled: true
    hint_frequency: 60
    interval: 4h0m0s
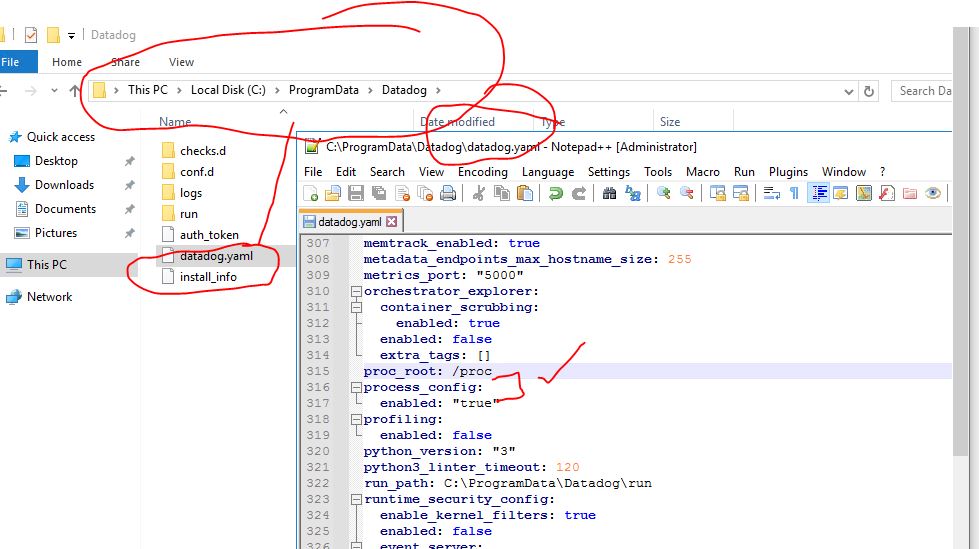
How to check if process monitoring is enabled or not in Windows?
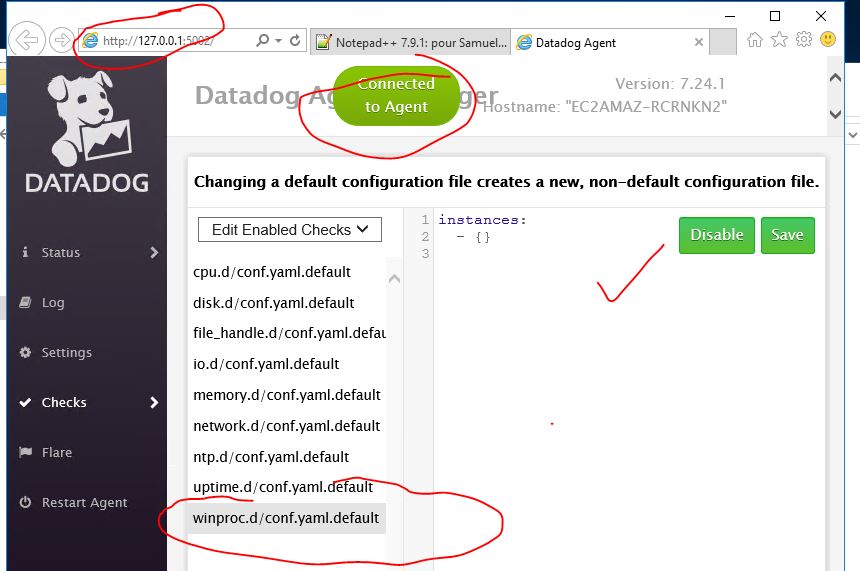
How to check if Process Enabled at Datadog?

Mentor for DevOps - DevSecOps - SRE - Cloud - Container & Micorservices at Software AG
Join my following certification courses...
- DevOps Certified Professionals (DCP)
- Site Reliability Engineering Certified Professionals (SRECP)
- Master in DevOps Engineering (MDE)
- DevSecOps Certified Professionals (DSOCP)
URL - https://www.devopsschool.com/certification/
My Linkedin - https://www.linkedin.com/in/rajeshkumarin
- DevOps Certified Professionals (DCP)
- Site Reliability Engineering Certified Professionals (SRECP)
- Master in DevOps Engineering (MDE)
- DevSecOps Certified Professionals (DSOCP)
URL - https://www.devopsschool.com/certification/
My Linkedin - https://www.linkedin.com/in/rajeshkumarin
Latest posts by Rajesh Kumar (see all)
- Apache Lucene Query Example - April 8, 2024
- Google Cloud: Step by Step Tutorials for setting up Multi-cluster Ingress (MCI) - April 7, 2024
- What is Multi-cluster Ingress (MCI) - April 7, 2024