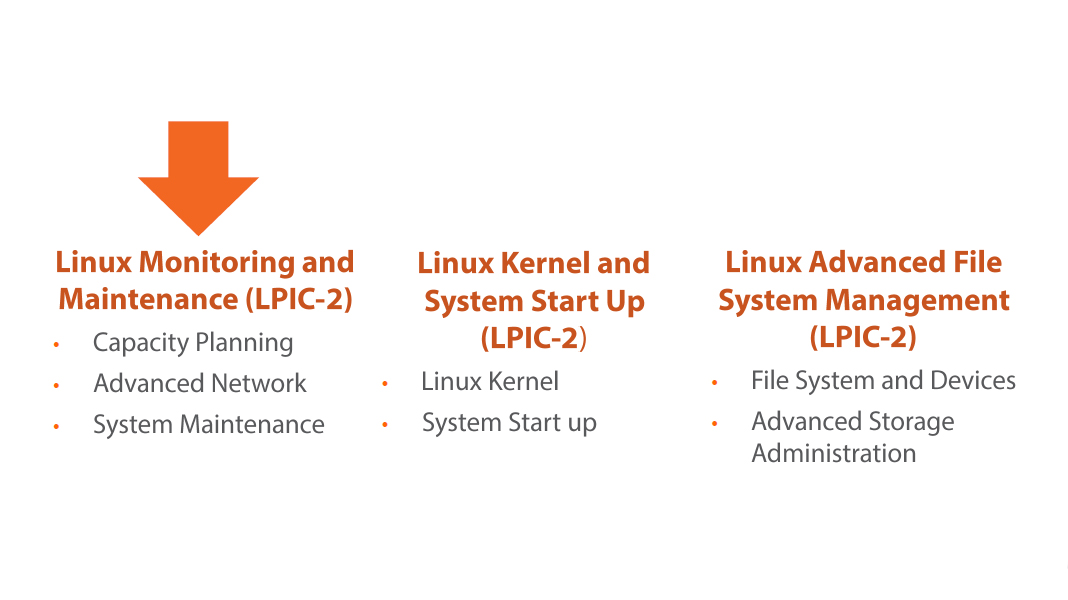
Linux Monitoring and Maintenance (LPIC-2)
Introduction
The Basics
About Me

DevOps@RajeshKumar.XYZ
LPIC-2

LPIC-2 201
Knowledge is power.
Linux Monitoring and Maintenance (LPIC-2)
- Command line tools from sysstat
- Using collectd to graph system performance
- Monitoring availability with Nagios
- Basic networking and Wireless LAN
- Advanced network administration
- Project: Building a Raspberry P1 Wireless Access Point
- Building from source
- Backup your data
- Ways to notify users
What to Bring

DIY’R’ Us
Our scenario company we work with in the demonstrations is DIY ‘R’ Us. A large retail DIY chain. Danny is their lead Linux Guruand is looking at improving the monitoring of services so maintenance is a little more proactive.
Objective 200.1
Measure and Troubleshoot Resource Usage
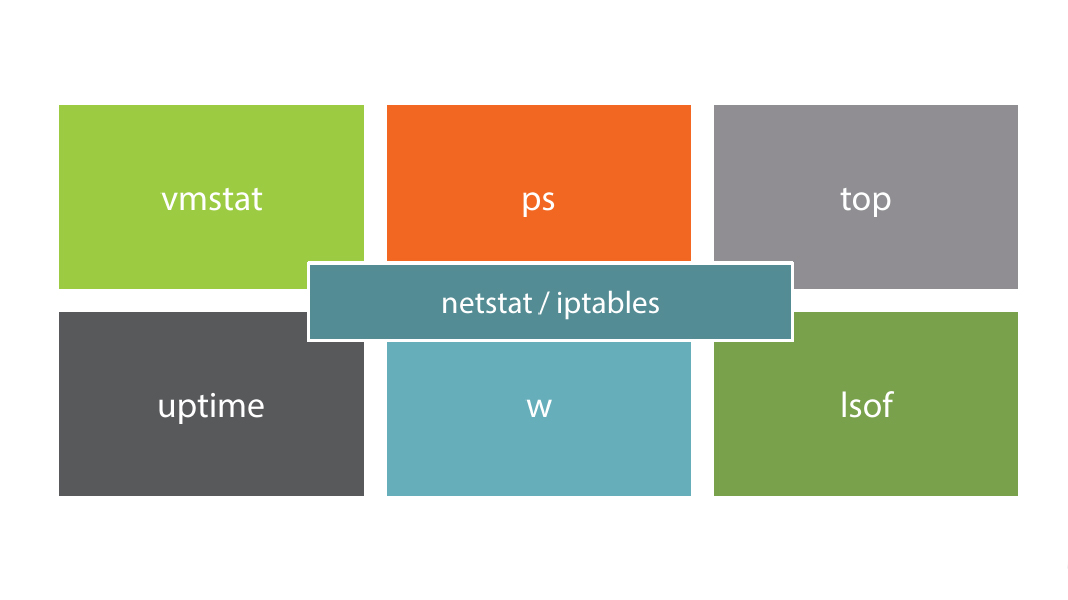
Standard Monitoring Tools

vmstat
	$ vmstat

	r: Total number processes waiting for Cpu time

	b: Total number blocked processes, waiting for disk or network 10

	Swpd: used virtual memory

	Free: Free virtual memory

	Buff: Memory used as buffers (what’s in directories, permissions)

	Cache : Memory used as cache (contents of files)

	Si: Memory swapped from disk every second

	So: Memory swapped to disk every second

	Bi: Blocks in per second

	Bo: Blocks out per second

	In: Interrupts per sec

	C4: Context switches per second
	$ vmstat -S M

	$ vmstat -a

	$ free -m ; sync

	$ sudo bash -c “echo 3 > proc/sys/vm/drop caches”

	$  free -m
- Displays memory usage in MB
- Display active / inactive memory (memory in use and no longer in use)
- To free up memory space immediately
Other options
Demo: Real Time Monitoring with vmstat
Demo: Other Real Time Monitoring Tools
Limitations of”Out of the Box”Tools
Real Time |
No Historical Data |
Reactive |
|---|
What this means for Danny
- Danny and DIY ‘R’ Us need to look at extending these tools to maintain historical performance data. Danny will be collecting data over a period of time and calculating effective baselines.
Summary
- Outlined the LPIC-2 201 curriculum
- Highlighted what this course will focus on
- View the out of box tools from procps
- Identified options in vmstat
Next Up: Beyond vmstat with sysstat
Next Up: Beyond vmstat with sysstat
Command Line Monitoring Tools
For me, a day spent monitoring the passing parade is a day well spent.
Command Line Monitoring Tools
- Command line tools from procps
- As well as new tools from sysstat
- Reviewing historical data
Monitoring at DIY ‘R’ Us
- As is the case in many improving IT organizations, proactive maintenance is a little sparse and Danny is looking at simple ways to build a better understanding of the estate performance. This needs to be done without major changes to any existing system.
Objective 200.1
Measure and Troubleshoot Resource Usage
procps and sysstat
- Included as standard we have vmstat from the package procps.
- With sysstat we gain similar tools such as lostat, and mpstat but more importantly we can collect this information every 10 minutes to build a real picture of performance windows.
Real Time Monitoring
	$ netstat -i

	$ netstat -s
- netstat
- From net-tools package
- Often used to display open ports
- But can show details on tx/rx packets and network usage
	# iptables -nvL

	# watch -d -n 2 iptables -nvL
- iptables
- Display counters relating to firewall rules
- Often used to display open ports
- Use watch to see in real time and -d to highlighting changes since last refresh
Demo: Real Time Monitoring from the CLI
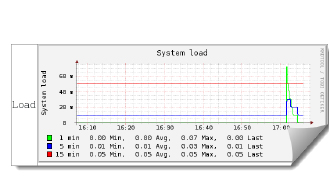
Even with uptime, the data we see is limited to the last 1, 5, and 15 minutes; hardly historical data
History in the Making Using sysstat
sal |
sa2 |
sar |
|---|
When enabled...
- Data is collected every 10 minutes and can be read with sar.The script sal collects data every 10 minutes and the script sa2 summarizes daily information. The scripts sal and sa2 and enabled though cron.
ubuntu |
/var/Iog/sysstat/sa< day number > /etc/sysstat/sysstat /etc/defauIt/sysstat |
|---|
CentOS |
/var/log/sa/sa< day number > /etc/sysconfig/sysstat |
|---|
Tools Within sysstat
lostat: Generates CPU & disk IO information
mpstat: More detailed CPU information
pidstat: Displays process ID information
cifsiostat: Details about SAMBA share IO
nfsiostat: Details about NFS export IO
sar: Collects and displays system activities
Demo: Installing sysstat
	$ sar -V

	$ sar or sar -u

	$ sar -q
- Print the version of sar that we have installed
- Displays CPU information
- Displays load average information
Using sar
	$ sar -q 1 3

	$ sar -q -f /var/log/sa/sa15 (CentOS)

	$ sar -q -f /var/log/sysstat/sa15 (Ubuntu)
- Display load averages 3 times with a 1 second interval
- Display load averages from day 15 of the current month
A little more sar
	$ sar -w

	$ sar -n DEV

	$ sar -b

	$ sar -q -s 10:00:00 -e 11:00:00
- Processes created per second and context switches per second
- Network interface statistics
- Overall IO activity
- Display load averages from 10 to 11 on the current day
Still more....
DIY ‘R’ Us have history!
- Danny and DIY ‘R’ Us now have to ability to review data over given time periods and days of the week. This allows them to make informed decisions about load and system growth.
Demo: Using sar
Summary
- We have used command line tools tomonitor our systems
- vmstat, iptables, top, ps, netstat, Isof
- Enabled historical data by installing sysstat
- User the command sar to view historical data
Next Up: Pictures Say More
Graphing Data Collection with Collectd
If a picture paints a thousand words.
Module Overview
- Need for graphical representation
- EPEL Repository
- Installing collectd and Apache httpd
Objective 200.2
Predict Future Resource Needs
Managers Like Pictures
- A manager can’t make a decision without a graph
- It’s a known fact
- Presenting performance data graphically will ensure the hardware you want .. whether you actually need it or not

Graphs from collectd
- You can read collectd data via a web server
- Graphs are effortlessly created
	# rpm -ivh \

	https : //anorien.csc.warwick.ac. uk/mirrors/epel/7/x86_64/e/epe

	1-release-7-5. noarch. rpm
- We will work with CentOS 7 for this example
- Collectd can be installed from the EPEL repo maintained by the Fedora Project
- The RPM will install just the repo file and gpg key
Adding the EPEL Repository to CentOS 7
	yum install -y collectd collectd-rrdtool rrdtool \

	collectd-web httpd
- We need collectd and a few additional packages to create the graphs
Installing collectd
Demo: Installing collectd
A bit more work left yet though...
Configuring collectd on CentOS 7
/etc/collectd.conf
BaseDir “/var/lib/collectd”
LoadPlugin rrdtool
< Plugin rrdtool >
Data Dir ‘/var/Iib/collectd/rrd”
CreateFilesAsync false
CacheTimeout 120
CacheFlush 900
WritesPerSecond 50
< /Plugin >
	# vi /etc/httpd/conf/httpd.conf

	Listen 0.0.0.0:80
- If we install Apache as new installation with collectd we will need to make sure it is
- listening on IPv4 Addresses
Apache Listen Address
	# vi /etc/httpd/conf.d/collectd.conf

	Require ip 192.168.0
- If you want to access from a remote machine we need to adjust the Apache Access Lists
Set Web Permissions
Ensure the System Hostname is Resolvable
DNS: Add DNS A record
letc/hosts: or a local host entry
CentOS |
# systemctl enable collectd # systemctl enable httpd # systemctl start httpd # systemctl start collectd |
|---|
Demo: Configuring collectd
Demo: Accessing collectd data
Summary
- We have insulted our managers
- But given them what they need
- Pretty pictures
- Added the EPEL Repository
- Installed collectd to graph performance data
Next Up: Nagios availability monitoring
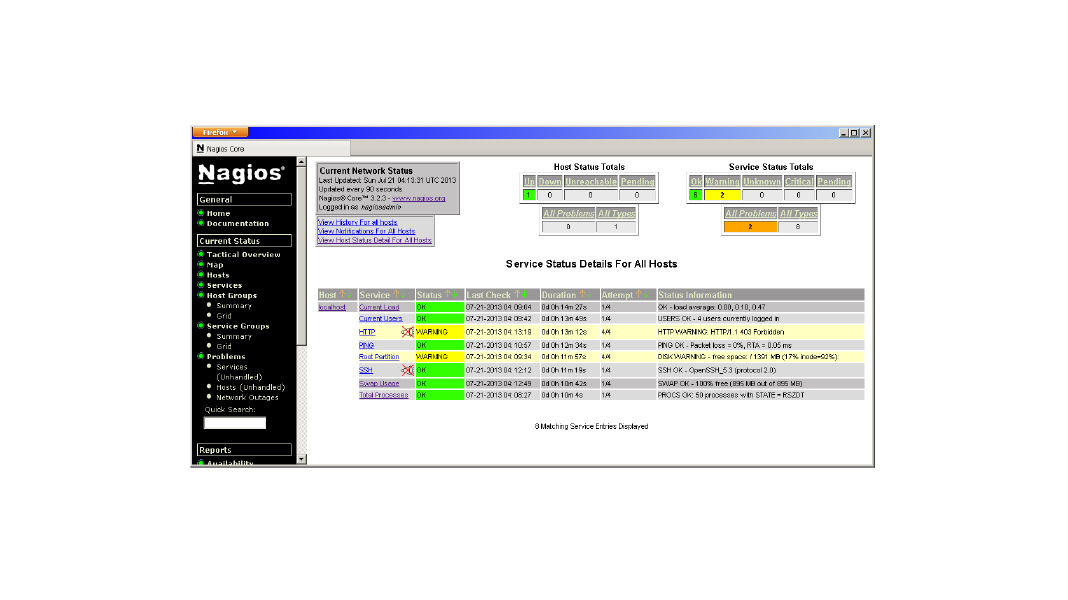
Monitoring Availability with Nagios
We’re going to be able to ask
our computers to monitor
things for us.
Module Overview
- Nagios monitoring
- Installing Nagios Core on Ubuntu
- Defining host entries
- Defining service entries
- Monitoring MySQL

Objective 200.2
Predict Future Resource Needs
Nagios Monitoring
- Monitoring of Network Services
- Monitoring of Host Resources
- Open Source GPL V2
- NSCIient++ for Windows
Naglos@DIY’R’Us
- NTP Synchronization
- MySQL Servers
	$ sudo apt-get install tasksel

	$ grep Task /usr/share/tasksel/ubuntu-tasks.desc

	$ sudo  tasksel OR

	$ sudo tasksel install lamp-server
- First we install the LAMP stack, we may choose to add tasksel first to ease the installation of LAMPS
- Configure password for MySQL root
Nagios will be installed on Ubuntu
$ sudo apt-get install nagios3
- The package is part of the default repositories
- Prompted to configure SMTP and add password for nagiosadmin
- Apache is restarted at the end of the install
Installing Nagios
Demo: Installing LAMP and Nagios

A bit more work left yet though...
Resolving Disk Critical Event.
DISK CRITICAL - /home/user/.gvfs is not accessible: Permission denied
The Gnome VFS is not accessible to the nagios user account
This is normal but Danny needs to ignore the error in some way
/etc/nagios-plugins/config/disk.cfg
-A -i '.gvfs’
Demo: Post-Installation tasks
Define Host Entries
define host{
	use            generic-host

	host_name      locaihost

	alias          localhost

	aidress        127.0.0.1

    }
Define Nagios Host Entries
define host{
	   host_name tick

	   alias tick NTP Server

	   address 192.168.0.3

	   use  generic-host
    }
	$ sudo nagios3 -v /etc/nagios3/nagios.cff

	$ sudo service nagios3 restart
- Before restarting Nagios to implement changes we can test the configuration.
- Nagios will report a warning that there are no services associated with the new host
Pre-flight Checks
Demo: Viewing host data
	$ sudo vi /etc/ntp.conf

	restrict 192.168.0.163

	AVOIDS: CRITICAL - Socket timeout after 10 seconds
NTP Changes
- We will add a service definition for NTP later.
- But, first we fix the NTP configuration
- The Nag los server will need NTP restrictions removed
Service Entries’
NTP OK 2014-12-30 15:57:11 0d 0h 11m 27s 1/4 NTP Ok: Offset -0.000682 secs
define service {
	host_name tick

	service_description NTP

	check_command check_ntp

	use generic-Service

  }

$ sudo /usr/lib/nagios/plugins/check_ntp_peer -H tick
Demo: Service entries and monitor NTP
Monitor MySQL
Create MySQL Account |
Define Nagios Hostgroup |
Define Nagios Service |
|---|
	CREATE USER ‘nagios’@’192.168.0.163’ IDENTIFIED BY ‘Password1;’

	FLUSH PRIVILEGES;
On each MySQL Server
- As the MySQL root create a new account limited to access from the Nag los server
define hostgroup {
        host roup_nam  mysql-servers

        alias          MySQL Servers

        members        mysql1, mysql2
	}
Create a Hostgroup
- As we have more than one MySQL server
- The MySQL Service can be associated with the hostgroup
define service {
	hostgroup_name mysql-servers

	service_description MYSQL

	check_command check_mysql_cmdlinecred!nagios!Password1

	use generic service
	}
Define MySQL Service
Demo: Monitoring MySQL
Additional monitoring tools
include MRTG and Cacti
MRTG
- The Multi RouterTrafficGrapher- Used to monitor router traffic so long as the device is SNMP enabled
- http://oss.oetiker.ch/mrtg/
Cacti
- In many standard repositories such as Ubuntu and SUSE and provides web access to graphical performance data a little like collectd
Summary
- Monitored availability with Nagios
- Installed Nagios on U bu ntu 14.04
- Created hosts, hostgroups and service entries
- Monitored NTP and MySQL
Next Up: Basic Network Management
Basic Network Administration
The richest people in the world
lookfor and build NETWORKS,
everyone else looks for work.
Overview
- ifconfig
- ip
- route
- arp
- Configure wireless networks

Objective 205.1
Basic Network Configuration
Used in this Module
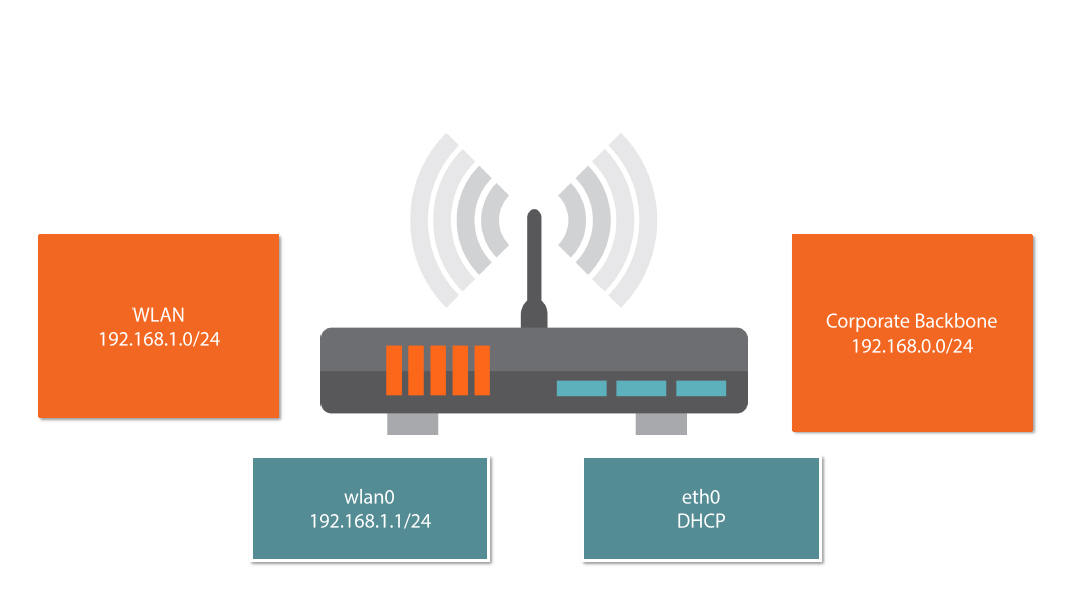
- At DIY’r’Us Raspberry Pis are used as kiosk machines on the shop floor and connect wirelessly
- As RHEL 7.1 is used in some parts of the organization we will can compare configurations between Red Hat and Debian based hosts
	$ ifconfig

	$ sudo ifconfig ethO 192.168.0.4

	$ sudo ifconfig add ethO 172.17.0.1 \

	netmask 25S.255.0.0 broadcast 172.17.255.255

	$ sudo ifconfig ethO down ; sudo ifconfig ethO up
/sbin/ifconfig
- Traditional command used to display and set IP Address information
- Change IP Address
- Add additional lP
- Disable and enable interface
The command ifconfig is a traditional Linux command and many admins use it, although officially depreciated, It IS an LPI objective so make sure you know it
Demo: Using the ifconfig command
	$ ip address show

	$ ip route show

	$ ip neighbor show

	$ sudo ip link set eth0 up

	$ sudo ip address add 192.168.0.5/24 dev eth0
Using the command ip
- The newer command ip is a little swiss army knife
- Working with many network objects, ARP cache, route table etc
A good administrator will know
‘ip’ or ’ifconfig’; whereas a
GREAT administrator will know both.
Demo: Using the ip command
Route Command
- Route manipulates the kernel’s IP routing tables. Its primary use is to set up static routes to specific hosts or networks
- The command ip can also be used
	$ routeOR ip r s

	$ route -n

	$ strace route 2>&1 | grep network

	$ strace route -n 2>&1 | grep network
Display route table
- Use the -n option to display numbers not names of networks.
- Names are resolved via /etc/networks
Route Flags
Possible flags include
- U (route is up)
- H (target is a host)
- G (use gateway)
- R (reinstate route for dynamic routing)
- D (dynamically installed by daemon or redirect)
- M (modified from routing daemon or redirect)
- A (installed by addrconf)
- C (cache entry)
- ! (reject route)
	$ sudo route add default gw 192.168.0.1

	$ grep default /etc/networks
Add a Default Route
- Remember networks names including default are included in /etc/network
	$ sudo route add -net 192.168.3.0 \

	netmask 253.255.255.0 gw 192.168.0.1
Add Route to Private Network
- Private address ranges are not advertised so the route table needs to be populated
$ sudo route add -host 192.168.1.20 reject
Block Access to a Single Host
Persisting Static Routers
	/etc/network/interf aces

	auto eth0

	allow-hotplug eth0

	iface eth0 inet static

	address 192.168.0.5

	netmask 255.255.255.0

	post-up route add -net 172.16.0.0 netmask 255.255.0.0 gw 192.168.0.3
ubuntu
Persisting Static Routers
	/etc/syscon-Fig/network- scripts/route-eth0

	default 192.168.0.1 dev eth0

	10.10.10.0/24 via 192.168.0.3 dev eth0

	172.16.1.0/16 via 192.168.0.1 dev eth0
CentOS
Demo: Manage Routes
Address Resolution Protocol
Maps layer 3 IP addresses to layer 2 MAC addresses |
Used when the sending IP address and receiving IP address are on the same network |
Displayed by the command arp which lists content of /proc/n ct/a rp |
|---|
	$ arp OR ip n s

	$ sudo arp -s < ip > < mac >

	$ sudo arp -d < ip > OR < mac >

	/etc/ethers < mac > < ip >
- Without options the arp cache is displayed (contents /proc/net/arp)
- The -s option is used to add a static entry - d to delete an entry
- Persistent entries can be created in /etc/ethers
Using the arp command
Demo: Using ARP

Configuring WiFi
- wpa_su pplica nt.conf
- iwlist
- iwconfig

When Configuring WiFi from CLI
	/etc/wpa_supplicant/wpa_supplicant. conf

	ctrl_interface=DIR=/var/run/wpa_supplicant GROUP=netdev

	update_config=1

	network={

	ssid=”DIY-WLAN”

	psk=”secret-pre-shared-key”

	proto=RSN

	key_mgmt=WPA- PSK

	pairwise=CCMP TKIP

	}
$ sudo iwlist wlan0 scan
- This can help you find information you need for wpa_supplicant.conf
Scan for SSID
	$ iwconfig wlan0

	$ cat /proc/net/wireless
- The command iwconfig can be used to both display and set adaptor information
- Information can also be displayed from /proc/net/wireless
Display device information
	$ sudo wpa_cli status

	Selected interface wlan0’

	bssid=74:44:01:fb:92: 50

	ssid=hobbit

	id=0

	mode=station

	pairwisecipher=CCMP

	group_cipher=TKIP

	key_mgmt=WPA2 - PSK

	wpa_state=COMPLETED

	ipaddress=192.168.0.5

	address=80:lf:02:fd:9e:b7
Display status information for a connection
Demo: Configuring Wireless Access on the Raspberry Pi

- Compared ifconfig and ip
- Managed route tables
- Understanding of the ARP cache
- Configured wireless networks from the
- command line
Summary
Next Up : Advanced Network Management
Advanced Network Administration
- Port and traffic analysis
- Network troubleshooting
- Device naming schemes
- NetworkManager
Module Overview
Used in This Module
As RHEL 7.1 is used predominantly in this module as we look at the new device naming schemes implemented in Red Hat 7.1

Network Manaqement at DIY ‘R’ Us
- As the network grows at DIY ‘R’ Us so does the way it is managed.
- Danny and the team need to look at network troubleshooting techniques and there seems to be a lot to learn in the newly deployed RHEL 7.1
Objective 205.2
Advanced Network Configuration
Command line tools
- tcpdump
- netstat
- Isof
- nc
- nmap
tcpdump
- Command line packet analyser. Many of us will have heard of the graphical Wireshark, (Ethereal), packet capture tool; however from the command line we too can interrogate packets.
	$ sudo tcpdump -i eth0

	$ sudo tcpdump -c 5 -i eth0

	$ sudo tcpdump -i eth0 not port 22
- Display all packets captured on eth0
- Only capture 5 packets
- Don’t capture SSH traffic, useful when remoting into the host
Capturing Network Traffic with tcpdump
Demo: Using tcpdump
netstat
Commonly used to display open ports on a host and is found on Unix, Linux and Windows hosts
                                 -a Show all

         $ netstat -a            -n Numeric

	$ netstat -nr           -r Routes

	$ netstat -nalt         -l Listening

	$ netstat -lx           -t TCP

	$ is -l /tmp/filexxx    -x Sockets
- Display a long listing on one of the files listed in the -x results will confirm it is a socket
Using netstat
    $ sudo Isof -i

    $ sudo Isof -iTCP:22

    $ sudo Isof -i@192.168.40.3
- Option -i with no arguments will list all open ports
- Then we show TCP and port 22 only
- Finishing with connections to or from the host 192.168.40.3
Similarly Isof can list connections
Demo: Using netstat and Isof
nc
The command nc or netcat is a very useful command for creating and testing network connections
    $ nc 192.168.0.4 80

    GET
- We connect to the web server with nc and then issue the GET command
Test a web server
Chat windows between two hosts
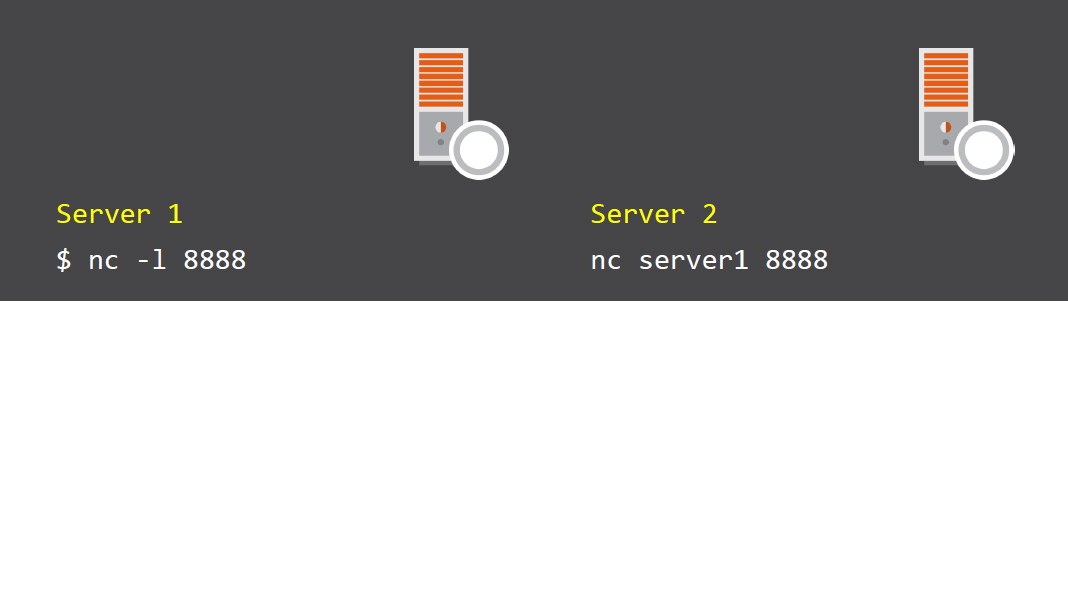
With the connection in place you can “chat” between the hosts Server 1 is listening on port 8888
Transfer files between hosts
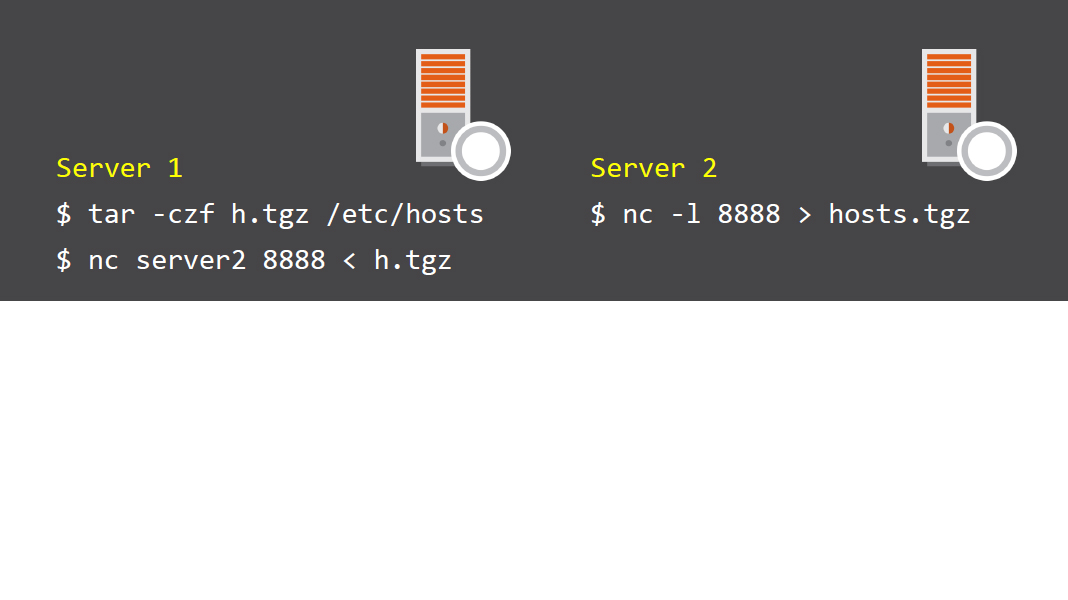
Here Server 2 is listening on port 8888 and the file is sent from Server 1
Demo: Using nc
nmap
- Nmap or the “Network Mapper” is used for network explorations and security auditing; being able to scan large networks or single hosts identifying open ports and operating system versions
$ nmap --if1ist
- If nmap is not installed it can be installed:
- sudoyum install nmap
- sudo apt-get install nmap
Display local ports and routes
Simple scans...are not so simple
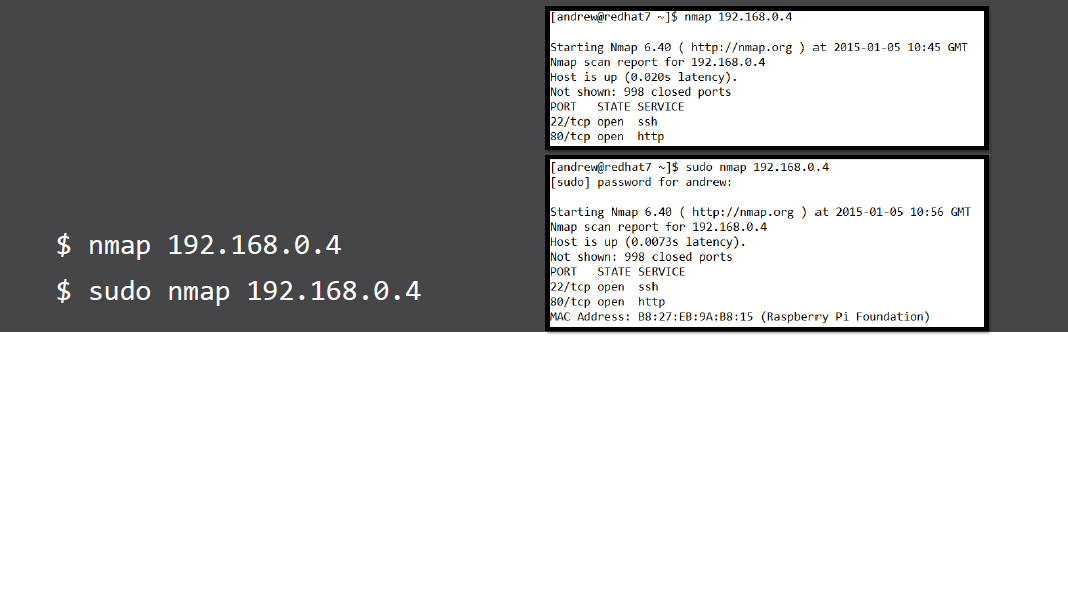
- As a standard user a TCP scan is initiated: nmap -sT 192.168.0.4
- As a privileged account a SYN scan is used: nmap -sS
TCP scan
- TCP scan can be initiated by standard users and use the UNIX connect() libraries. As such a full TCP 3 way handshake is initiated. These scans are easy to detect and mitigate against.
SYN Scan
- The SYN can requires root privileges on the system using nmap. The connection is broken down on the receipt of a SYN packet from the target port. Modern firewalls can detect SYN scans but it is made more difficult in the way nmap alters timings.
Version scans
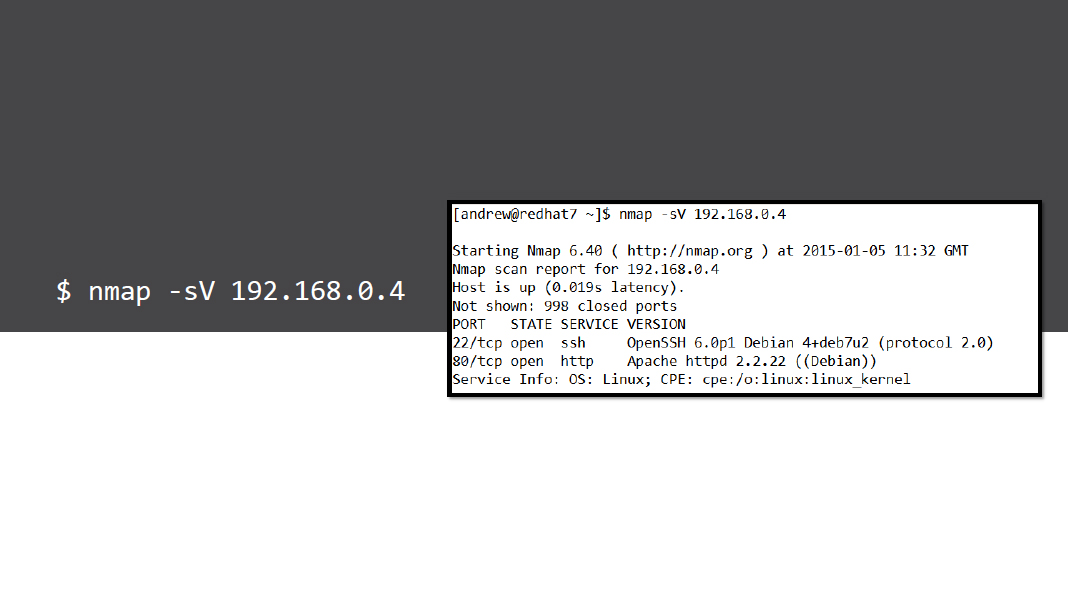
- The version of the service hosting a port can be detected with -sV
OS Detection
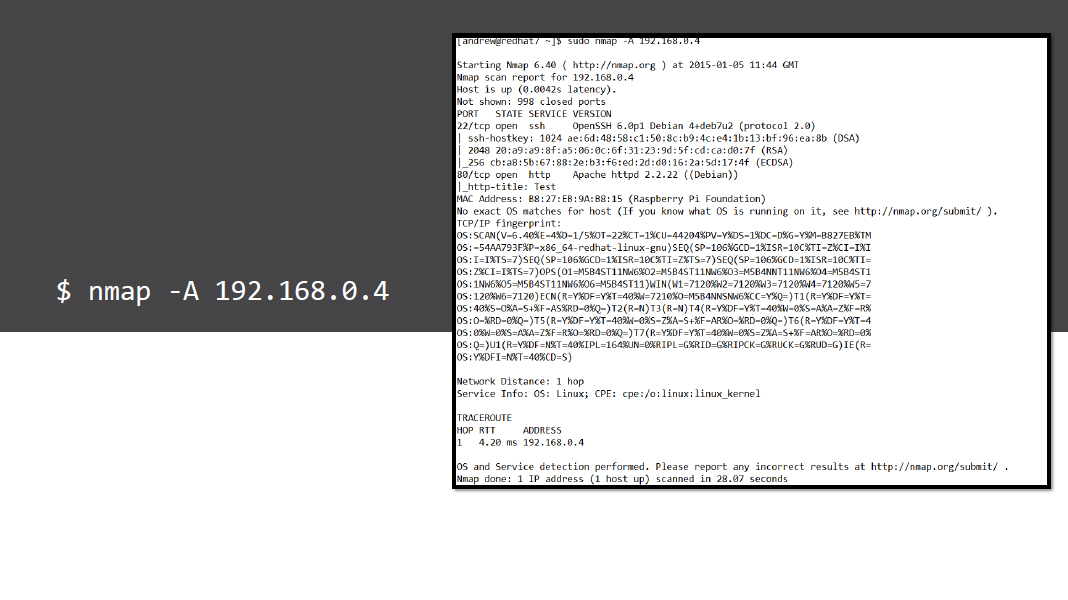
- One can be a little aggressive using the -A option which includes OS detection
	$ nmap -p80 192.168.0.4

	$ nmap -p80 --script http-title 192.168.0.4

	$ nmap -p80 --script http-enum 192.168.0.4

	$ nmap -p80 --script http-enum \

	--script-args http-enum.displayall 192.168.0.4
- If we only want to check the one port then use -p80, it will be quicker
- Using NSE scripts we can start to gain more information
- Arguments to scripts can show even more
Working with HTTP
Demo: Network Auditing with nmap
Objective 205.3
Troubleshooting Network Issues
Network troubleshooting tools
- ip / ifconfig / route
- iptables -L
- ping
- dig , /etc/hosts, nsswitch.conf, resolv.conf
- /etc/hosts.allow + deny
- Log files
- Check we have an IP Address
- The correct subnet mask
- The correct default gateway

- Check blocked ports with the Firewall
- $ sudo iptables -L
- $ sudo iptables -F
- Use nmap to check ports are open
- Check name resolution
- Order of the lookup in /etc/nsswitch.conf
- Use dig or host to check name entries
- Check /etc/resolv.conf along with ifcfg- files
TCP Wrappers
ldd < /path/to/service name > | grep libwrap
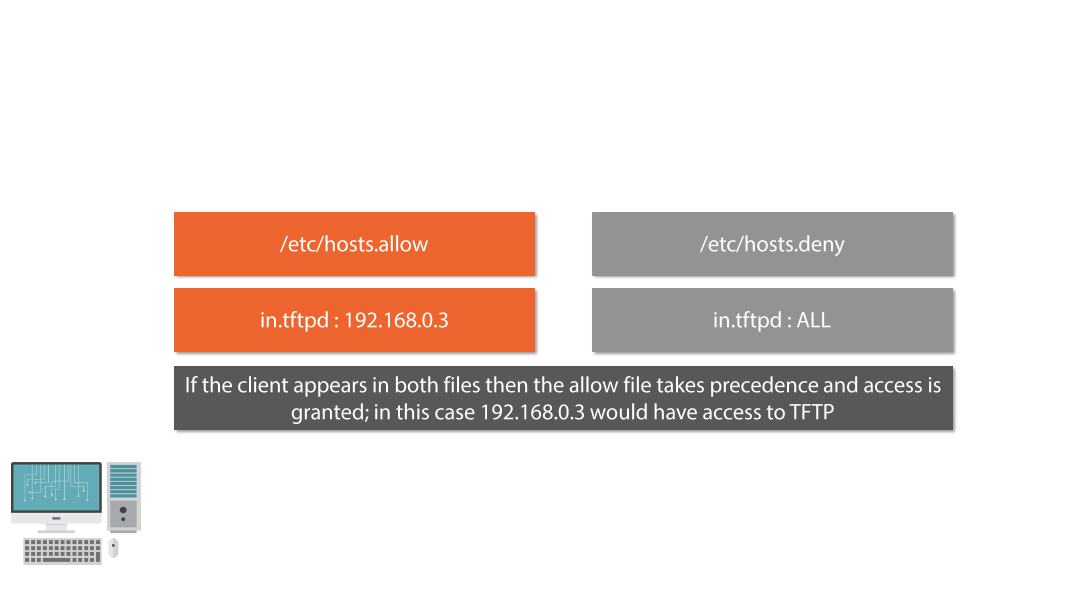
- If a service supports TCP Wrappers then access may be restricted via the hosts.allow or hosts.denv files
- Did you check the logs yet?
- /va r/log/messages or /va r/log/syslog
- /var/log/audit/audit.log
- dmesg
Demo: Network Troubleshooting
Managing Hostnames
Hostnames
The persistent hostname of a system is stored in:
- /etc/HOSTNAME - SUSE
- /etc/hostname - Debian
- /etc/sysconfig/network- RHEL 6
- /etc/hostname & /etc/machine-info - RHEL 7
	$ hostname

	$ sudo hostname a1is
- The transient hostname set from the hostname file and can be displayed using the hostname command
- The root user can change the transient name whilst the system is running but will NOT persist reboots
hostname
And In RHEL7........
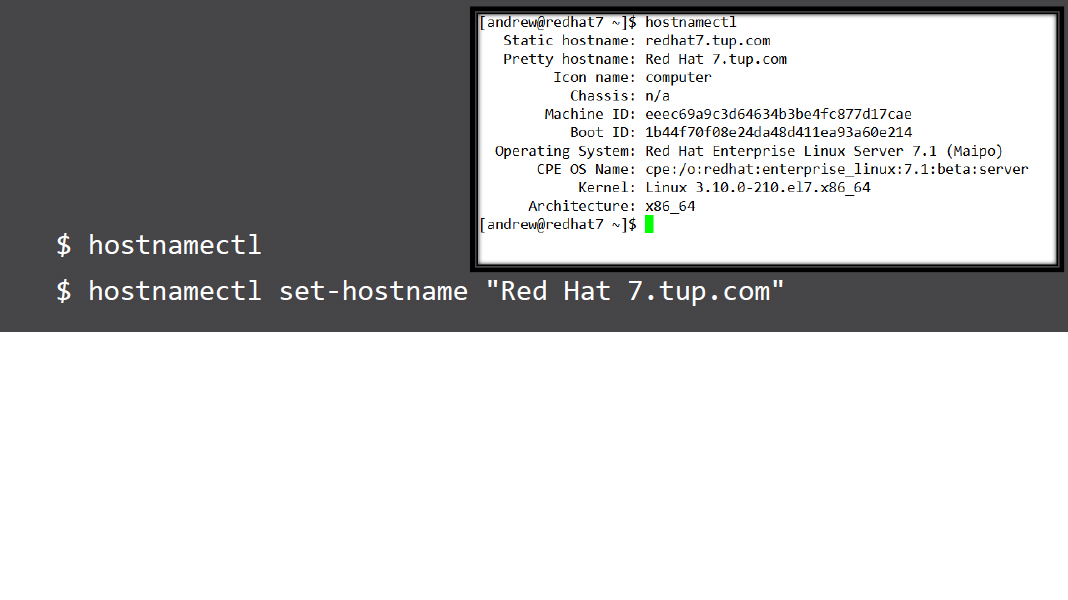
- The hostname can be controlled via systemd using hostnamectl
- The permissions to set the name are controlled via the Policy Kit and members of the wheel administrative group can set the name without the need of sudo. This sets both the persistent and transient names and if required the pretty name
Demo: Using hostnamectl
Red Het Enterprise Linux 7 Network Device Naming Schemes
Consistent Naming Scheme RHEL 7
- With more and more LoM (LAN on Motherboard) and other multi-port LAN adaptors taking to the market place the previously inconsistent naming scheme: eth0, eth1, et cetera has been replaced with the Consistent Naming Scheme. This is where the address of the card is used it’s name. The naming is managed by systemd
                Starting Nmap 6.47 ( http://nmap.org ) at 2015-01-05 15:18 GMT
                                            INTERFACES

		DEV        (sHoRT)       IP/MASK

		enp9s0     (enpgs0)      (none)/0

		(wlpl2s0)  (wlpl2sO)     192.168.0.158/24
- The device enp9sO is EN for Ethernet, P for PCI in bus 9 slot 0
- The device wipi 2s0 is WL for Wireless LAN and PCI bus 12 slot 0
Consider the output from nmap --iflist
	$  lspci | grep 09:00.0

	$  lspci | grep 0c:00.0
- Note for PCI Bus 12 we search for Oc as the Ispci output is in HEX
This addresses can be ratified using Ispci
Disabling Consistent Network Device Naming Method 1
- Add the HWADDR attribute to network script file and either rename the file ifcfg-eth0 or configure the DEVICE name attribute
Disabling Consistent Network Device Naming Method 2
- Edit /etc/default/grub
- GRUB_CMDLINE_LINUX=”crashkernel=auto biosdevname=0 net.ifnames=0 quiet”
- # grub2-mkconfig -o /boot/grub2/grub.cfg
Demo: Setting Inconsistent Network Device Names
NetworkManager
NetworkManager
- The NetworkManager service appears in many different Linux distributions including RHEL 7 and Ubuntu 14.04. As well as the obvious access to the GUI to ease connection toWiFi it can provide an easy mechanism to store many configurations per interface.
Interacting with NetworkManager RHEL 7
- sudo systemctl status NetworkManager.service
- Control Center
- nmtui
- nmcli

$ nmcli devie wifi list
Listing WiFi Networks with nmcli
	$ sudo nmcli connection add con-name wired-home \

	ifname enp9s0 type ethernet ip4 192.168.0.8/24 gw4
	192. 168 .0. 1
	$ sudo nmcli connection modify wired-home ipv4.dns
	“192.168.0.3 8.8.8.8”

	$ nmcli -p connection show wired-home
Creating Connection Profiles with nmcli
- We can add new connections profiles
- We need to edit the connection profile to add DNS information
- Use show to display the connection profile
Demo: Using nmcli
Summary
- Used port monitoring and packet capture tools
- Troubleshooting networks
- RHEL 7 Consistent Network Device Names
- Hostnames
- NetworkManager service
Next Up: Project - Building a Raspberry P1 Wireless Access Pointand Router
Project: Building a Wireless Access Point
Module Overview
- Real Life Project for your DIY Shed
- Raspberry Pi Wireless Access Point
- Raspberry Pi Model B or B+
- RalinkTechnology, Corp. RT5370 Wireless Adapter
Public Access WiFI @ DIY’R’Us
- It has been decided that all of the DIY’r’Us stores will offer free public WIFI. To keep traffic separate from the corporate users and servers the public WIFI will need to be on a separate network. To keep costs down and promote the nature of Do-it- You rself. Danny is creating WAP from Raspberry Pis

Wireless NIC
- The NIC requires support n18021 1 driver to work without modification to the hostapd service (WAP)
- The chipset RT5370 is supported
- Prefer external antenna

	$ lsusb

	Bus 001 Device 002: ID 0424:9512 Standard Microsystems Corp.

	Bus 001 Device 001: ID ld6b:0002 Linux Foundation 2.0 root hub

	Bus 001 Device 003: ID 0424:ec00 Standard Microsystems Corp.

	Bus 001 Device 004: ID 148f:5370 Ralink Technology, Corp. RT5370 Wireless Adapter
Discovering your Wireless Card
- The command Isusb can list the content of the USB Bus
	$ sudo vi /etc/network/interfaces

	auto wian0

	iface wian0 inet static

	 address 192.168.1.1

	 netmask 25S.255.255.0
Configuring a Static IP Address for wian0
- Network configuration is stored on a Debian based system in /etc/networklinterfaces
- Lines starting with auto will bring the interface up at boot time or ifup -a
- The line for wpa-roam can be deleted or commented as it is not required for WAP
	$ sudo ifdown wlan0

	$ sudo ifup wlan0

	$ ip address show wlan0
Restart the wian0 interface
- You may also like to reboot the P1 to ensure the interface is brought up correctly at boot time
Demo: Static Address wian0

	$ sudo vi /etc/sysctl. conf

	# Uncomment the next line to enable packet forwarding for

	IPv4

	net. ipv4.ip_forward=1

	$ sudo vsctl -p
Enabling routing on the Pi
- To enable routing uncomment the line that sets ip_forward
- Load those setting with sysctl
	$ sudo iptables -t nat -A POSTROUTING -o eth0 -j MASQUERADE

	$ sudo bash —c “iptables-save > /etc/iptab1’nat”

	$ sudo vi /etc/network/interfaces

	up iptables-restore < /etc/iptables.nat
- Network Address Translation will allow access to network and Internet resources from the private address range of the WIFI
Enable NAT on the Pi
Demo: Configure Routing and NAT

	$ sudo apt-get install isc-dhcp-server

	$ sudo vi /etc/default/isc-dhcp-server

	INTERFACES= “wlan0”

	$ sudo sed -i.bak ‘/“#/d;/’$/d’ /etc/dhcp/dhcpd.conf
Install the DHCP Server on the Pi
- The DHCP Server will issue IP Addresses from the WAP
- Make sure the INTERFACES directive points to wian0
- Backup and clean the dhcpd.conf
/etc/d hcp/d hcpd.conf
	$ sudo vi /etc/dhcp/dhcpd.conf

	ddns-update-style none;

	option domain-name 1texample. corn”;

	option domain-name-servers 192.168.0.3, 8.8.8.8;

	default-lease-time 604800;

	max-lease-time 604800;

	log-facility local7;

	subnet 192.168.1.0 netmask 255.255.255.0 {

		range 192.168.1.10 192.168.1.254;

		option broadcast-address 192.168.1.255;

		option routers 192.168.1.1;
	}
	$ sudo service isc-dhcp-server start

        $ sudo update-rc.d isc-dhcp-server defaulls
Start the DHCP Server
- We can now start the DHCP service
- Additionally we will set DHCP to auto start
Demo: Configure DHCP

	$ sudo apt-get install hostapd

        $ sudo vi /etc/init.d/hostapd

        DAEMON_CONF=/etc/hostapd/hostapd. conf
- We install the hostapd service which will act as the WAP
- Within the service mit script we need to point to the main configuration file
Installing the WAP Service
Configure the WAP
	$ sudo vi /etc/hostapd/hostapd.conf

	interface=wlan0

	ssid=WIFI_ACCESS

	channel=6

	hw_mode=g

	wpa=2

	wpa_passphrase=password1

	wpa_key_mgmt=WPA- PSK WPA-EAP WPA-PSK-SHA256 WPA- EAP-SHA256
	$ sudo vice hostapd start

	$ sudo update-rc.d hostapd defaults

	$ sudo hostapd /etc/hostapd/hostapd.conf
- We can now start the WAP and set for auto-start
- If it does not start troubleshoot by starting the service manually
Starting the WAP
Demo: Configure WAP

Summary
- Configure Raspberry Pi WAP
- DHCP Server
- IP Routing and NAT
- WAP service from hostapd
Next Up: Make and install programs from source, LPI objective 206.1
Build C Programs from Source
Module Overview
- Unpack files from archives
- Configure, Makefiles and make
- Compile C code
- Patching source code with patch and diff
Module Overview
- For this module we use predominately the Raspberry Pi which is a Debian based distribution. Package management differs to RHEL based systems however the basics of compiling from source are consistent.
- We use RHEL 7 to compile nmap from source.
Objective 206.1
Make and install programs from source
DIY ‘R’ Us Promotes OSS
Even though DIY ‘R’ Us are a hardware store the promotion of Open Source Software develops a culture of DIY within the organization; this in turn builds the correct public image for the company.
Archives and Compression Tools
- Often source code will be packaged within an archive
- LPI Objective 206.2 looks at backup solutions and is covered within a later module to this course
Source Packages
- The source for OSS packages can be downloaded from official repositories
- Ensure source repo is included in etc/apt/sources.list
deb-src http://mirrordirector.raspbian.org/raspbian/ wheezy main contrib non-free rpi
	$ sudo apt-get source nmap

         $ is /usr/src/nmap-6.00
- Here we install the source package for nmap, the port scanner
- The package is added to /usr/srcl< package name and version >
Obtaining source packages
Demo: Configure and Use Source Repositories on Raspberry Pi
	$ sudo yum groupinstall “Development Tools” #RHEL

	$ sudo apt-get install build-essential #Debian

	$ zypper install --type pattern devel_basis #SUSE
- Depending on your platform the development tools we require can be installed with the following software groups
Installing Software Compilation Tools
	$ cd /tmp

	$ wget http://nmap.org/dist/nmap-6.47.tar.bz2

	$ tar -xjvf nmap-6.47.tar.bz2 && cd nmap-6.47
- RHEL 7 ships with nmap version 6.40 the, currently, very latest version is close to that 6.47
- If we want or need the very latest version we will need to download it from nmap andexpand the archive
Obtain latest version of nmap
Compiling from Source
- ./configure
- Configure script create the Makefile instruction set to compile for your system
- --without-ndiff --without-zenmap --without-nping
- options can be supplied to the configure script
- make
- Looks for Makefile and instruction to compile
- sudo make install
- Checks Makefile for install actions
- nmap --version
Demo: Compiling nmap 6.47 from Source
Compiling Your Own C Code
	        #include < stdio.h >

		#include < string.h >

		main () { 1* yes this is poor code but we will patch later */

		char answer[3];

		printf("What is the gnu  compiler called?");

		fgets(answer,4, stdin);

		if ( strcmp (answer,"gcc")== 0);{

				   printf("Correct\n");

				   }
		else {

		printf("Sorry - gcc is correct\n");

		   }
		}
Using gcc
- gcc question.c -o question
- The code is compiled into the output binary
- /question
- It is compiled with the execute permission
Demo: Using gcc
Creating Patches
- Patches are used to update source code
- Copy the source to a new version file
- Edit the new source file
- Use duff to compare version and create patch file
- Distribute the patch
New Version
	        #include < stdio.h >

		#include < string.h >

		int main () {

		char answer[3];

		printf(" What is the gnu  compiler called? ");

		fgets(answer,4, stdin);

		if ( strcmp (answer,"gcc")== 0);{

				   printf("Correct\n");

				   }
		else {

		printf("Sorry - gcc is correct\n");

		   }
		}
$ diff -u question.c questionvl.c > question.patch
- The resulting patch is the difference between the original source and the new source and can be used to patch the original source version
Create the patch file
         $ cd /usr/src/c/question

	$ my /tmp/question.patch.

	$ patch < question.patch
- Copy the patch file to the correct directory and run the patch command reading inthe patch
Patching the original source file
Demo: Using diff and patch
Summary
- Downloaded source deb packages
- Downloaded source code
- Unpacked and viewed the source
- Used configure scripts to create Makefiles for maketo use
- Used duff and patch to patch source code
Next Up: Backing up data, LPI objective 206.2
Backup Operations
Module Overview
- Archiving with tar
- Mirror directories with rsync
- Image disks with dd
- Tape Devices
- Bacula and other backup suites
Used in this Module
- For this module we use predominately the Ubuntu 14.04 LTS.
- This is a popular Debian based distribution however many of the demonstrations shown here are not dependent on the distribution
Objective 206.2
Backup Operations
DIY’R’Us Backup Strategy
- Backup strategy! How often have we heard that term, usually very accusatively when something has gone wrong? Danny and DIY’R’Us are very keen to avoid any incriminations by ensuring nothing goes wrong and here Danny reviews the backup strategy before implementing Bacula.
Archives and Compression Tools
- Simple backup and restore solutions can be provided by the command tar and if required compressed using algorithms such as gzip and bzip2

/bim/tar
- The command tar itself orTape Archive is used to create a single file from one or more files or directories
- -c to create an archive
- -t to test or verify an archive
- -x is used to expand or restore the archive
/bin/gzip
- The archive can be compressed with gzip with the -z option
- Or afterwards with gzip
- gzip etc.tar
- The above will create etc.tar.gz
- Expand using gunzip etc.tar.gz
/bin/gzip2
- Similarly, bzip2 compression can be used with -j option
- Or afterwards with bzip2
- bzip2 etc.tar
- The above will create etc.tar.bz2
- Expand using bunzip2 etc.tar.bz2
Demo: Using simple backup solutions
Mirror Directories with rsync
- Locally: rsync -rv /home/ /backup
- Remotely: rsync -rye ssh /home/ fred@svrl :/backup
- Configure a rsync server, often used as distributions mirrors
- TCP Port 873
Configure rsync Server on Ubuntu
	$ sudo vi /etc/default/rsync

	RSYNC_ENABLE=true

	$ sudo vu /etc/rsyncd.conf

	[dod]

	path = /usr/share/doc

	read only = true

	$ service rsync start

	$ rsync -av serverl::doc/ /data
Demo: Configure the rsync server
Duplicating Disks with dd
- The command dd can be used to image a disk or partition
- dd if=/dev/cdrom of=/tmp/disk.iso
- dd if=/dev/sda of=/tmp/sda.mbr count=1 bs=512
Demo: Using dd
Tape Device
- Rewinding tape device:
- /dev/st*
- Non-Rewinding tape device
- /dev/nst*
- Utility to control magnetic tapes
- bin/mt

Backup Suites
- Bacula
- Amanda
- BackupPC
Backups @ DIY’R’Us
- Whilst these solutions are acceptable and useful in their own right
- Danny needs a central backup server solution to coordinate data archiving and storage
- The consideration is the Open Source Software: Bacula
Bacula Components
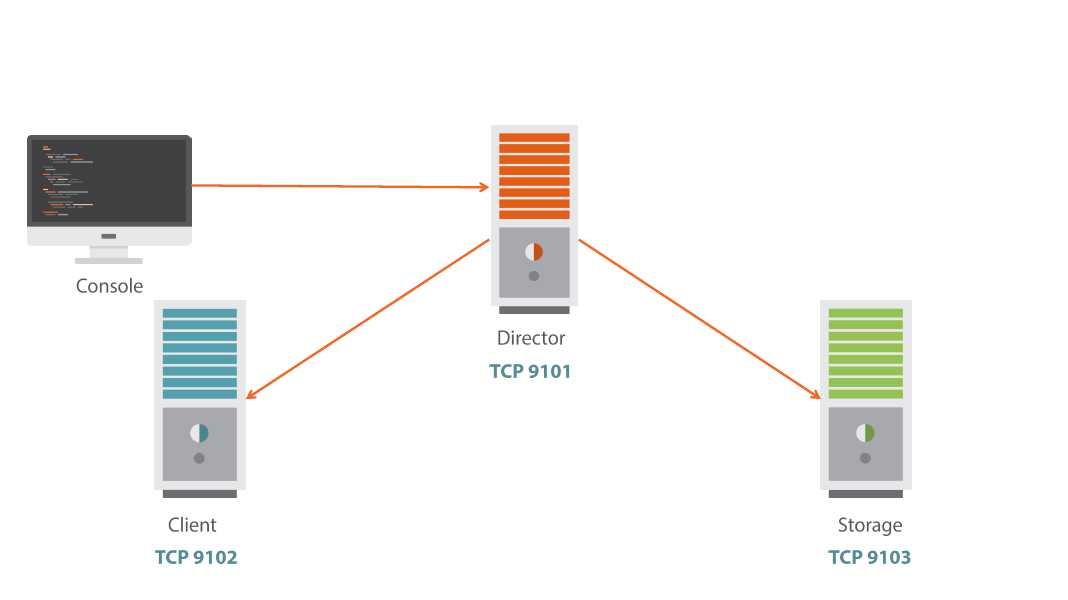
Installing Bacula on Ubuntu
- Bacula requires a catalog, on Ubuntu this defaults to MySQL
- $ sudo apt-get install mysql-server
- To install all elements of bacula: client,storage, director
- $ sudo apt-get install bacula
$ mysql -u root -p -e ‘USE bacula; SHOW TABLES;
- Bacula supports MySQL, SQLite and PostgreSQL as the catalog server
- Using the mysql client we can check the creation of the database and tables posti nstallation
MySQL Catalog
Demo: Installing Bacula on Ubuntu 14.04
	$ sudo mkdir -p -m 700 /bacula/{restore,backup}

         $ sudo chown -R bacula.bacula /bacula
- On the Storage Server we need to create the /bacu la/backup directory
- On the Client we need to create the /bacula/restore directory
Create Directories
Configure the Storage Server
	$ sudo vi /etc/bacula/bacula-sd.conf

         Archive Device = /bacula/backup

        $ sudo bacula-sd -tc /etc/bacula/bacula-sd.conf

        $ sudo service bacula - sd restart
Configure the Director FileSet
	$ sudo vi /etc/bacula/bacula.dir.conf

	FileSet {

	Name = “Full Set”

	Include {

	Options {

	signature = MD5

	}

	File = /etc

	File = /home

    }
Here we select /home and /etc as backup targets
Configure the Director Job
	$ sudo vi /etc/bacula/bacula.dir.conf

	Job{

	Name = “RestoreFiles”

	Type = Restore

	Client=bacula - server-fd

	FileSet=”Full Set”

	Storage = File

	Pool = Default

	Messages = Standard

	Where = /bacula/restore

	}
Here set the restore target on the cIient
	$ sudo bacula-director -tc /etc/bacula/bacula-dir.conf

	$ sudo service bacula-director restart
- Testing the configuration prior to the service restart is always a good idea and is similar to the testing we saw with the Storage Server
Test Configuration and Restart
Demo: Configuring a Single Server Bacula Solution
Test Backup: Label Media
- Start the console
- $ sudo bconsole
- At the * prompt create a label with:
- *Iabel
- Enter new Volume name
- Choose 2 for the File pool
Test Backup: Backup
- Start the console
- $ sudo bconsole
- *run
- Select Job resource 1 (BackupClientl)
- yes to start the backup
- Check messages
- *messages
Test Backup: Restore
- Start the console
- $ sudo bconsole
- *restore all
- Select 5 for most recent backup
- done to start the restore
- Check messages
- *messages
Check File System

Demo: Testing Bacula
Summary
- Reviewed tar, gzip and bzip2
- rsync and rsync server for mirroring directories
- Used dd to image disks
- Reviewed tape devices
- Installed and used Bacula
Next Up: Notifying users,Objective 206.3
Notify Users
Geez, what do I need to do, use semaphore?
Module Overview
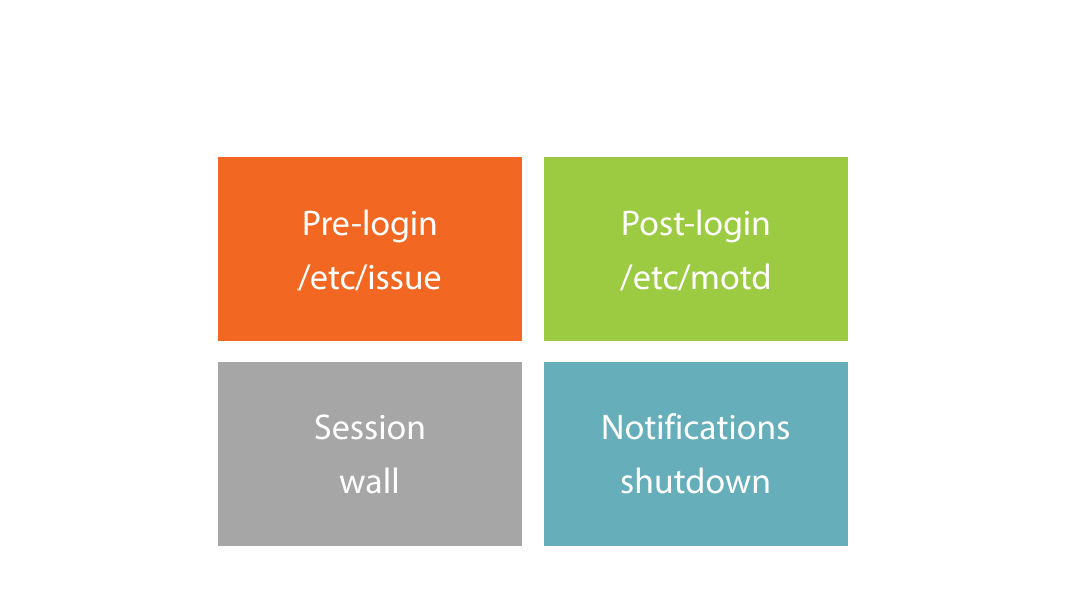
- /etc/issue & /etc/issue.net
- /etc/motd & pam_motd
- wall and shutdown
Used in this Module
- For this module we use predominately the Ubuntu 14.04 LTS.
- This is a popular Debian based distribution but many of the demonstrations shown here are not dependent on the distribution
Objective 206.3
Notify Users on System Related Issues
DIY’R’Us Human Resource Policy
- No company is free from the reach of HR these days and “due diligence” has encouraged HR to ask Danny for a login banner to display reminding users of the
- Acceptable Usage Policy
Pre-Login
- The contents of the file /etc/issue are displayed on physical consoles prior to login by the program initiating the tty
- Support for escape characters that can be read by agetty, getty, mingetty etc
	$ cat /etc/issue

	Ubuntu 14.04.1 LTS \n \1

	Ubuntu 14.04.1 LTS bacula-server tty1
- \n Displays the nodename (hostname) as seen from uname -n
- \I Display the tty name
/etc/issue
- /etc/issue.net
- Used for remote connections such as SSH but shows after login and DOES NOT support ESC characters
Demo: Understanding /etc/issue
Post-Login
- The contents of the file /etc/motd are displayed on physical consoles and pseudo consoles after login
- Controlled via the pam_motd module
- Ubuntu based systems include the directory /etc/update-motd.d/
- Other debian based systems include /etc/motd .taii
The MOTD system seems correct to
remind users of the AUP
Custom MOTD Ubuntu
	$ sudo vi /etc/update-motd.d/95-aup

	#! /bin/sh

	echo “****************************************“

	echo “***** DIY’r’Us Stores             ******"

	echo “***** Remind you to read usage policy **“

	echo “***** http://intranet/aup.html    ******"

	echo “****************************************“

	$ sudo chmod +x /etc/update-motd.d/95-aup
Demo: Customizing the MOTD
Send Messages to Logged in Users
- All users can use wall but is more often used by root
- Console messaging needs to be turned on if sent by standard users but not if sent by root
- sudo wall
Demo: Using wall to message users
Shutdown
- The shutdown command can include a message to warn users of the impending disaster
- If a time element is used rather than "now" logins are disabled 5 minutes before the shutdown by /etc/nologin
- $ sudo shutdown -h +6 \ “Server is being shutdown”

Demo: Understanding shutdown
Summary
- Danny has satisfied the HR requirement and in doing so have helped the team in better understanding some common tools and utilities
Message Order
Next Course: Linux Kernel and System Startup LPIC-2
Questions?