Datadog APM
by DevOpsSchool.com
Rajesh Kumar
(Senior DevOps Manager & Principal Architect)

-
DevOps@RajeshKumar.xyz
www.rajeshkumar.xyz
/RajeshKumarLog
/RajeshKumarIN
/RajeshKumarIN
Rajesh Kumar — an award-winning academician and consultant trainer, with 15+ years’ experience in diverse skill management, who has more than a decade of experience in training large and diverse groups across multiple industry sectors.
Why is monitoring hard?
Why Performance is very critical?
- A 1-second delay in response time can reduce conversions by 7%, page views by 11%, and customer satisfaction by 16%
- More than half (51%) of online consumers in the US said that site slowness is the top reason they would abandon a purchase
- When online service fails, 75% of consumers move to another channel, which can lead to millions of lost dollars
What is APM?
Application Performance Monitoring (or APM) gives you grouped views of your application's performance trends for quick and easy diagnosis of performance problems.
What is APM?
Application Performance Management or APM is a set of methodologies and practices for monitoring and managing complex software applications.
What is APM?
APM helps you understand and improve the relationships between your applications, your customers, and your business.
What is APM?
Application performance monitoring is the strategy and practice of
- Continuously monitoring and tracking
- The performance of business applications and the user experience of end users as they access the applications
- To understand trends, Isolate anomalies, and
- Get actionable insight for problem resolution and code optimization.
Why APM?

Why APM?
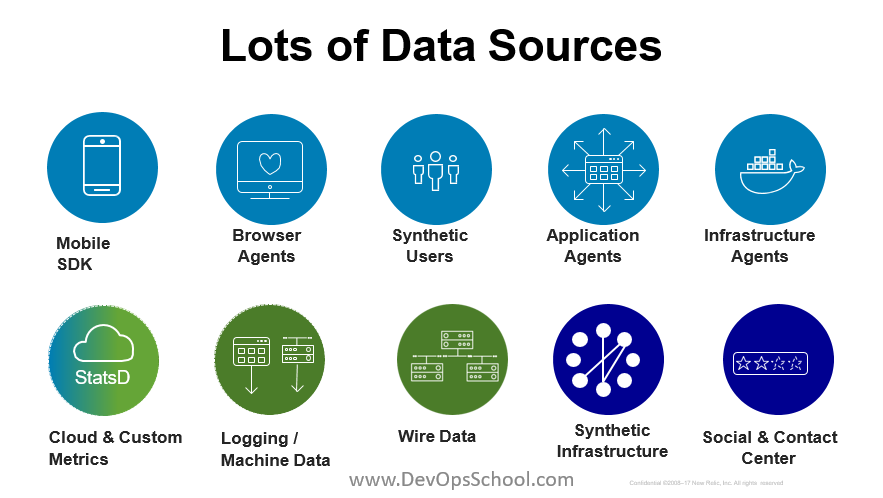
Methodologies to Obtain data
Agent Based Solution: This is a solution where you have a piece of software, or an agent if you will, injected within an Application. It will report back on what this application is doing internally along with complex metrics. The negative aspect though of having one of these agents is it will incur some overhead onto your application but the visibility you gain is priceless and the overhead is minimal.
Agentless Based Solution: This is a solution where instead of directly monitoring the Application you analyze its surroundings. This would be ideally gathering all the information within a data center. This is generally done by spanning ports and analyzing the packet level information (for the paranoid, it does not analyze the Payload!). Unlike the agent based approach you have no overhead, but you do get constrained in terms of the amount of data you obtain.
Methodologies of how we monitor?
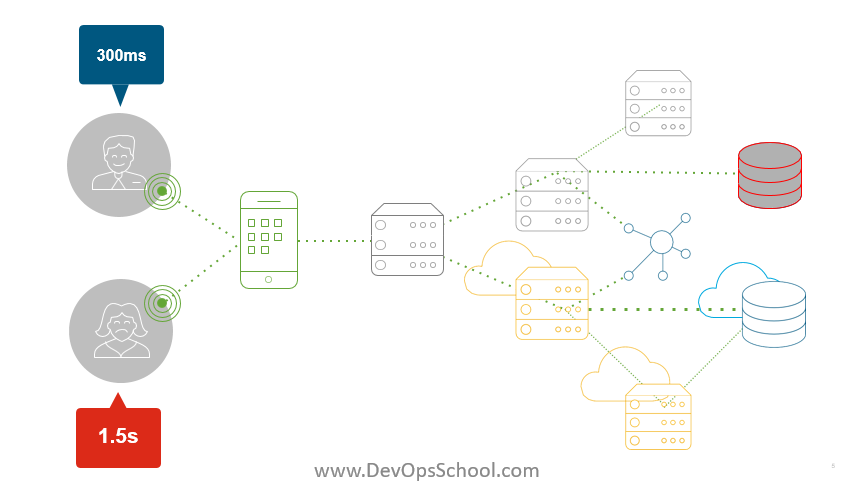
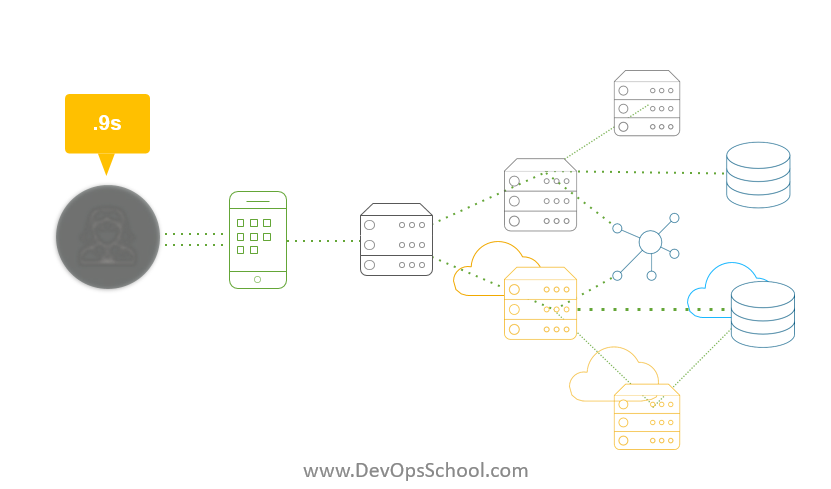
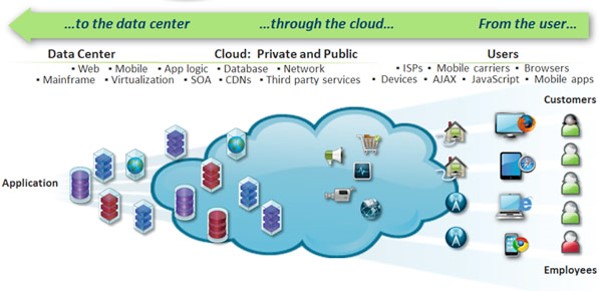
Real User Monitoring:RUM is the notion that with the evolving complexity of modern day computing in order to truly identify performance you must go all the way back to the end user. This involves going all the way through the delivery chain(like the figure above) back to the data center and having all the metrics associated with those transactions.
Business Transactions:BT's make our lives easier. The purpose of BT's is to take all the data collected and aggregate them into high level concepts. It draws many similarities to a Select statement from SQL. For example if the business wants to look at the revenue per item, an APM tool would find the methods which return these values and make these metrics. The amount of data collected can be scary so BTs simplify this data and make it translatable to any dialect in the corporate world.
End goal of APM is simple
- Automatic reports
- Alerts, and
- Warning signals
- when your response time of your transactions start increasing, red flags are waved;
- when a transaction starts failing, a developer already knows of the issue because the APM team has reported on the trending data.
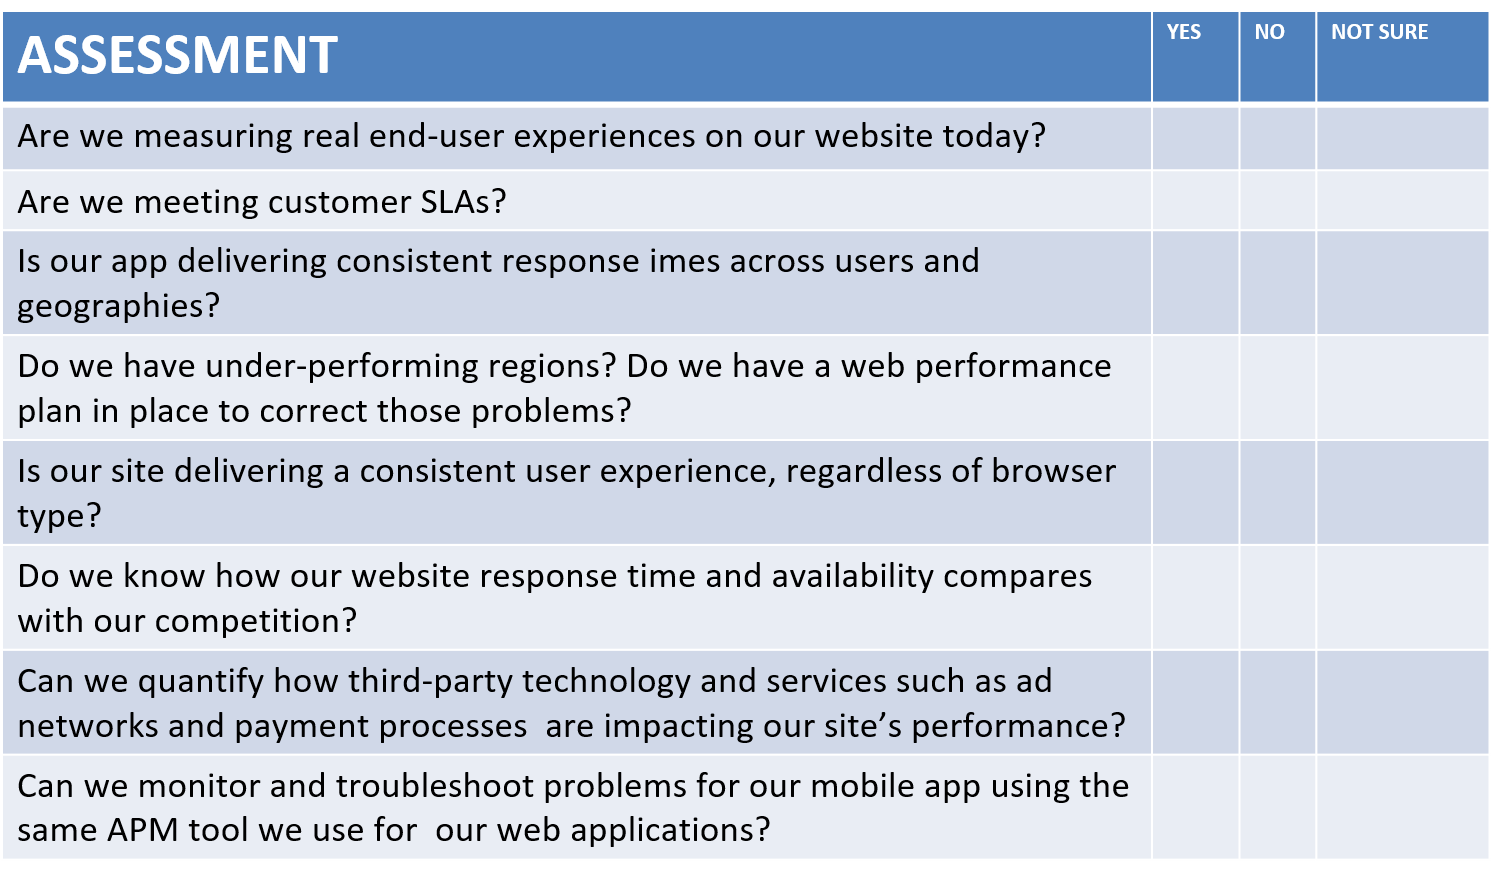
APM Selection Criteria
- Platform/Language support - Does it support Ruby, Python, .Net?
- Developer Familiarity
- Ease of Use - setup -> diagnostics -> fix
- Integration Support - HipChat/Slack/Jira/GitHub/Chef/Puppet
- Pricing
What is Datadog?
Datadog Application Performance Monitoring (APM or tracing) provides you with deep insight into your application’s performance - from automatically generated dashboards for monitoring key metrics, like request volume and latency, to detailed traces of individual requests - side by side with your logs and infrastructure monitoring.
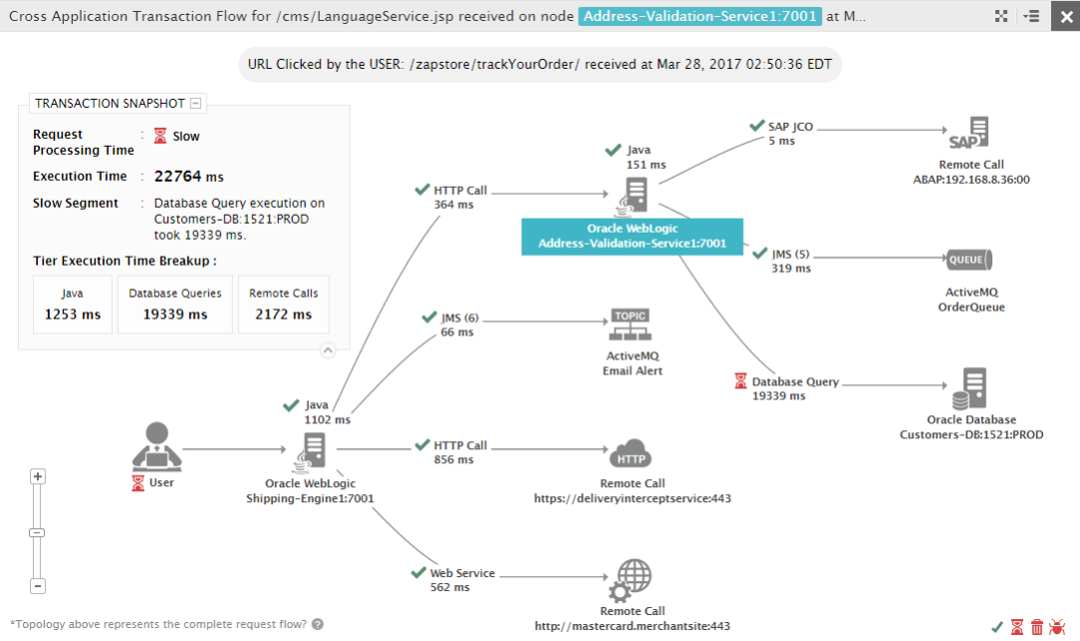
When a request is made to an application, Datadog can see the traces across a distributed system, and we can show you systematic data about precisely what is happening to this request.
Competitors
- Appdynamics - Enterprise focus, no Ruby/Python SDK support
- Compuware - APM, DynaTrace and Gomez
- IBM, HP, Dell, Microsoft
- Splunk, Logstash
- Systems Monitoring: Gomez, Pingdom, Nagios
- Real User Monitoring: GTMetrics, Google PageSpeed
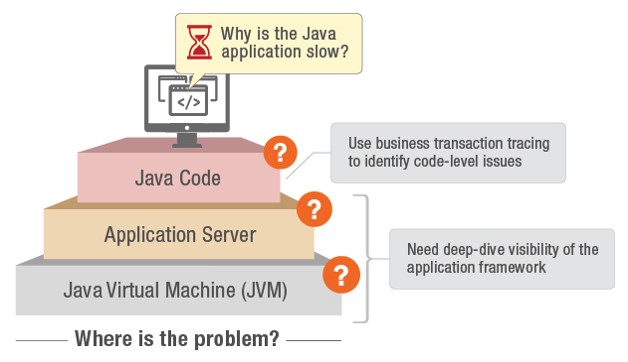
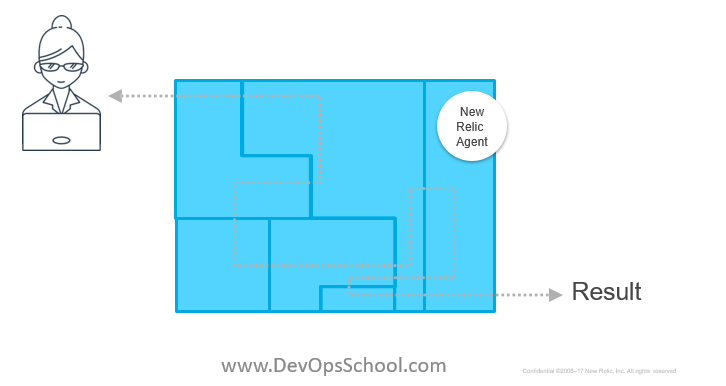
What is a transaction trace?
Traces: How Did an Application Arrive at a Result?
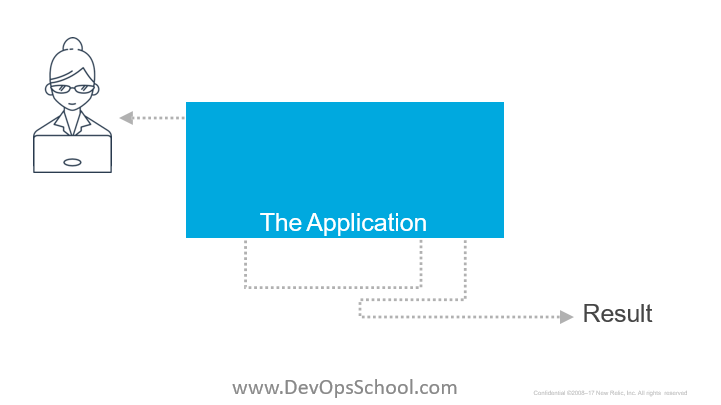
Tracing Provides Information on Which Segments of an
Application Were Involved in a Result
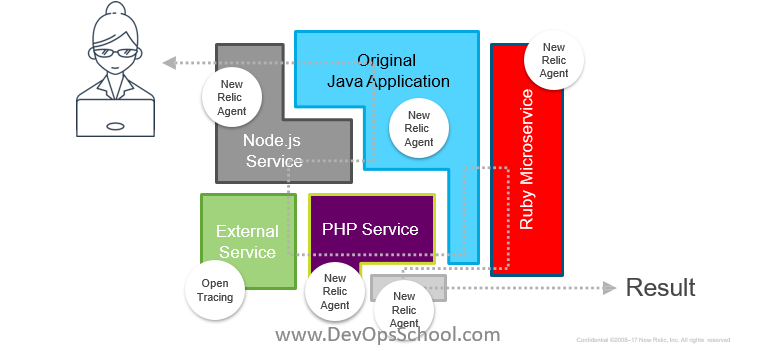
Transactions Are a Central Part of New Relic's Product and Help Developers
Diagnose and Troubleshoot Many Problems Without Guessing.
With Microservices, Applications ("Monoliths") Get
Broken Up Into Smaller Pieces.
The Traces Now Go Through Multiple Programs.
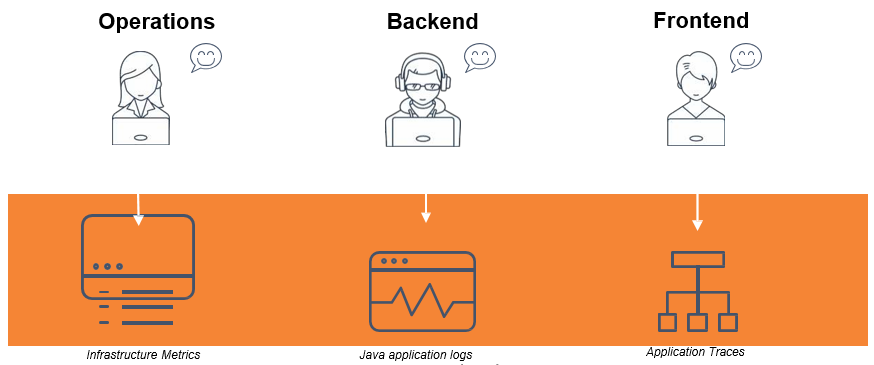
To answer operational questions, teams define
their own metrics, logging, and alerting practices.
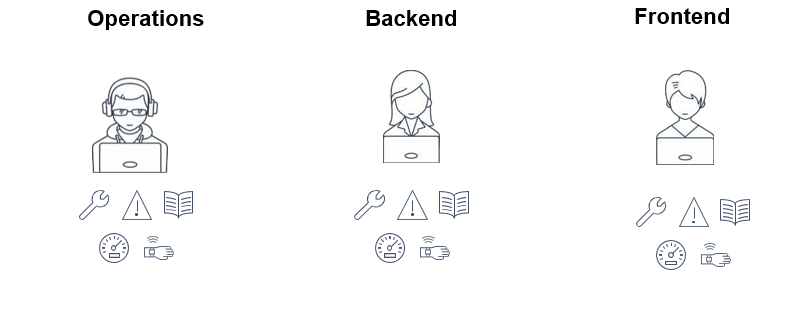
Important operational data becomes siloed by service,
app, or infrastructure type.
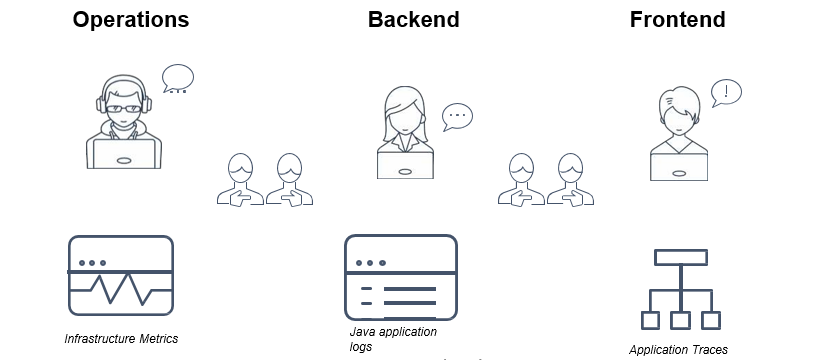
New Relic consolidates operational data to answer hard
questions across teams, apps, and platforms.
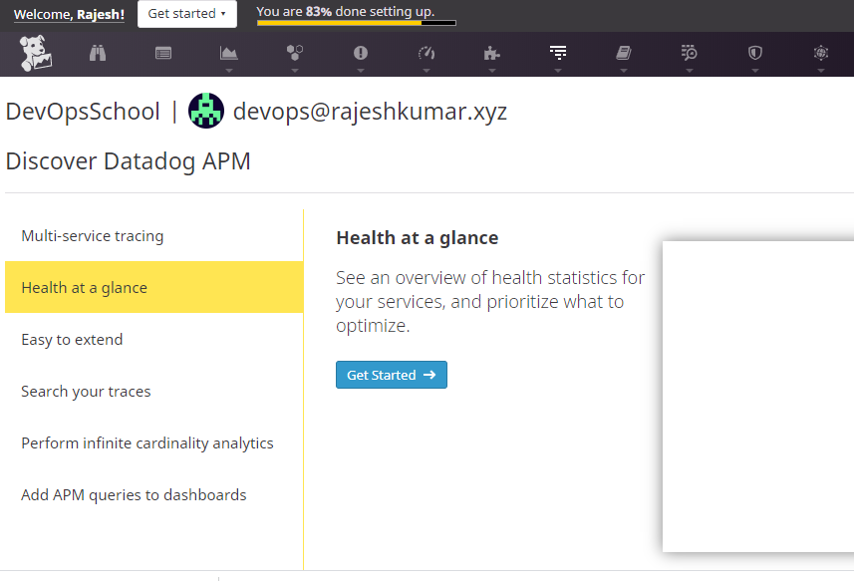
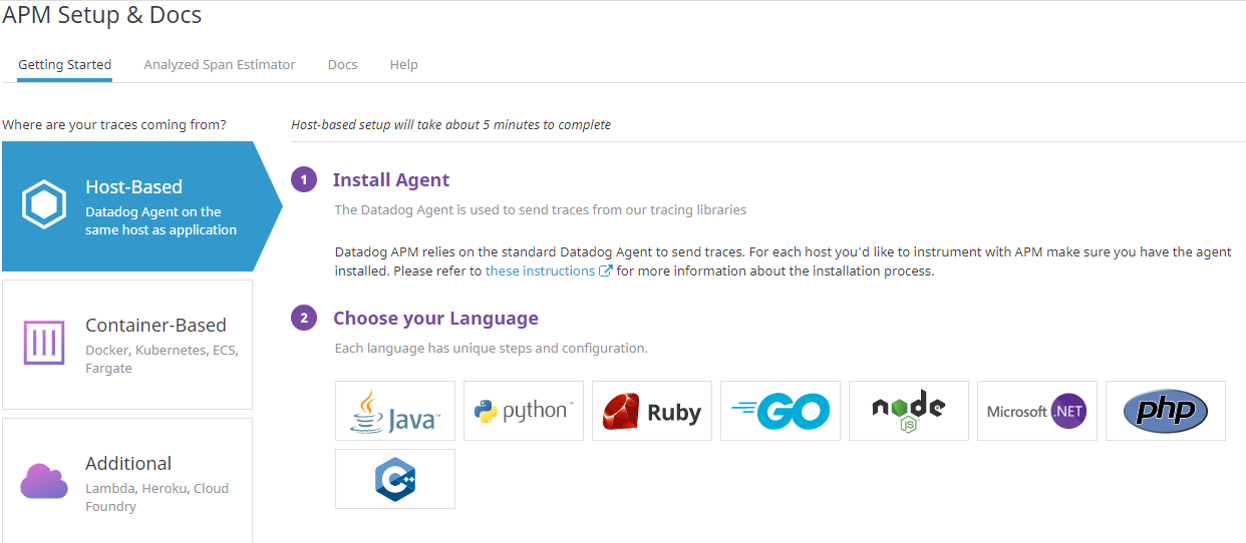
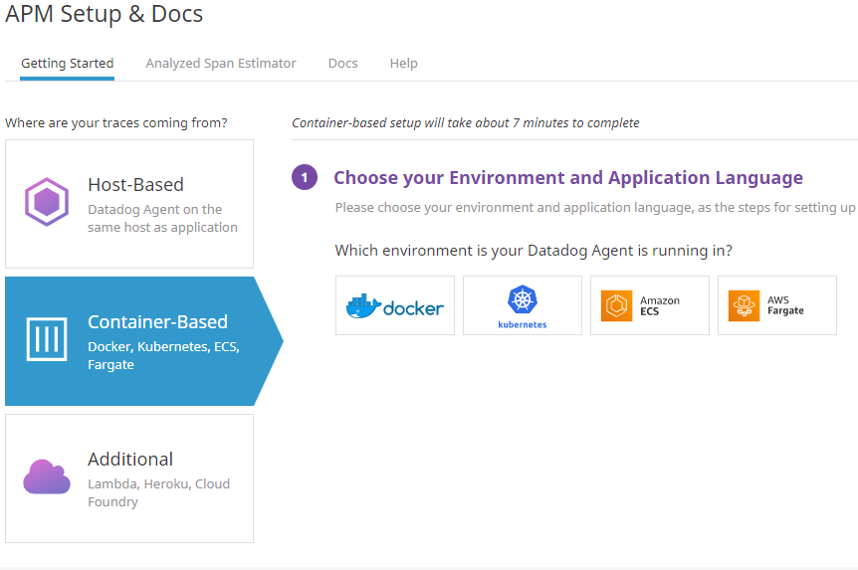
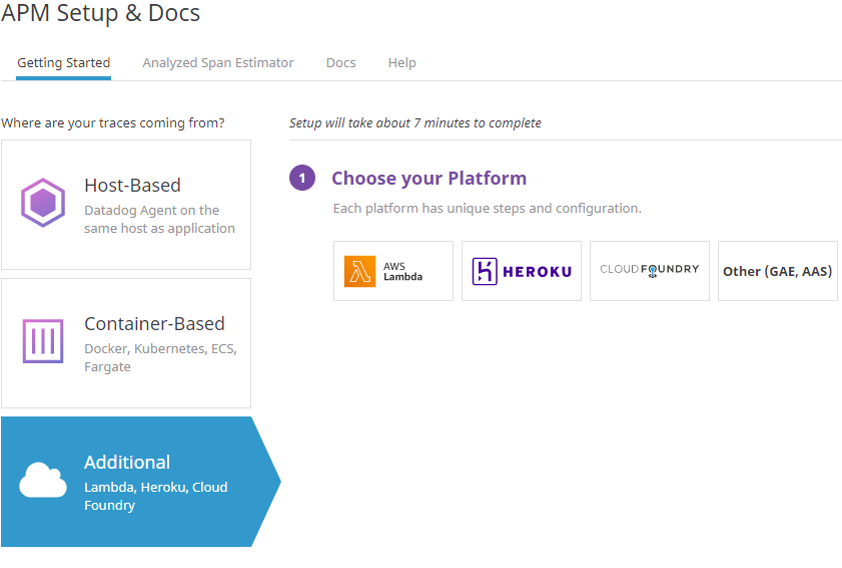
Datadog: Get Started
DevOpsSchool Community Networks
These platforms provide you the opportunity to connect with peers and industry DevOps leaders, where you can share, discuss or get information on latest topics or happenings in DevOps culture and grow your DevOps professionals network.
 |
|---|
| DevOps |
| Build & Release |
 |
|---|
| DevOps |
| Build & Release |
 |
|---|
| DevOpsSchool |
| DevOps Group |
 |
|---|
| BestDevOps.com |

Any Questions?

Thank You!
DevOpsSchool — Lets Learn, Share & Practice DevOps
Connect with us on
contact@devopsschool.com | +91 700 483 5930Next up:

Datadog Course
7. Datadog Log Monitoring