Datadog Essentials
by DevOpsSchool.com
Rajesh Kumar
(Senior DevOps Manager & Principal Architect)

-
DevOps@RajeshKumar.xyz
www.rajeshkumar.xyz
/RajeshKumarLog
/RajeshKumarIN
/RajeshKumarIN
Rajesh Kumar — an award-winning academician and consultant trainer, with 15+ years’ experience in diverse skill management, who has more than a decade of experience in training large and diverse groups across multiple industry sectors.
What is Datadog?
- Datadog is a monitoring service for cloud-scale applications, providing monitoring of servers, databases, tools, and services, through a SaaS-based data analytics platform.
- They built Datadog to be a cloud infrastructure monitoring service, with a dashboard, alerting, and visualizations of metrics.
- Datadog was listed in Forbes’ Cloud 100 and was ranked in the top ten fastest growing companies in North America in Deloitte's 2016 Fast 500 List.
- Datadog was founded in 2010 by Olivier Pomel and Alexis Lê-Quôc
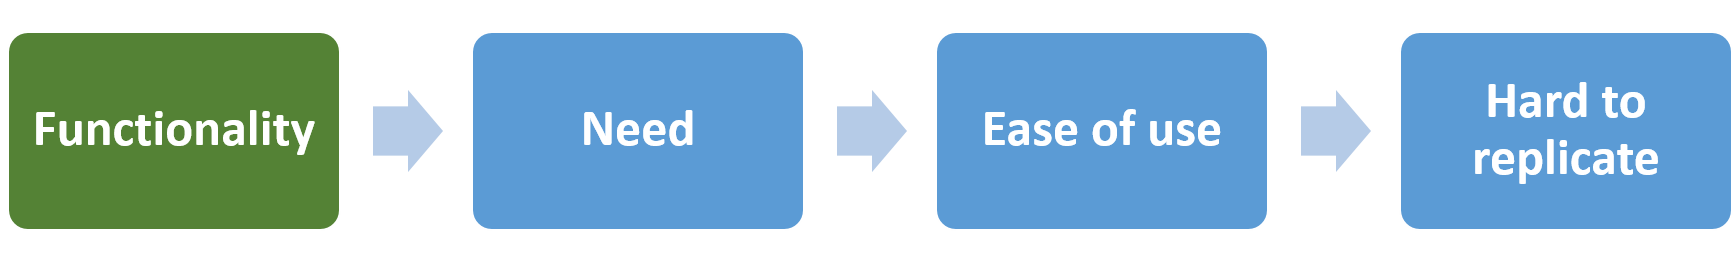
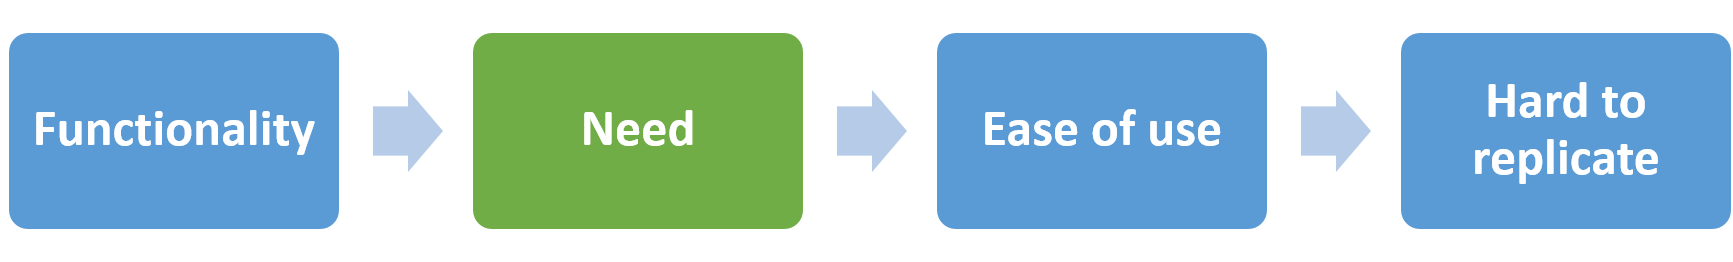
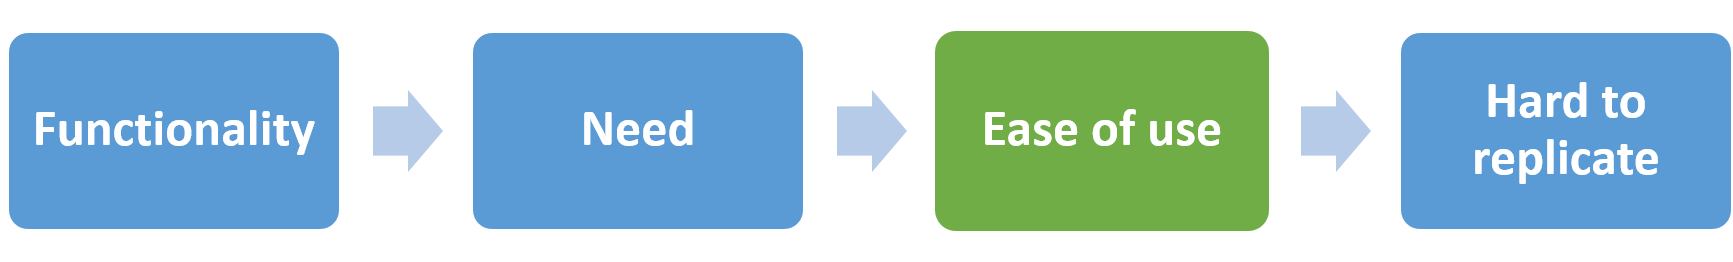
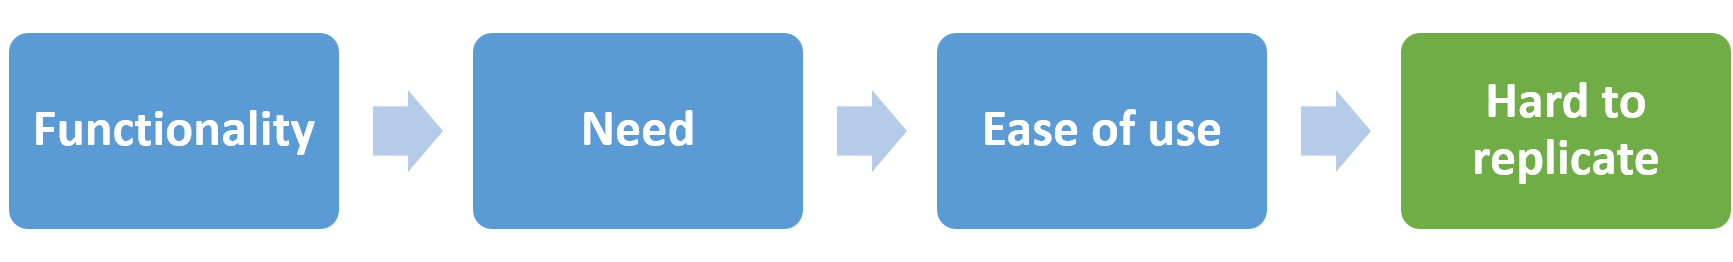
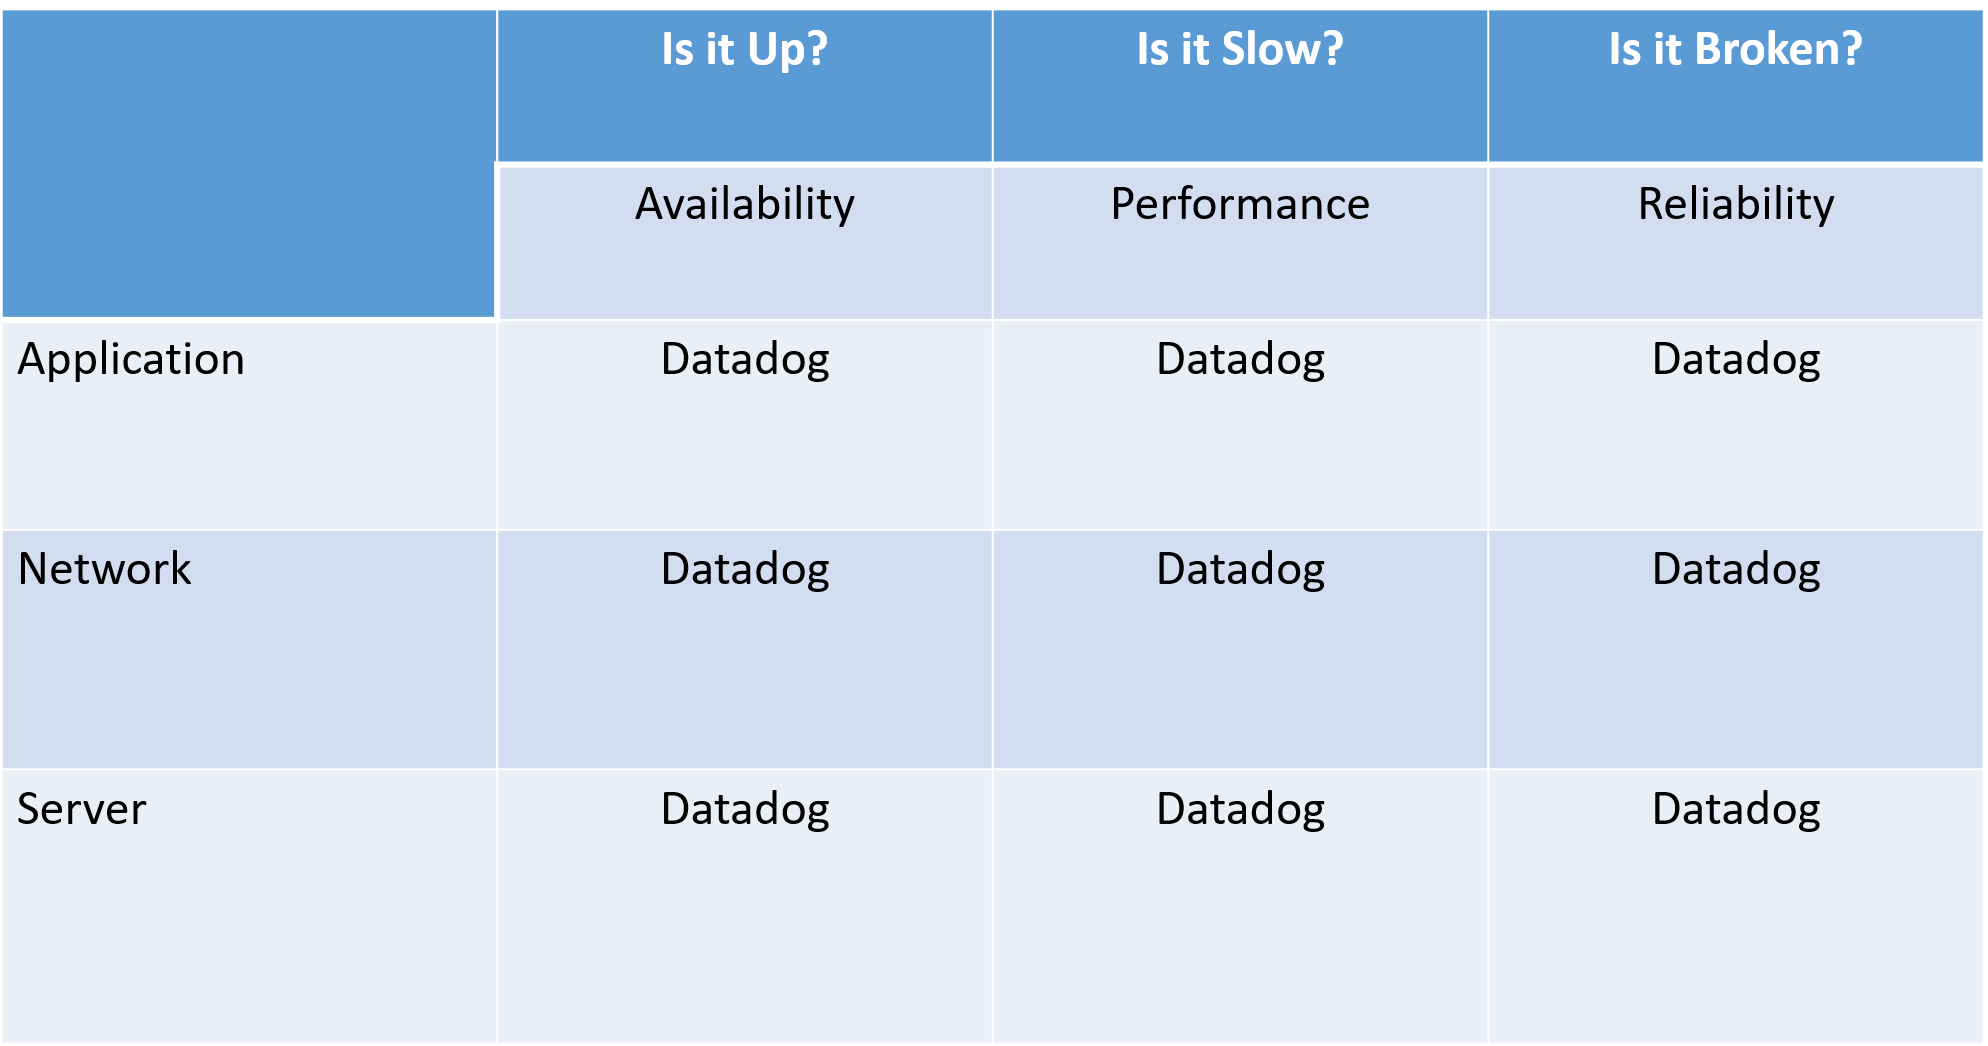
Why Datadog?
Why Datadog?
- Providing functionality
- We need
- In an easy-to-use manner
- That would be difficult to build and maintain ourselves
The agent - It gathers system metrics, integrates with key software we use, and provides a standard interface to which our applications can send custom metrics.
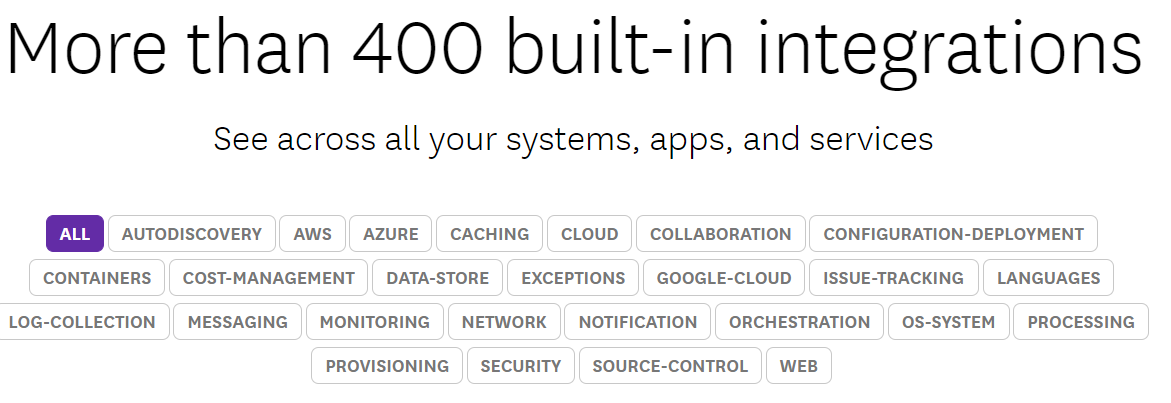
Integrations- Datadog has prebuilt integrations to pull data from almost every important service we use.
Events - Through the integrations datadog generates a consolidated event stream that we can filter and earch as needed.
Dashboards - Datadog lets us build dashboards that combine metrics from many different sources. We can combine and transform metrics to make them more useful. It also provides an powerful interface for interactive exploration of metrics.
Alerting - Datadog has nice stream processing capabilities for generating alerts, and it can surface them in services we use like pagerduty and slack.
The agent - We don't get nearly enough insight from cloudwatch alone, we need an on-instance tool to gather system and app metrics.
Integrations - There are lots of services with operational signficiance, but many of them don't provide a good way to access their data.
Events - We would spend dramatically longer investigating problems if we had to look at eash source of events in isolation. Many of our event sources don't even provide a way for us to view past events or to query them.
Dashboards - Per-service and per-instance dashboards are important for investigating problems quickly. The consolidation of data from multiple sources is again a key feature.
Alerting - We need to do anaylze trends in our metrics and alert on them.
The agent - The agent is deployable via a chef cookbook datadog wrote for us. It requires minimal configuration. It knows which system and application metrics are worth gathering.
Integrations - Integrating with all the data sources is literally a few clicks.
EventsThe interface makes searching and filtering events straightforward.
Dashboards - There are prebuilt dashbaords for lots of things we care about. Snazzy features like autocomplete and templating make building our own dashboards easy.
Alerting - The guided steps and previewed outputs make creating alerts simple.
Here I described a system of collectd, custom code to pull metrics from cloudwatch, custom code to pull or receive events from various sources (airbrake, cloudtrail, chef, pagerduty, jenkins, etc) influxdb, and grafana.
Datadog Workflow
Datadog high-level architecture
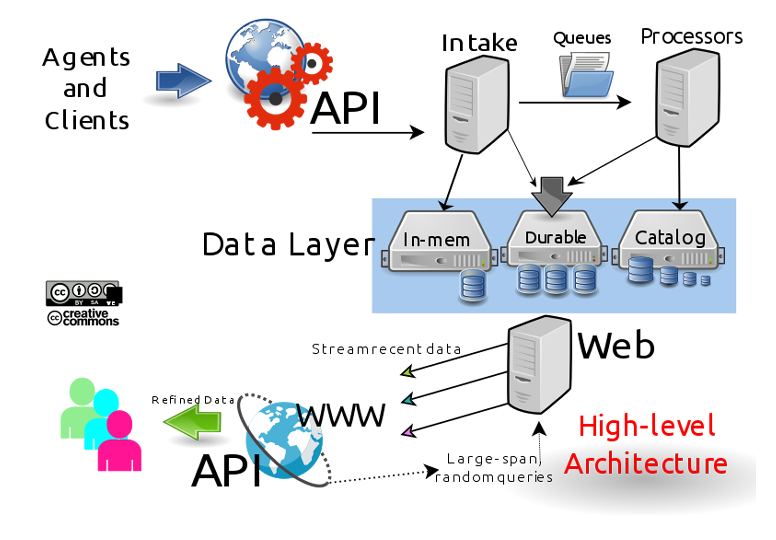
Datadog high-level architecture
Datadog Backend
backend is built using a number of open and closed source technologies including D3, Apache Cassandra, Kafka, PostgreSQL, etc.
Datadog Agent
Datadog uses a Go based agent, rewritten from scratch since its major version 6.0.0 released on February 28, 2018. It was formerly Python based.
Features


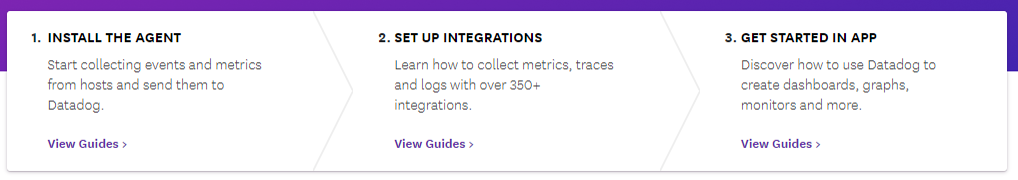
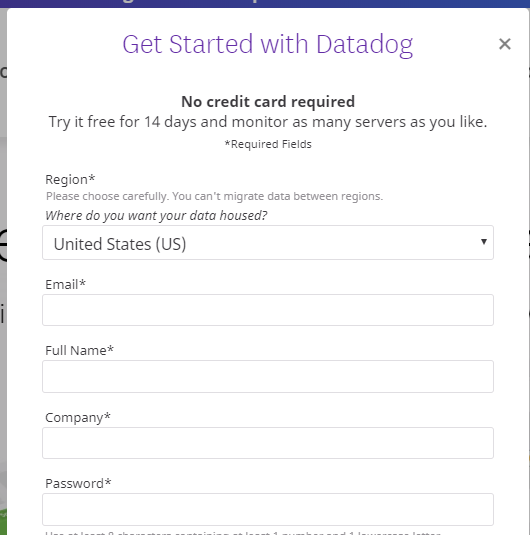
Getting Started
Create a Datadog account. Free for 14 days
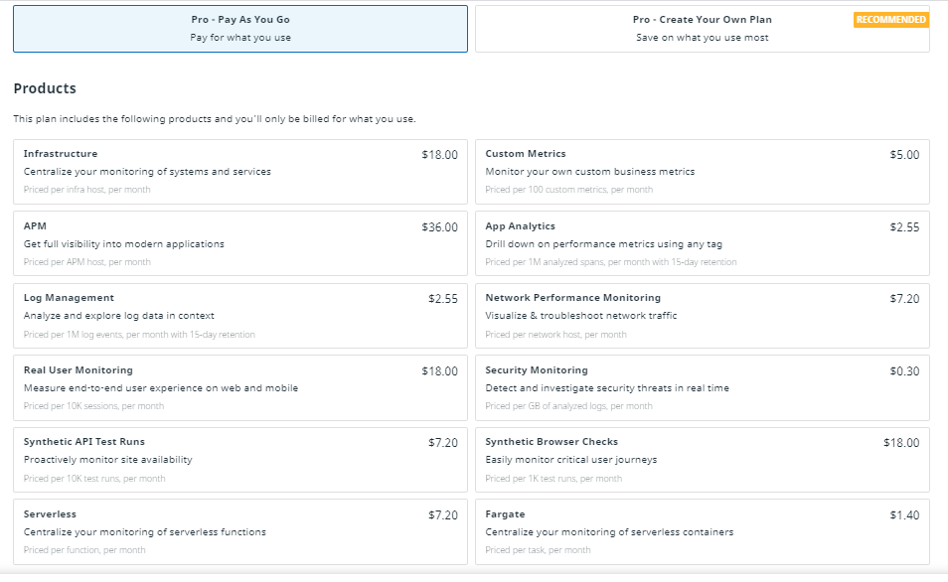
Pricing

Pricing
Datadog terminology
- Agent
- DogStatsD
- StatsD
- metrics
Datadog Agent
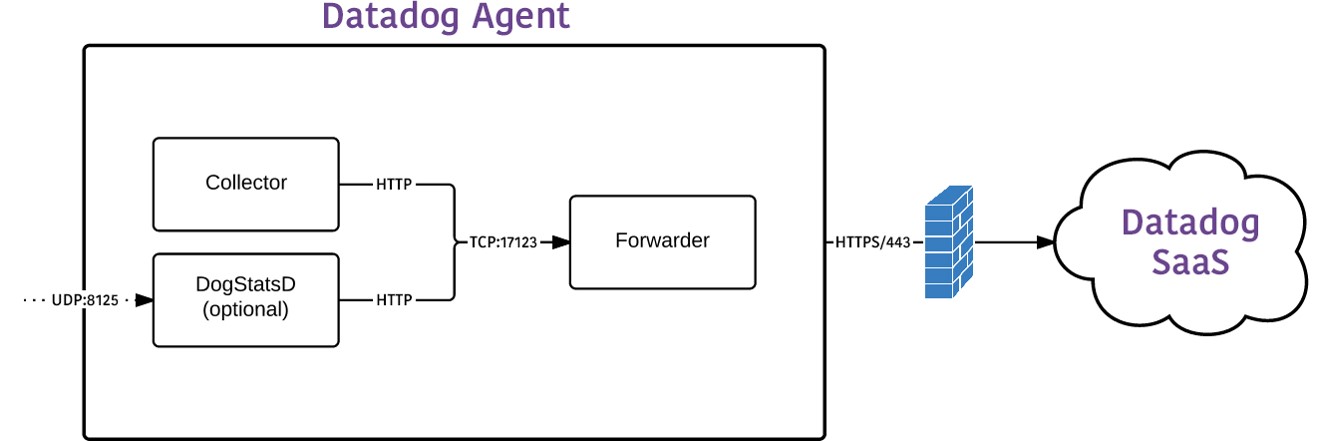
The Agent is lightweight software installed on your hosts. It reports metrics and events from your host to Datadog via….
- Integrations, https://docs.datadoghq.com/integrations
- DogStatsD, or
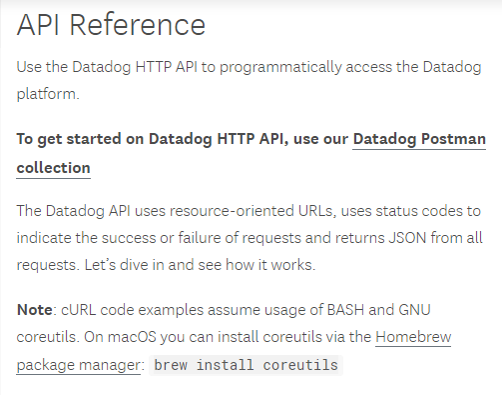
- The API. https://docs.datadoghq.com/api/
# With additional setup, the Agent can report live processes, logs, and traces.
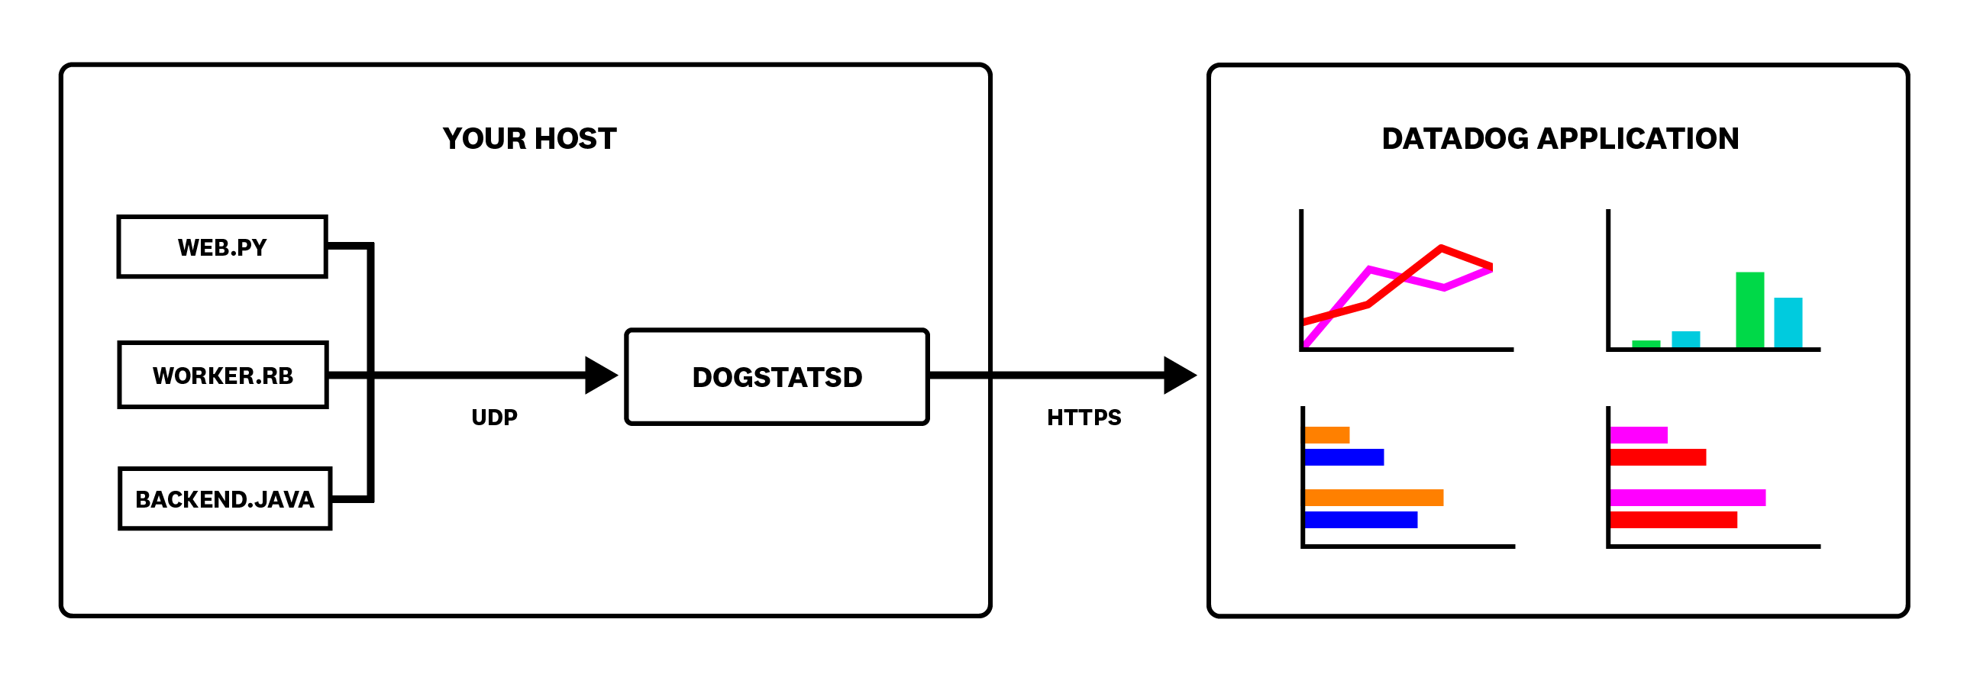
How Datadog agent works?
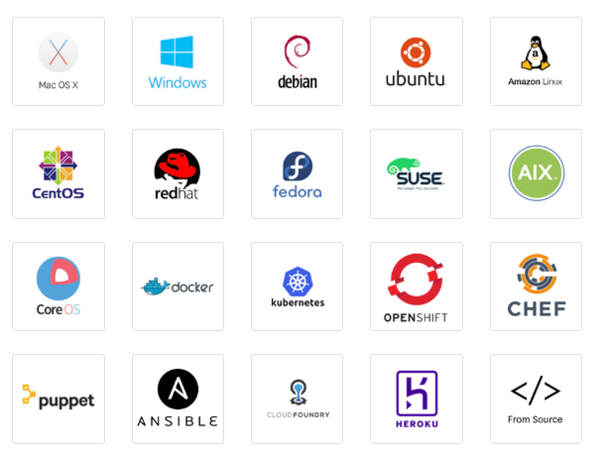
Datadog Agent: Platforms
StatsD
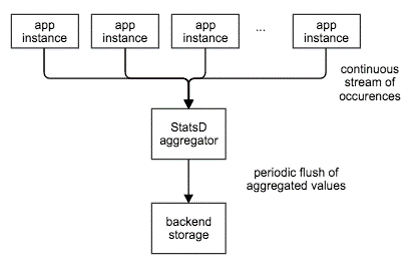
- StatsD is originally a simple daemon developed and released by Etsy to aggregate and summarize application metrics.
- With StatsD, applications are to be instrumented by developers using language-specific client libraries. These libraries will then communicate with the StatsD daemon using its dead-simple protocol, and the daemon will then generate aggregate metrics and relay them to virtually any graphing or monitoring backend.
How does StatsD work?
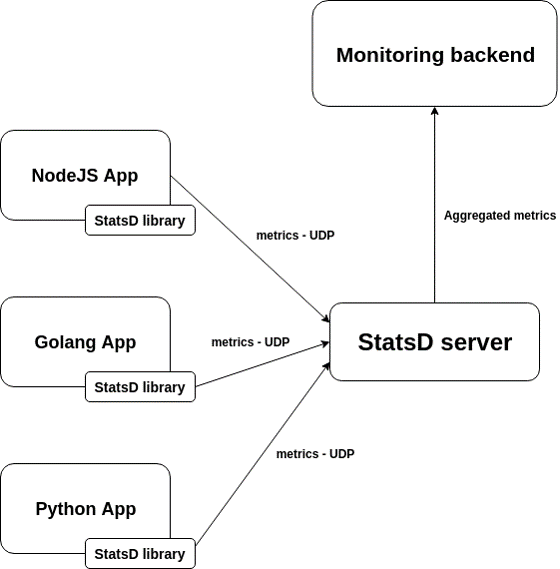
- It all starts in your own application code. You—the developer—instrument it with one of the many StatsD libraries corresponding to your app language. StatsD allows you to capture different types of metrics depending on your needs: today those are Gauges, Counters, Timing Summary Statistics, and Sets.
- The StatsD client library then sends each individual call to the StatsD server over a UDP datagram. Since UDP is a disconnected protocol in which the recipient of a datagram doesn’t send any acknowledgement to the sender, the library doesn’t need to block when submitting data as it would with TCP or HTTP-based protocols.
- The StatsD daemon will then listen to the UDP traffic from all application libraries, aggregate data over time and “flush” it at the desired interval to the backend of your choice. For example, individual function call timings may be aggregated every 10 seconds into a set of summary metrics describing its minimum, maximum, median, 90th and 95th percentile over the 10s interval. The protocol used between the StatsD Daemon and the backend will vary depending on the backend used (most are HTTP-based).
- The monitoring backend will turn your metrics from a stream of numbers on the wire into usable charts and alert you when needed. Examples of backends include tools like Graphite as well as yours truly.
How does StatsD work?
How does StatsD work?
How does
StatsD work?
StatsD & Datadog
- Datadog is big fans of StatsD and use it extensively internally. Customers to submit metrics from StatsD into Datadog for graphing, alerting, event correlation, and team collaboration: Datadog embedded our own StatsD daemon within the Datadog Agent, to make the setup as simple as possible
- Datadog extended the StatsD protocol to support tagging, one of Datadog’s killer features. This lets you add additional dimensions to your metrics, such as the application version, or type of customer a specific call relates to. But, we’ll come back to this in another post.
- Datadog made it very easy to discover StatsD metrics in the Datadog UI. Every host will automatically advertise its metrics, so you don’t have to look for them.
Datadog Agent: DogStatsD
- While StatsD accepts only metrics, DogStatsD accepts all three of the major Datadog data types: metrics, events, and service checks.

Datadog Agent: DogStatsD
In v6, DogStatsD is a Golang implementation of Etsy’s StatsD metric aggregation daemon. It is used to receive and roll up arbitrary metrics over UDP or Unix socket, thus allowing custom code to be instrumented without adding latency
How does DogStatsD work?
- DogStatsD accepts custom metrics, events, and service checks over UDP and periodically aggregates and forwards them to Datadog.
- Because it uses UDP, your application can send metrics to DogStatsD and resume its work without waiting for a response. If DogStatsD ever becomes unavailable, your application won’t experience an interruption.
- As it receives data, DogStatsD aggregates multiple data points for each unique metric into a single data point over a period of time called the flush interval (ten seconds, by default).
How does DogStatsD work?
Datadog vs StatsD: What are the differences?
The easiest way to get your custom application metrics into Datadog is to send them to DogStatsD, a metrics aggregation service bundled with the Datadog Agent. DogStatsD implements the StatsD protocol and adds a few Datadog-specific extensions:
- Histogram metric type
- Service checks
- Events
- Tagging
Any compliant StatsD client works with DogStatsD and the Agent, but you won’t be able to use the Datadog-specific extensions.
Datadog Agent: DogStatsD
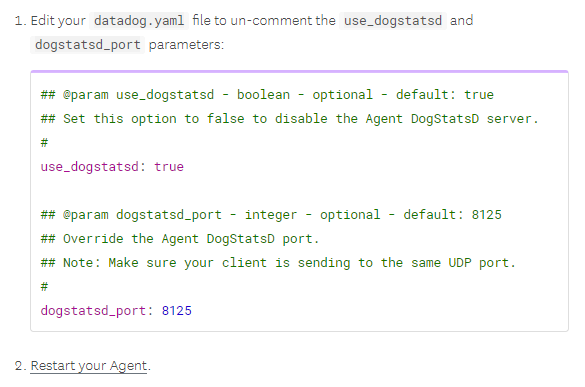
DogStatsD is enabled by default over UDP port 8125 for Agent v6+. By default, DogStatsD listens on UDP port 8125. You can also configure DogStatsD to use a Unix domain socket. To enable a custom Agent DogStatsD server UDP port:
Datadog Agent: The Collector
The collector gathers all standard metrics every 15 seconds. Agent v6 embeds a Python 2.7 interpreter to run integrations and custom checks.
Datadog Agent: The Forwarder
The Agent forwarder send metrics over HTTPS to Datadog. Buffering prevents network splits from affecting metric reporting.
Metrics are buffered in memory until a limit in size or number of outstanding send requests are reached.
Afterwards, the oldest metrics are discarded to keep the forwarder’s memory footprint manageable. Logs are sent over an SSL-encrypted TCP connection to Datadog.
Agent v5
Agent v5 is composed of four major components, each written in Python running as a separate process:
- Collector (agent.py): The collector runs checks on the current machine for configured integrations, and captures system metrics, such as memory and CPU.
- DogStatsD (dogstatsd.py): This is a StatsD-compatible backend server that you can send custom metrics to from your applications.
- Forwarder (ddagent.py): The forwarder retrieves data from both DogStatsD and the collector, queues it up, and then sends it to Datadog.
- SupervisorD: This is all controlled by a single supervisor process. It is kept separate to limit the overhead of each application if you aren’t running all parts. However, it is generally recommended to run all parts.
Agent v6 & v7
Agent v6 and v7 are composed of a main process responsible for collecting infrastructure metrics, logs, and receiving DogStatsD metrics. The main components to this process are:
- The Collector is in charge of running checks and collecting metrics.
- The Forwarder sends payloads to Datadog.
Agent v6 & v7
Two optional processes are spawned by the Agent if enabled in the datadog.yaml configuration file:
- The APM Agent is a process to collect traces (enabled by default).
- The Process Agent is a process to collect live process information. By default, it only collects available containers, otherwise it is disabled.
Datadog Agent: Agent GUI
You can configure the port on which the GUI runs in the datadog.yaml file. To disable the GUI, set the port’s value to -1. For Windows and macOS, the GUI is enabled by default and runs on port 5002. For Linux, the GUI is disabled by default.
When the Agent is running, use the datadog-agent launch-gui command to open the GUI in your default web browser.
Datadog Agent: Agent GUI: Requirements
- Cookies must be enabled in your browser. The GUI generates and saves a token in your browser which is used for authenticating all communications with the GUI server.
- To start the GUI, the user must have the required permissions. If you are able to open datadog.yaml, you are able to use the GUI.
- For security reasons, the GUI can only be accessed from the local network interface (localhost/127.0.0.1), therefore you must be on the same host that the Agent is running. That is, you can’t run the Agent on a VM or a container and access it from the host machine.
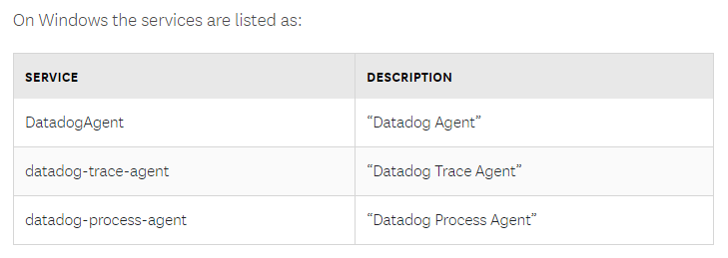
Datadog Agent services in Windows
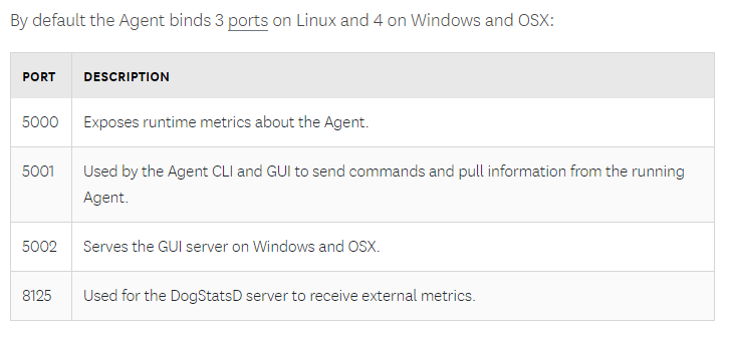
Datadog Agent Ports in Windows and OSX
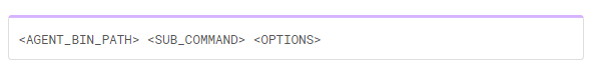
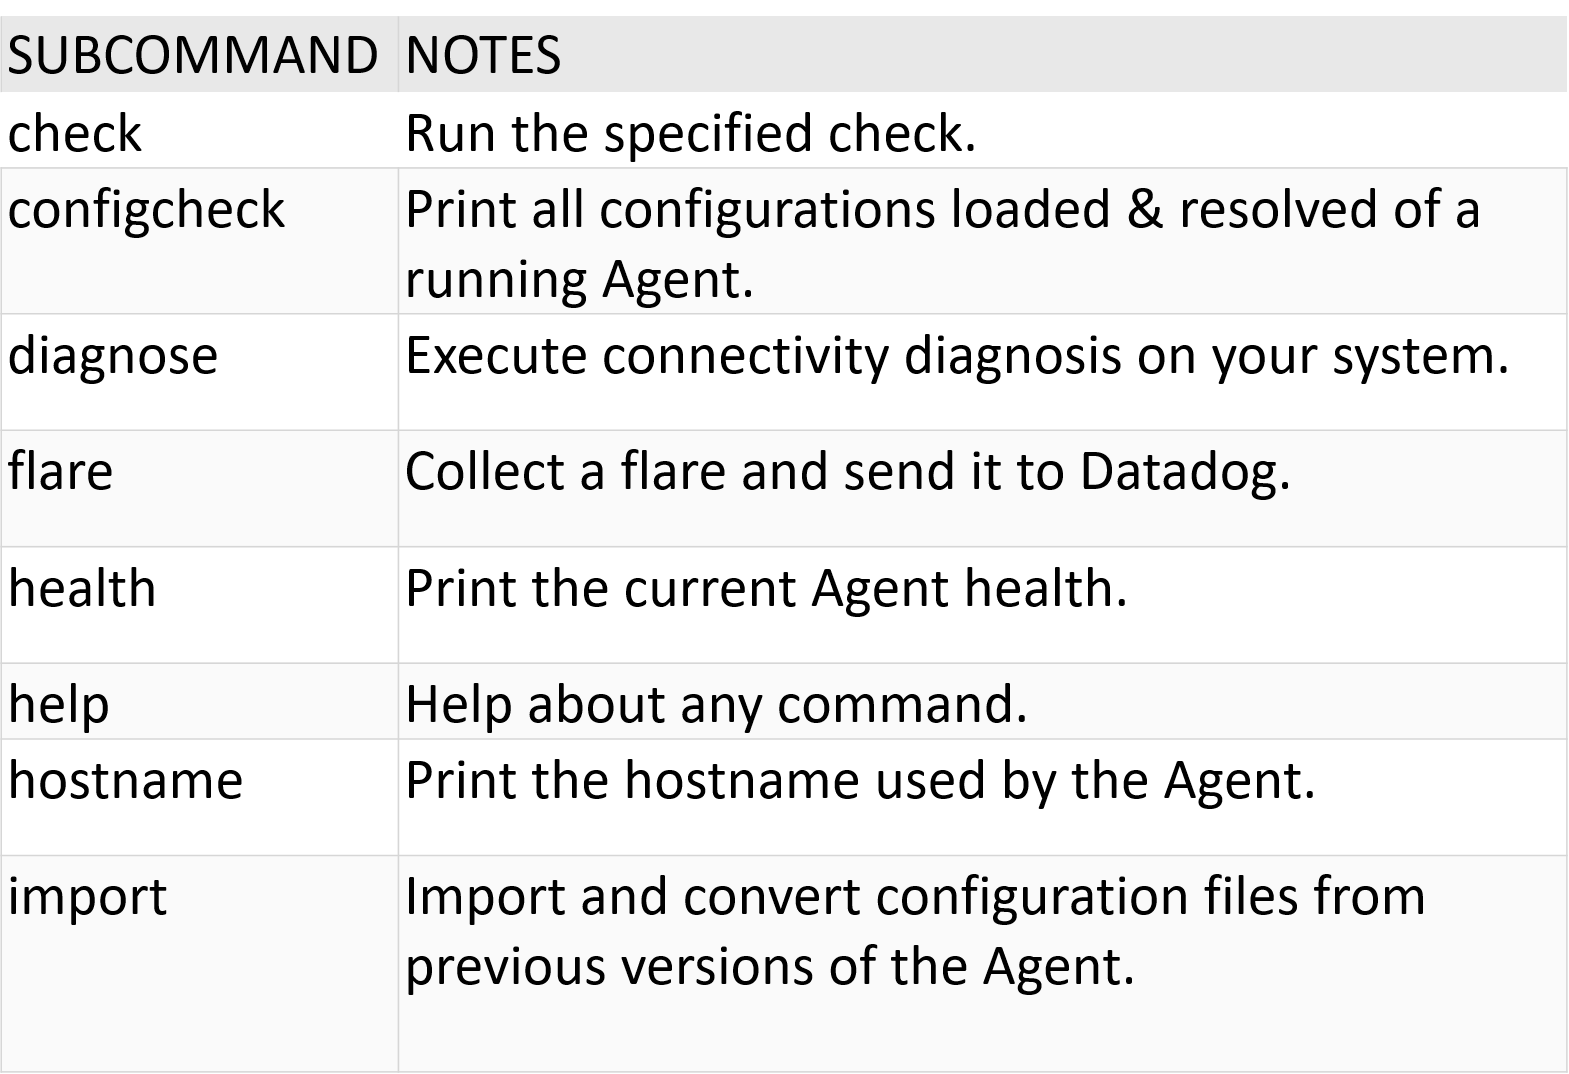
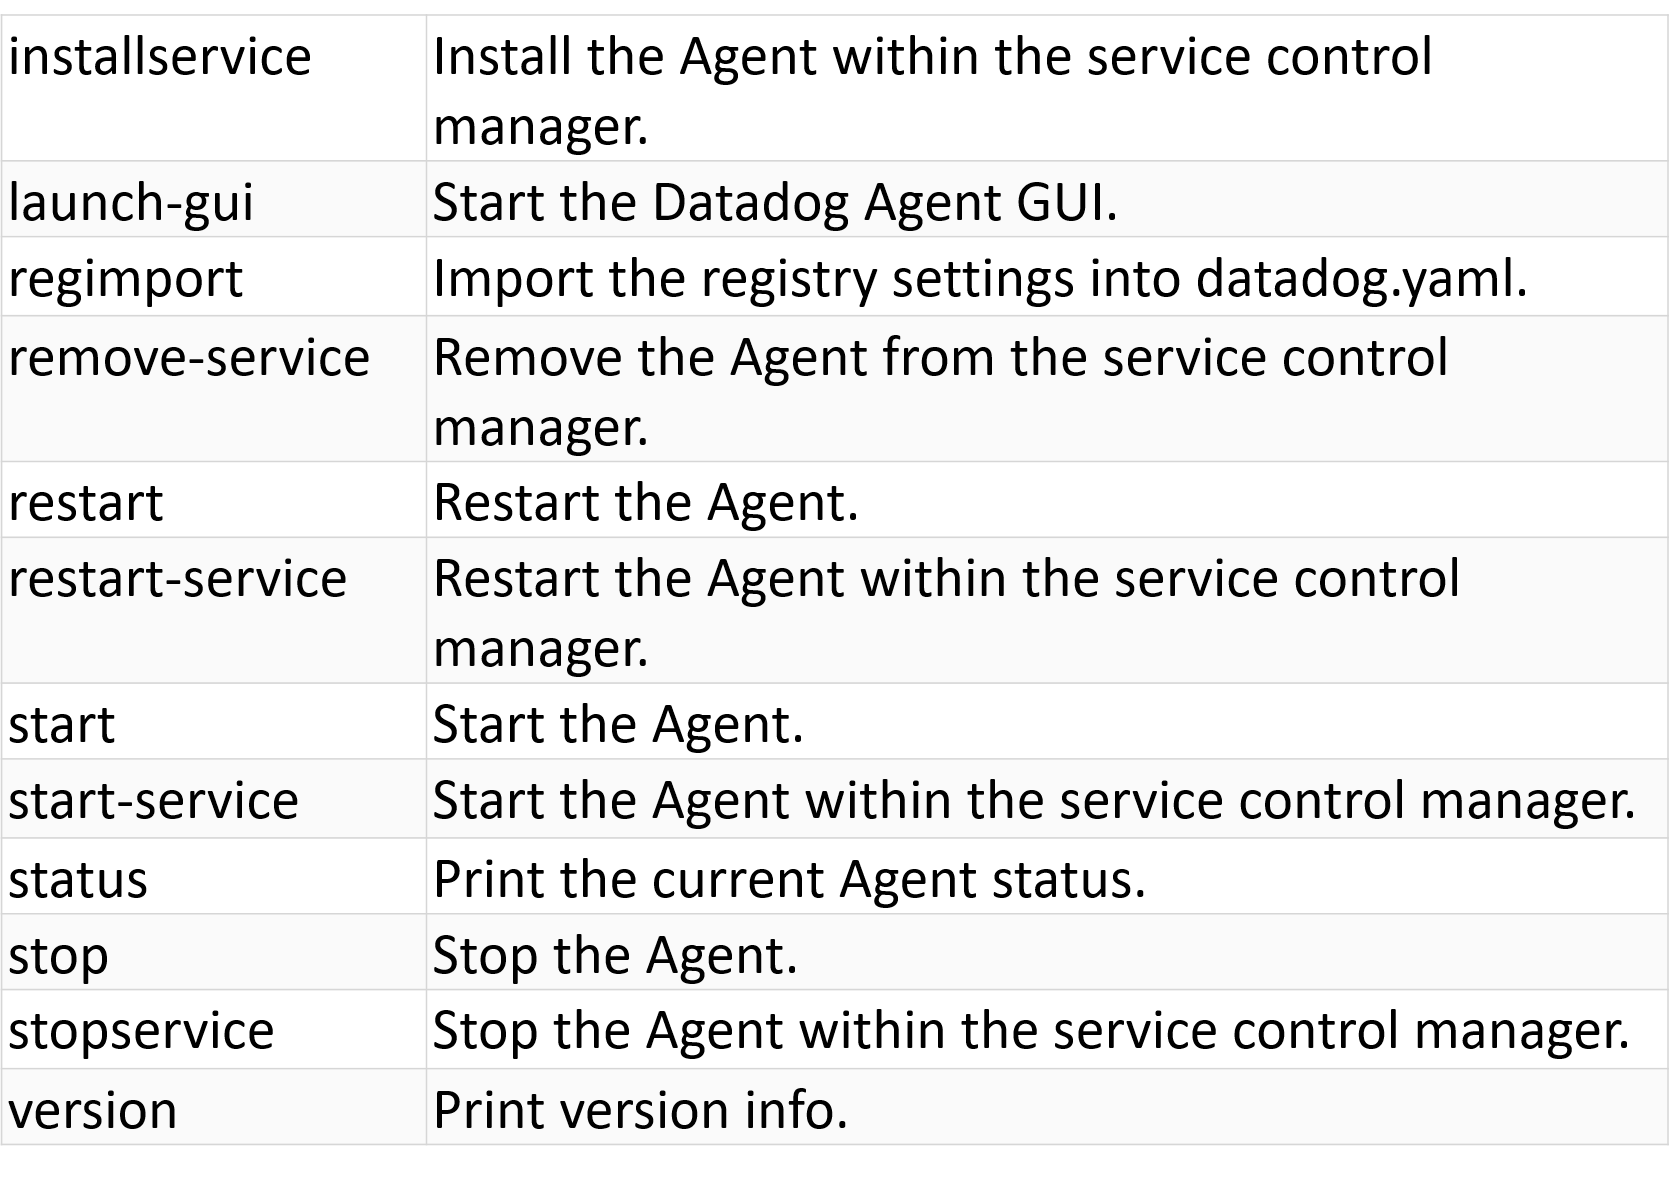
Datadog Agent: CLI
With Agent v6+, the command line interface is based on subcommands. To run a subcommand, first invoke the Agent binary:
Datadog Agent:
CLI
Datadog Agent:
CLI
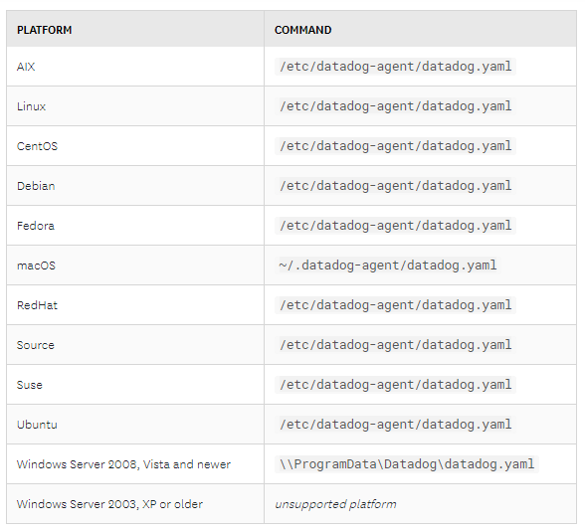
Datadog Agent: datadog.yaml
Agent Configuration Files
- The Agent v6 configuration file uses YAML to better support complex configurations, and to provide a consistent configuration experience, as Checks also use YAML configuration files.
https://github.com/DataDog/datadog-agent/blob/master/pkg/config/config_template.yaml
Datadog Agent: datadog.yaml
Agent Configuration Files
Datadog Agent:
Agent configuration directory
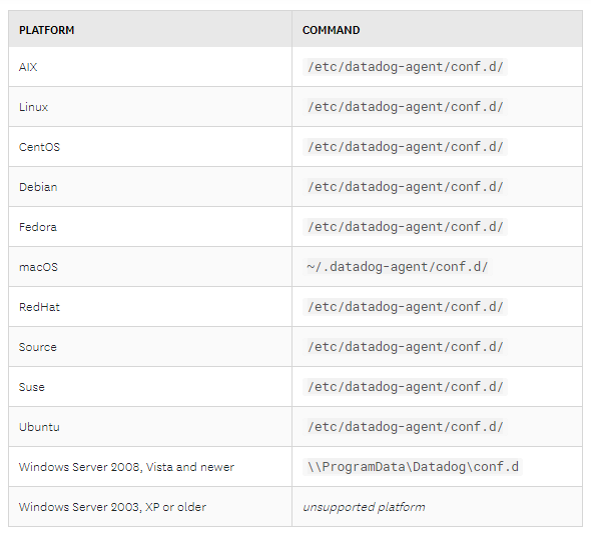
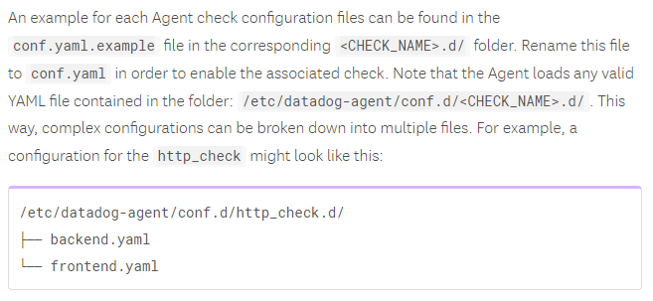
How to Enabled Datadog Agent check configuration files?
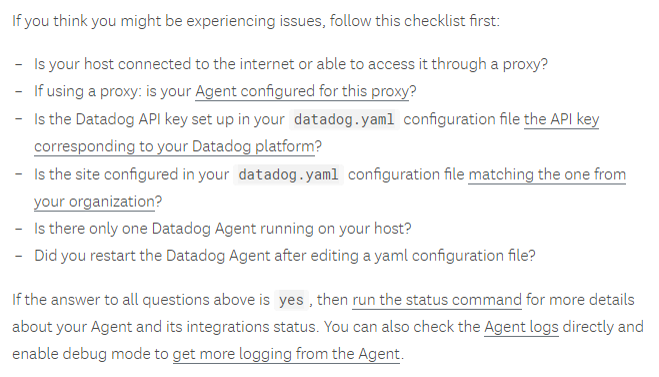
Datadog Agent: Troubleshooting
Datadog Agent: Start the Agent
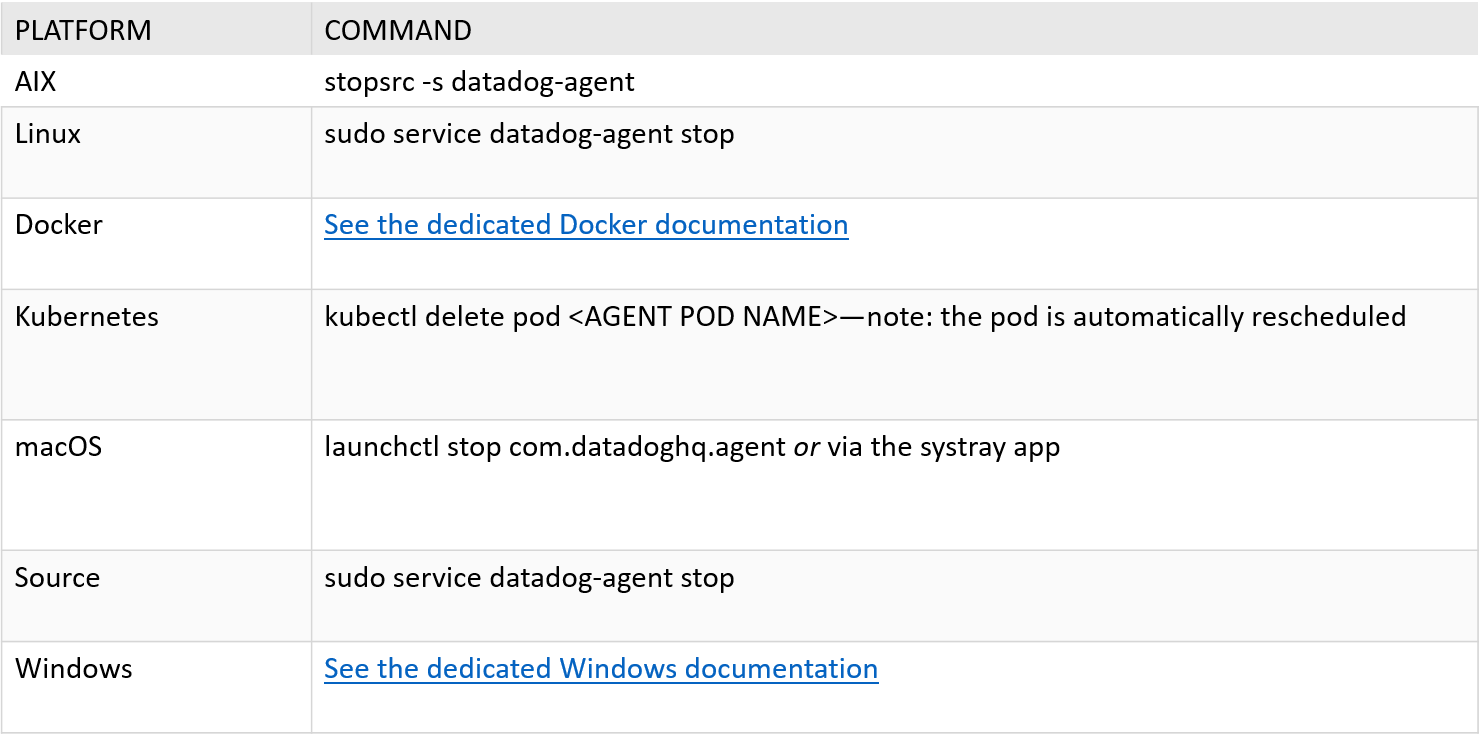
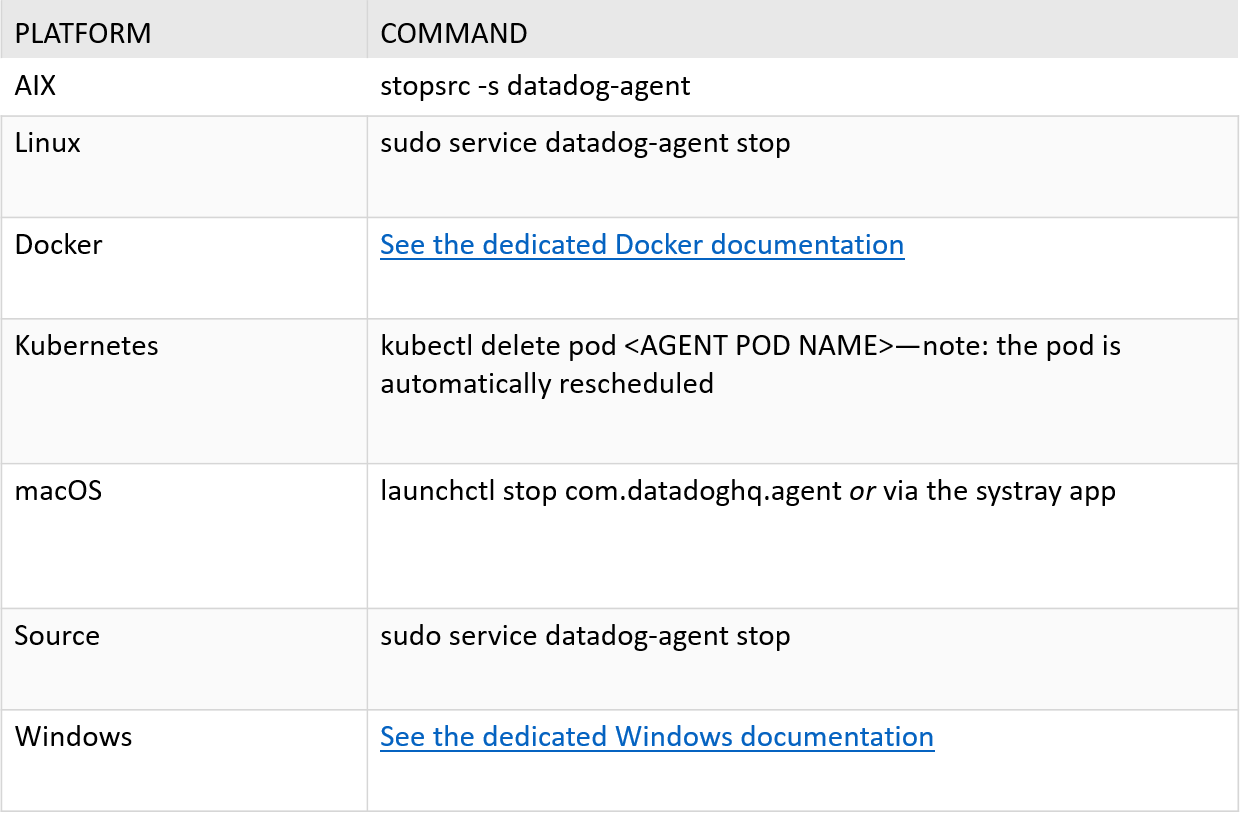
Datadog Agent: Stop the Agent
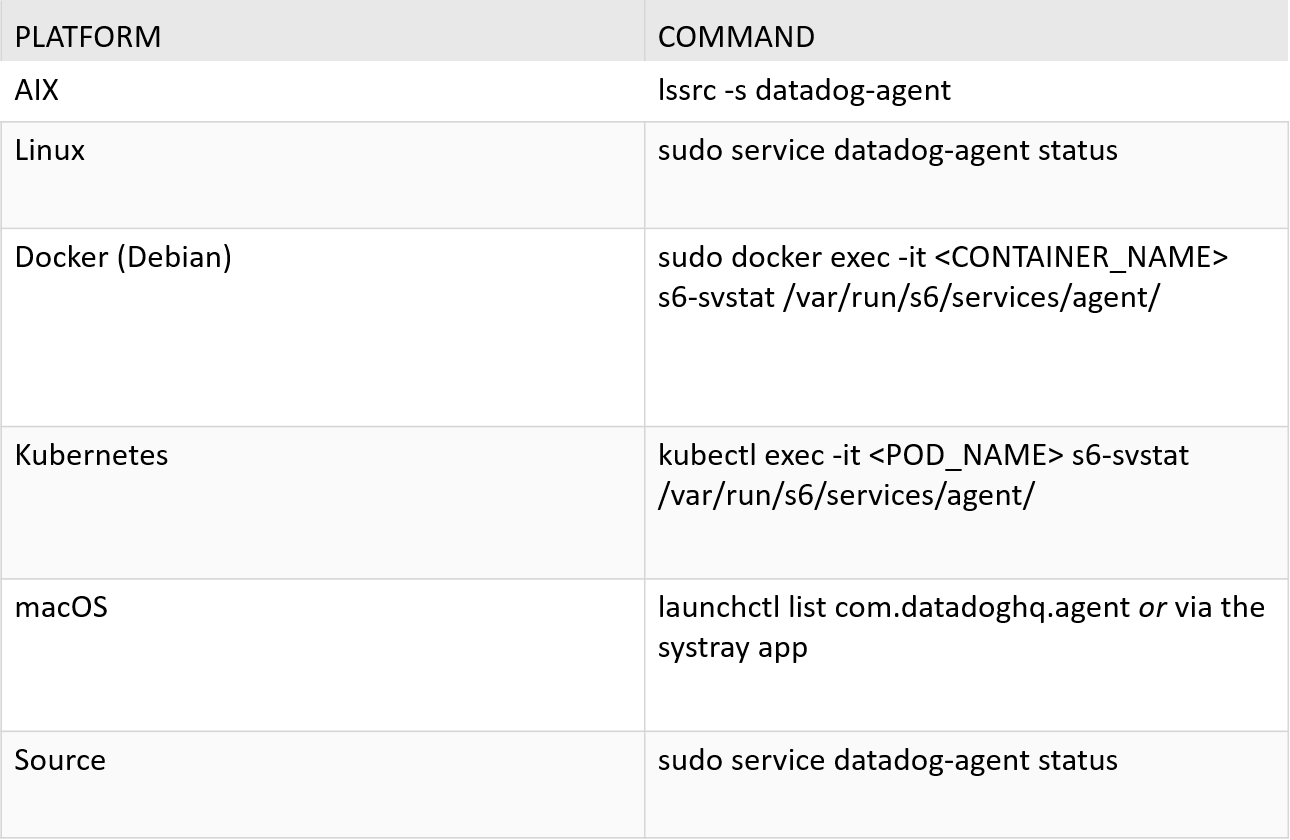
Datadog Agent: Service Status
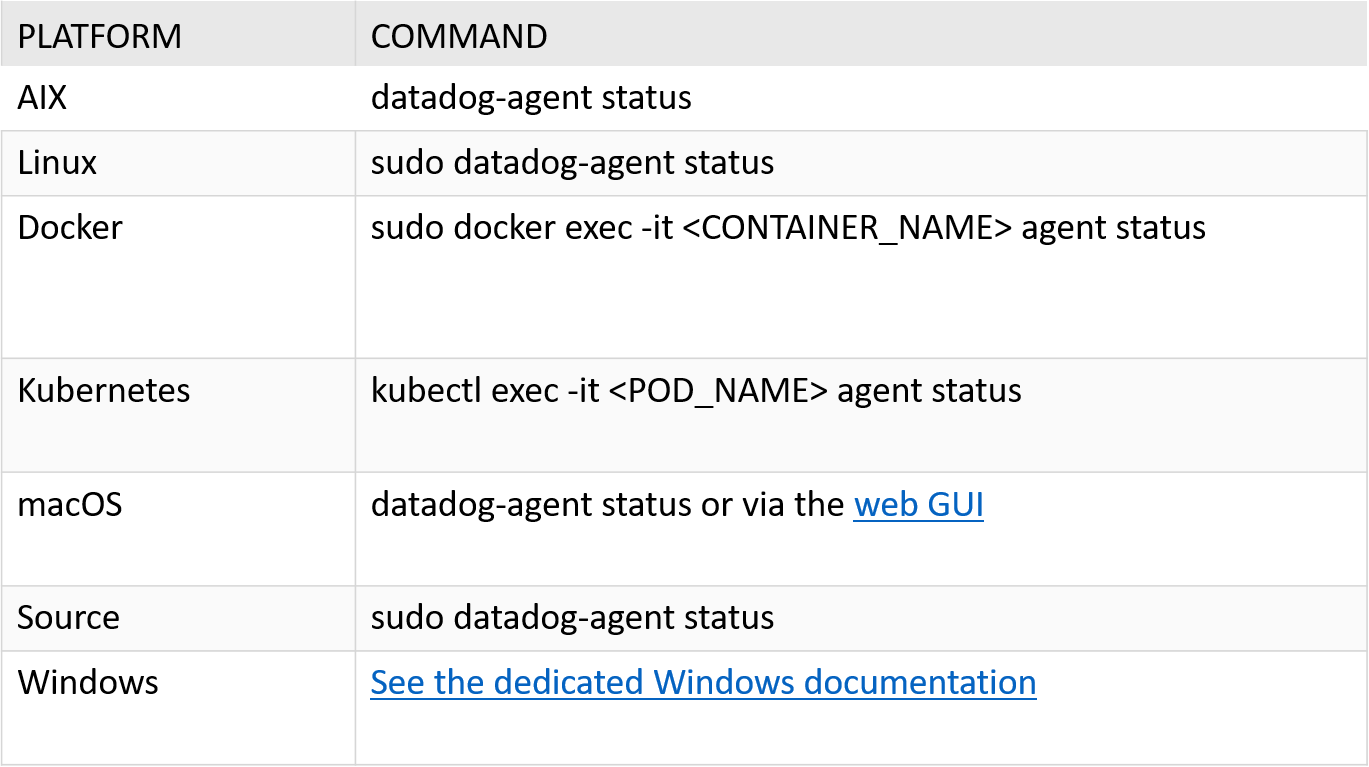
Datadog Agent: Agent Status

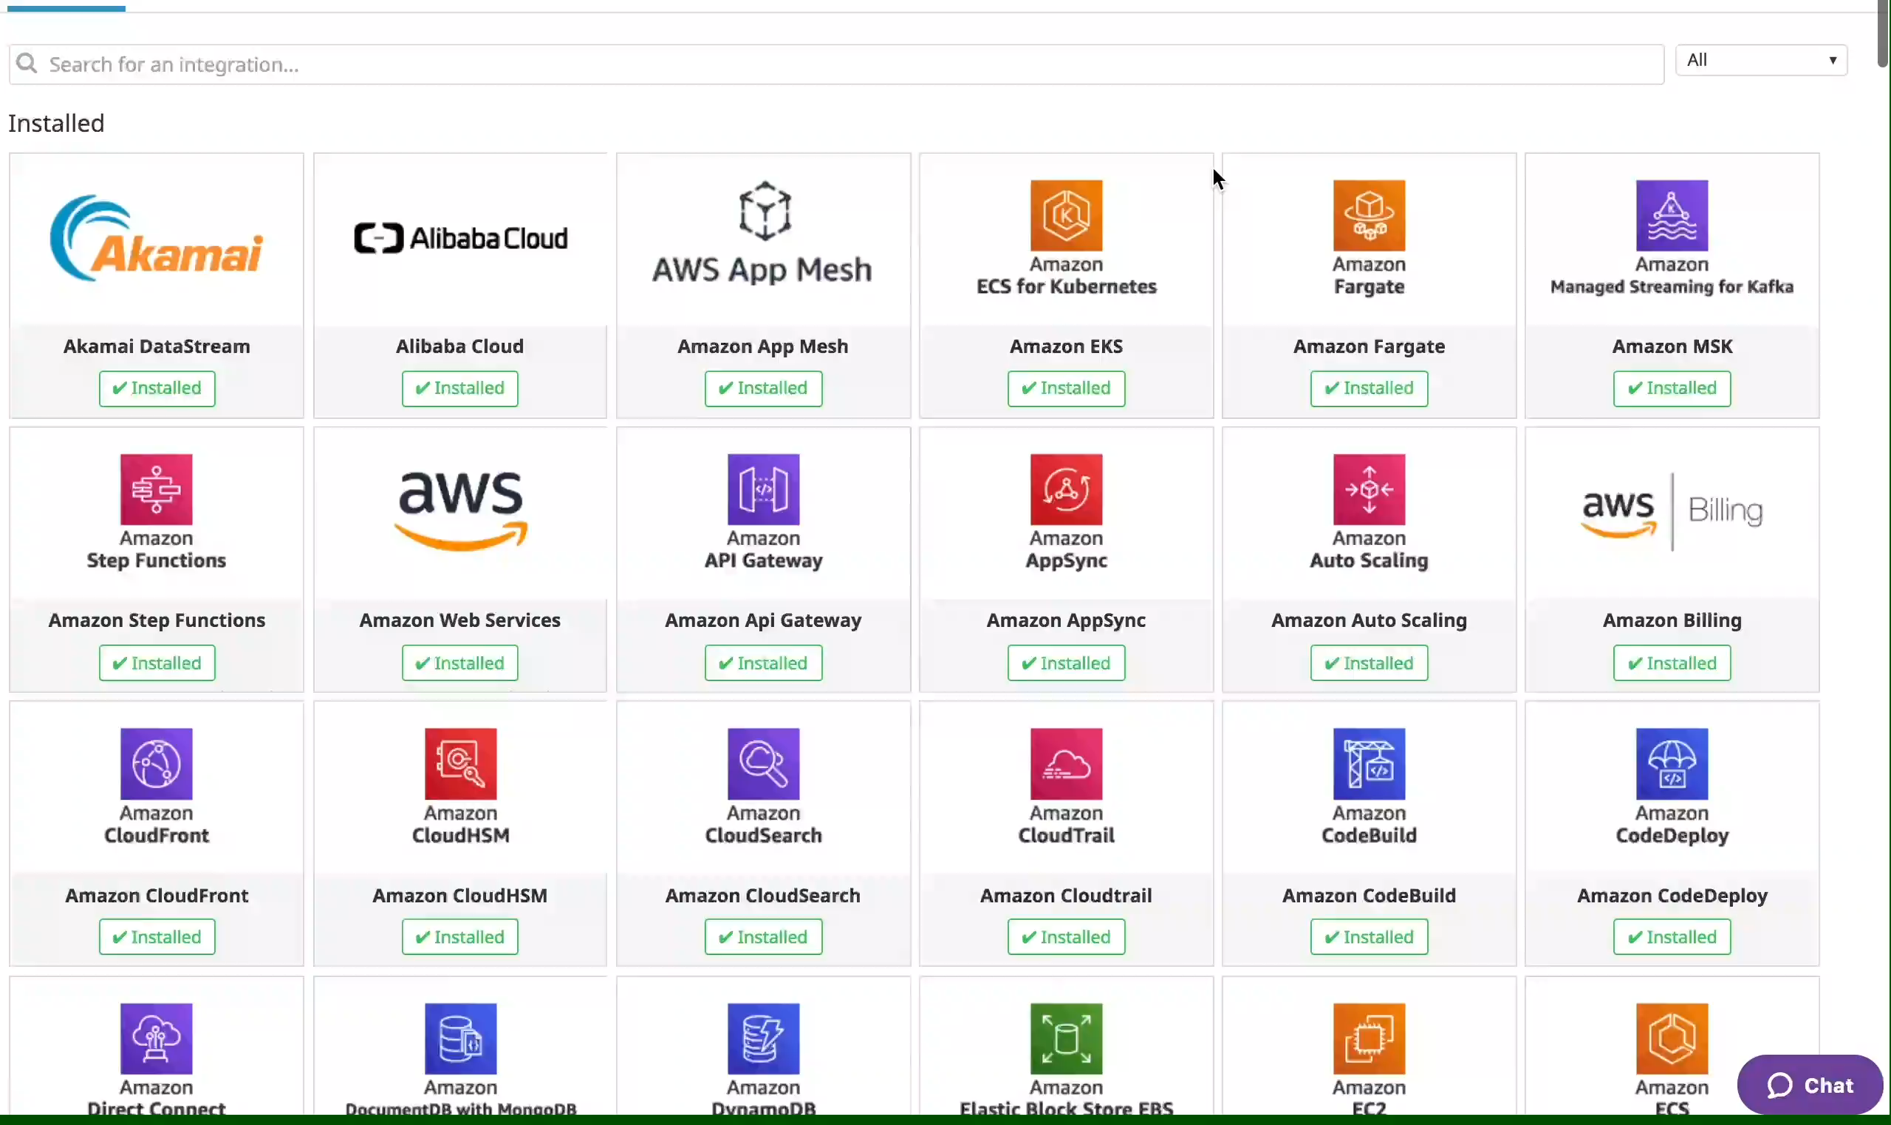
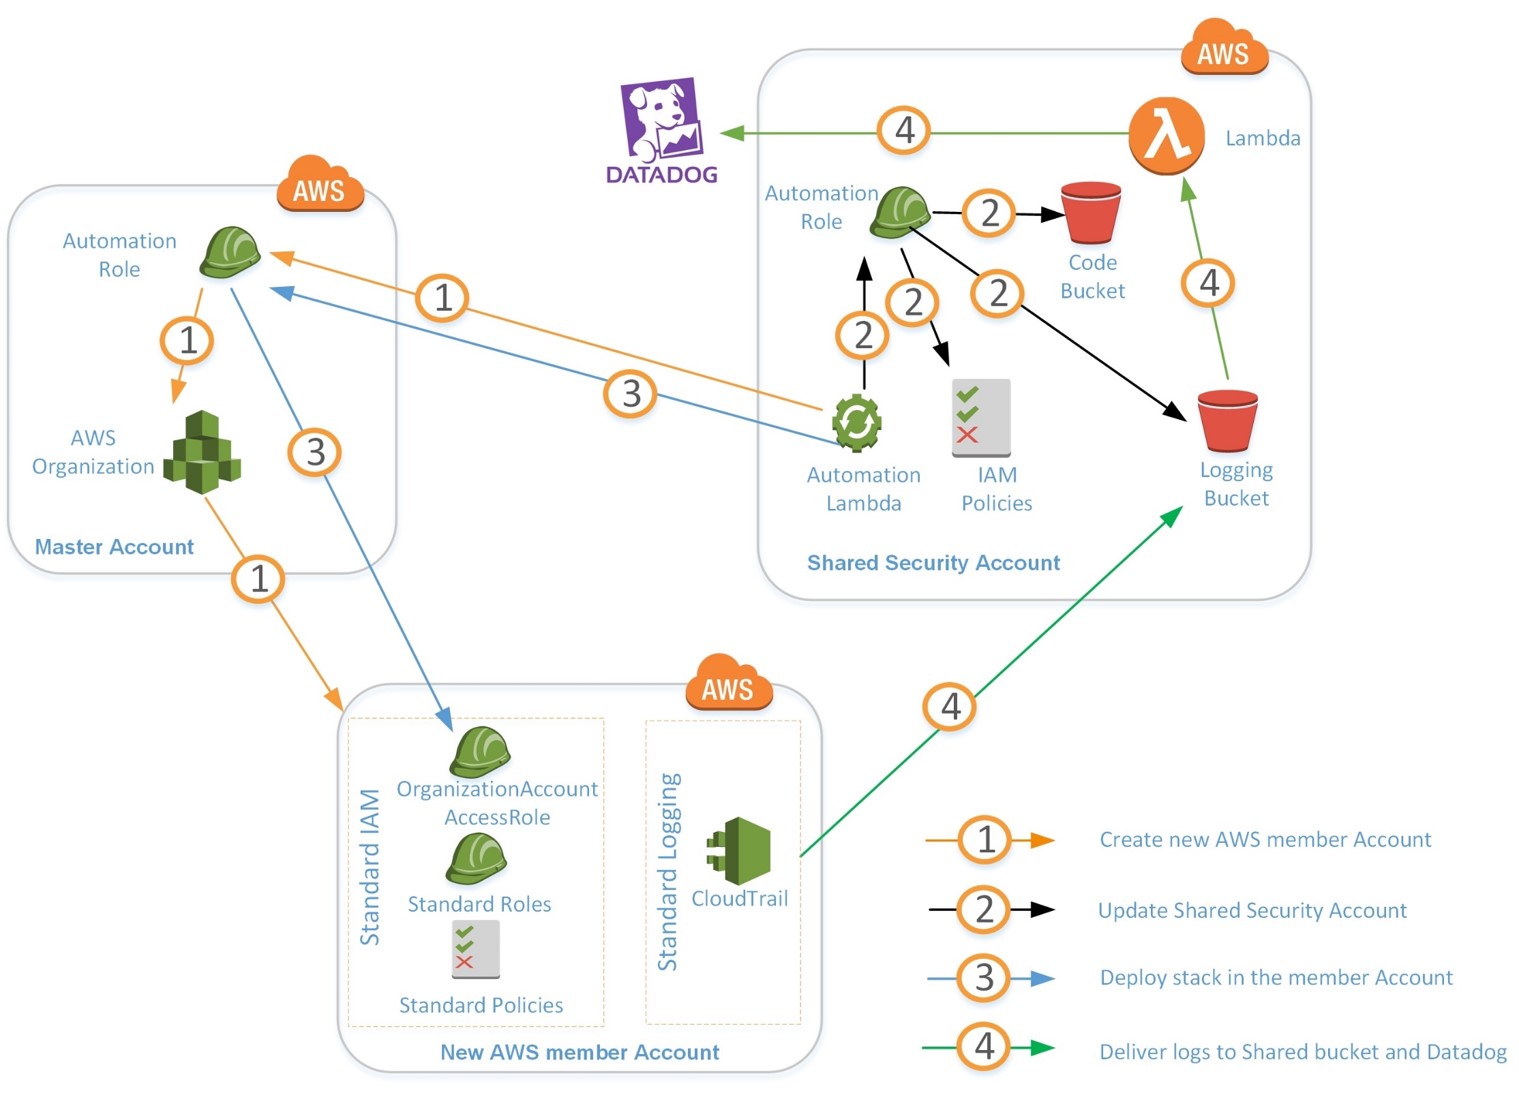
Datadog
with AWS
DevOpsSchool Community Networks
These platforms provide you the opportunity to connect with peers and industry DevOps leaders, where you can share, discuss or get information on latest topics or happenings in DevOps culture and grow your DevOps professionals network.
 |
|---|
| DevOps |
| Build & Release |
 |
|---|
| DevOps |
| Build & Release |
 |
|---|
| DevOpsSchool |
| DevOps Group |
 |
|---|
| BestDevOps.com |

Any Questions?

Thank You!
DevOpsSchool — Lets Learn, Share & Practice DevOps
Connect with us on
contact@devopsschool.com | +91 700 483 5930Next up:

Datadog Course
3. Datadog Infrastructure Monitoring Part -2