
Datadog Monitors
by DevOpsSchool.com
Rajesh Kumar
(Senior DevOps Manager & Principal Architect)

-
DevOps@RajeshKumar.xyz
www.rajeshkumar.xyz
/RajeshKumarLog
/RajeshKumarIN
/RajeshKumarIN
Rajesh Kumar — an award-winning academician and consultant trainer, with 15+ years’ experience in diverse skill management, who has more than a decade of experience in training large and diverse groups across multiple industry sectors.
Datadog Monitors AKA Alerts

Monitors
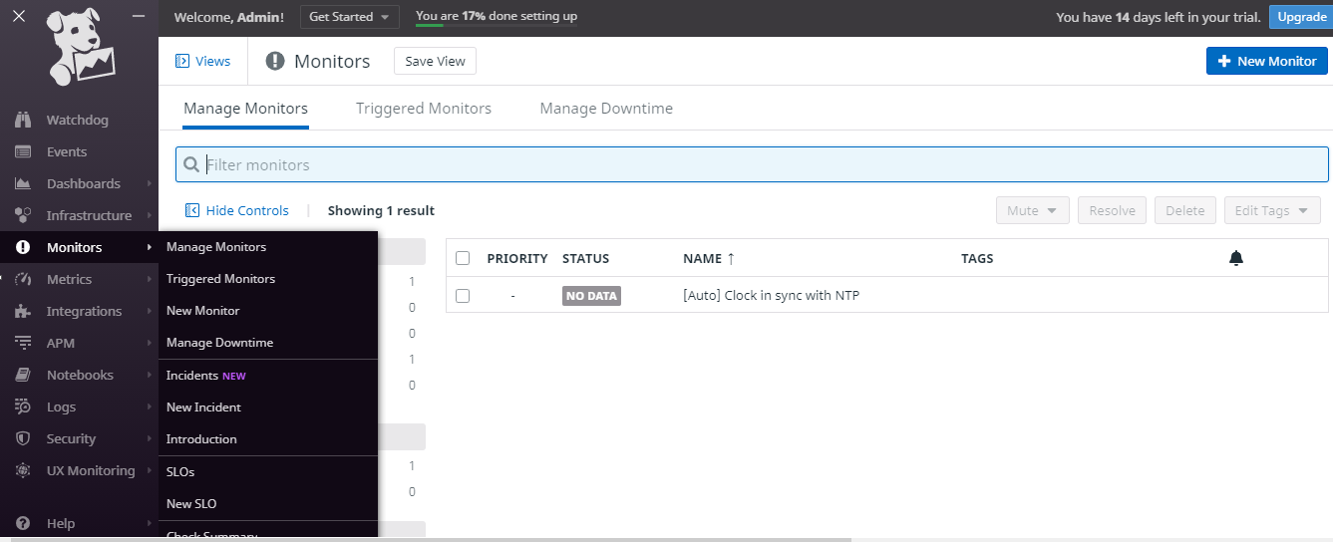
Types of Monitoring
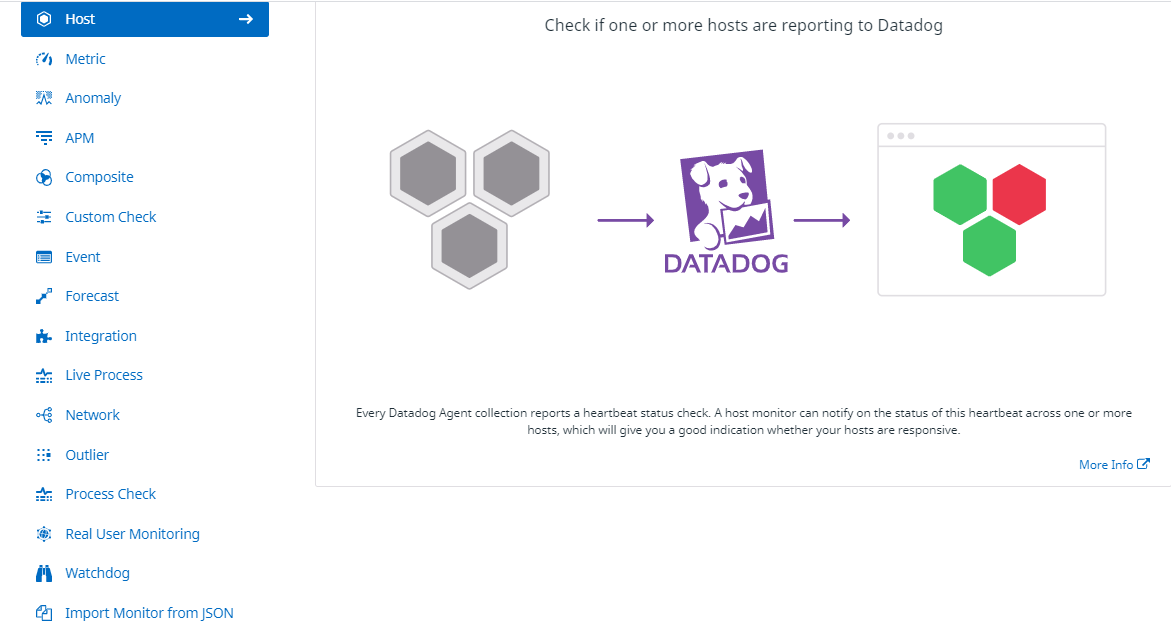
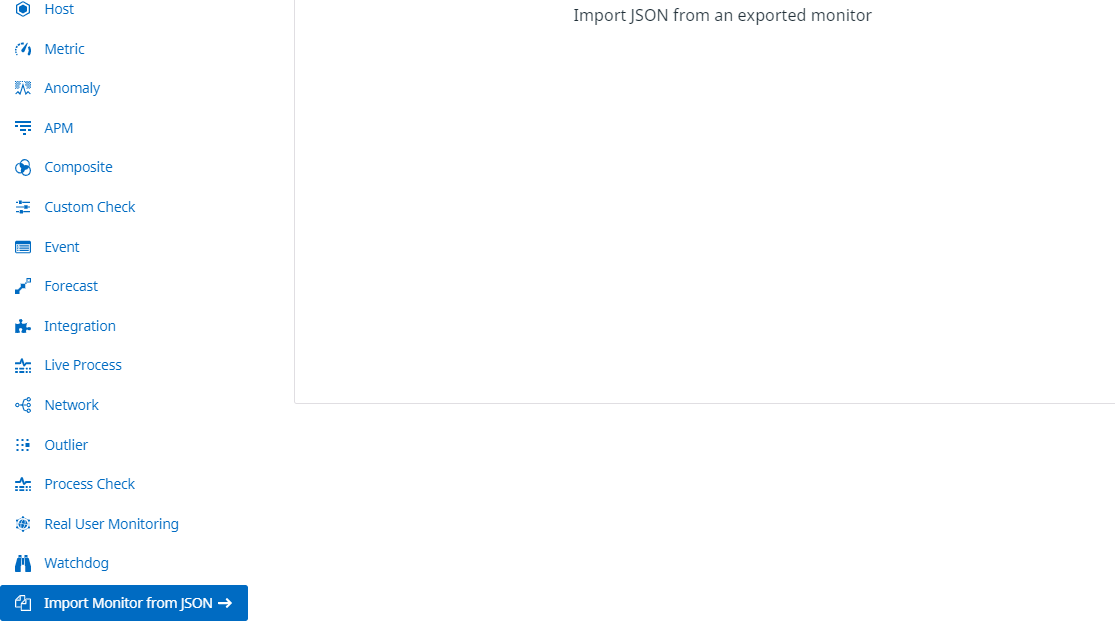
Host - Check if one or more hosts are reporting to Datadog.
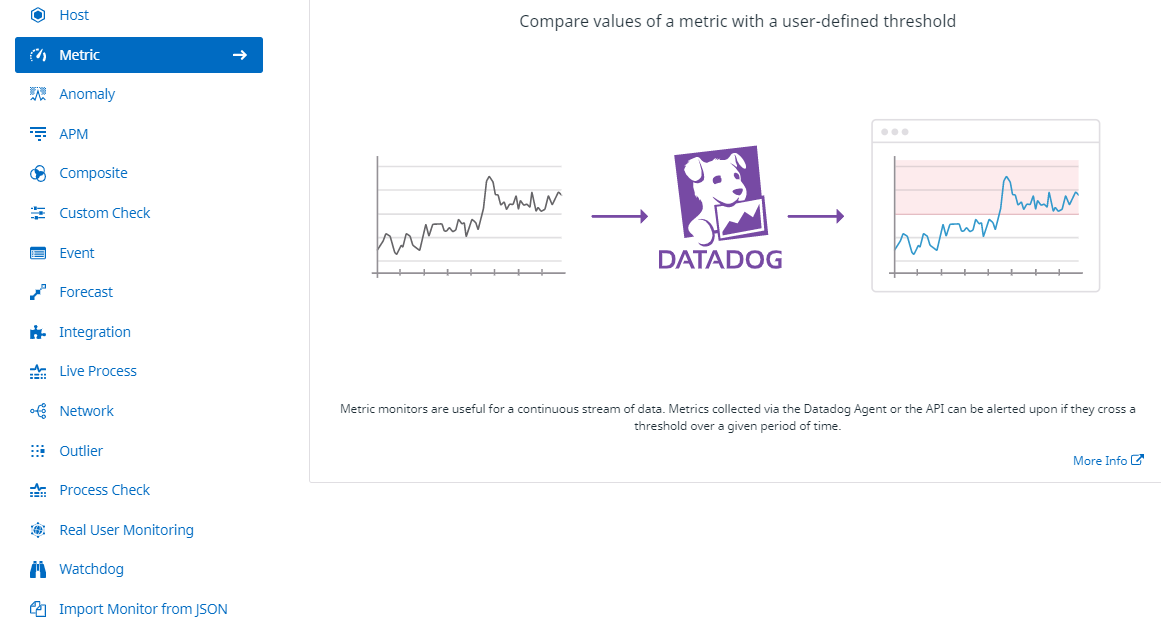
Metric - Compare values of a metric with a user-defined threshold.
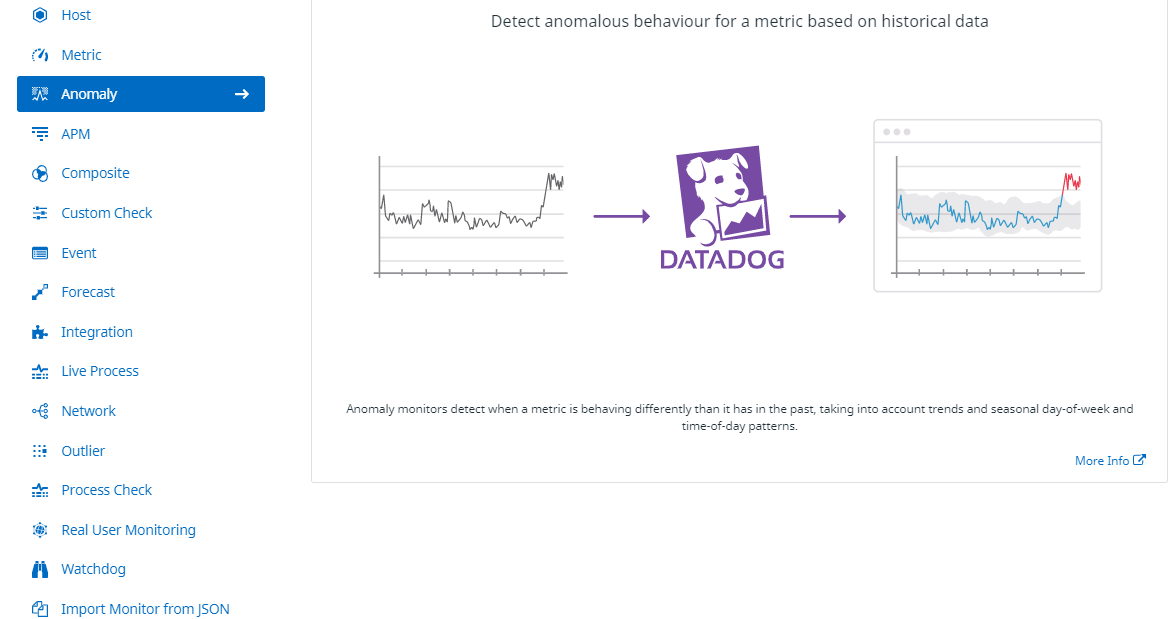
Anomaly - Detect anomalous behavior for a metric based on historical data.
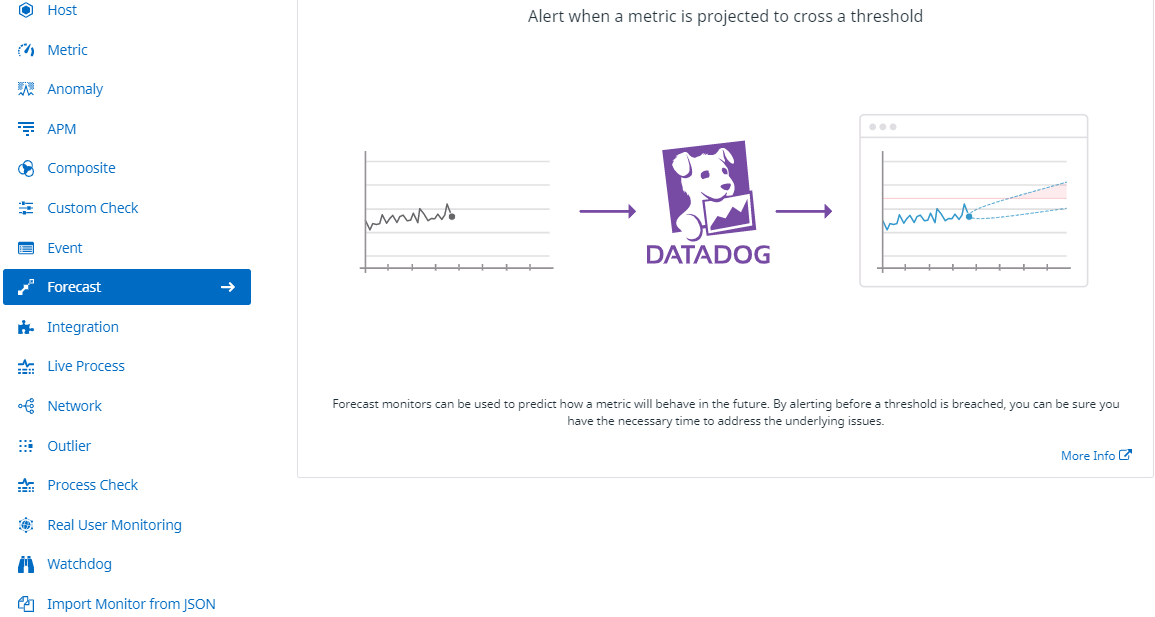
Forecast - Alert when a metric is projected to cross a threshold.
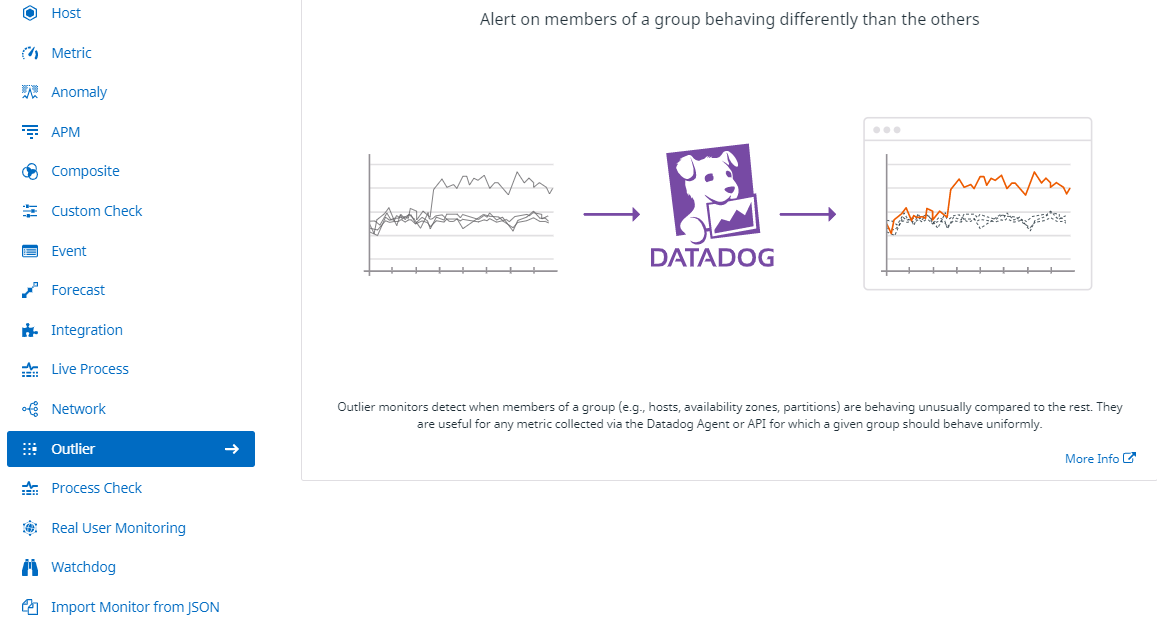
Outlier - Alert on members of a group behaving differently than the others.
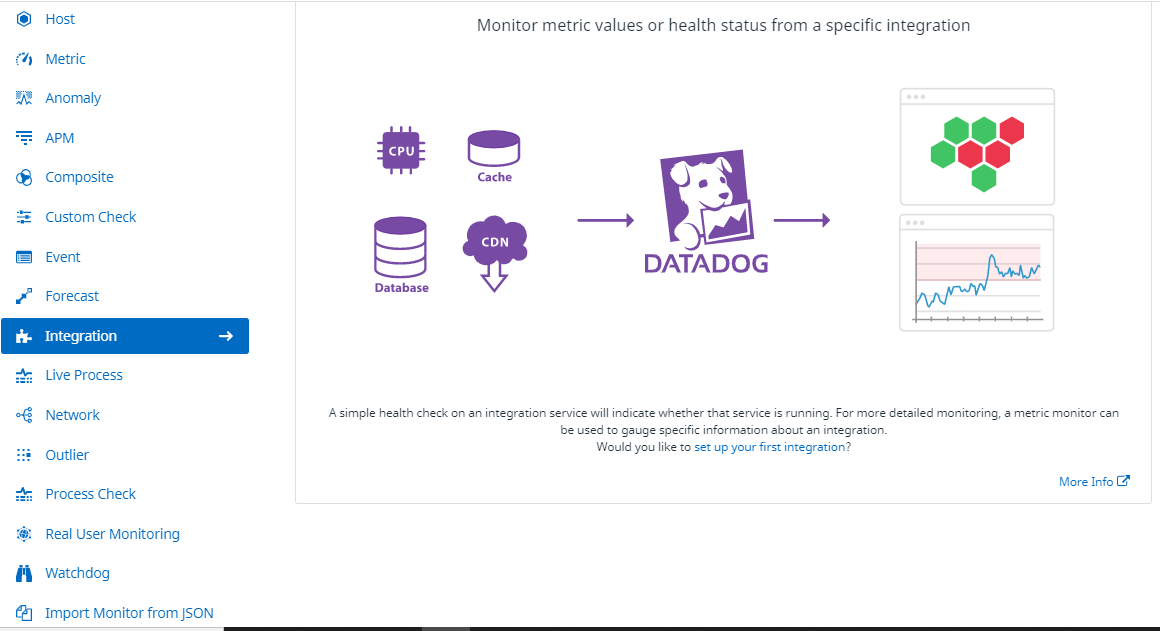
Integration - Monitor metric values or health status from a specific integration.
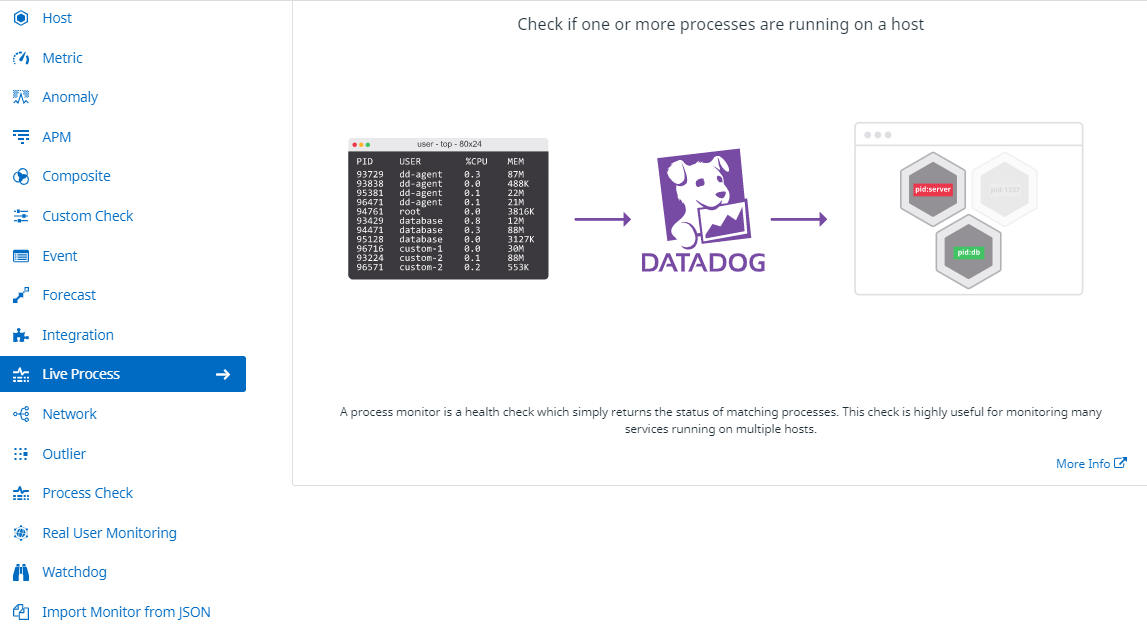
Live Process - Check if one or more processes are running on a host.
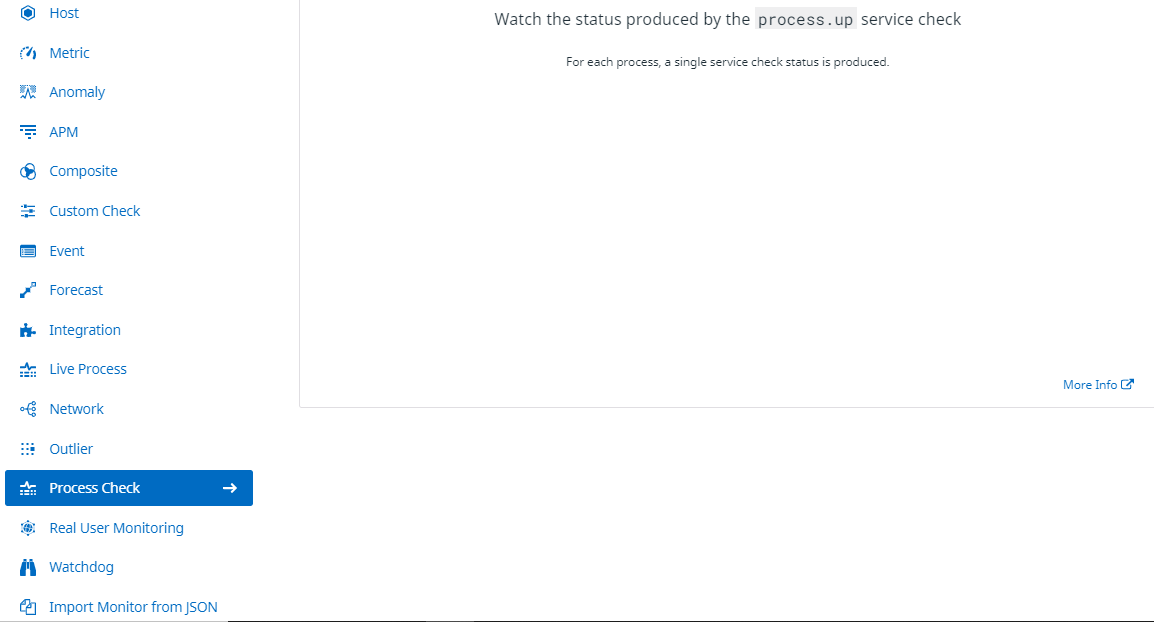
Process Check - Watch the status produced by the process.up service check.
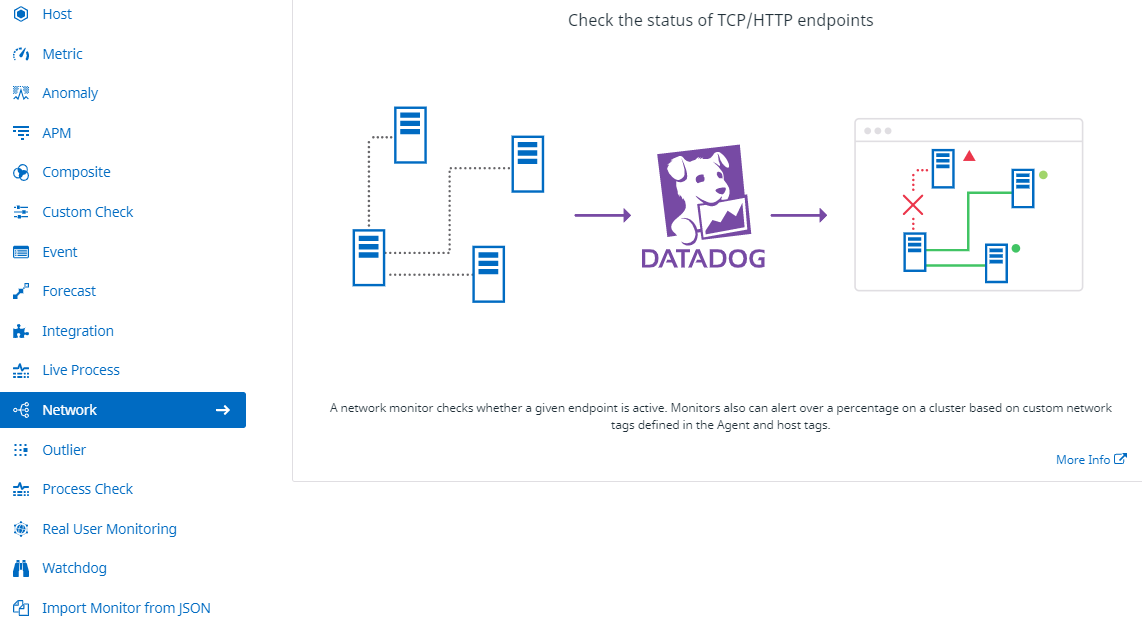
Network - Check the status of TCP/HTTP endpoints.
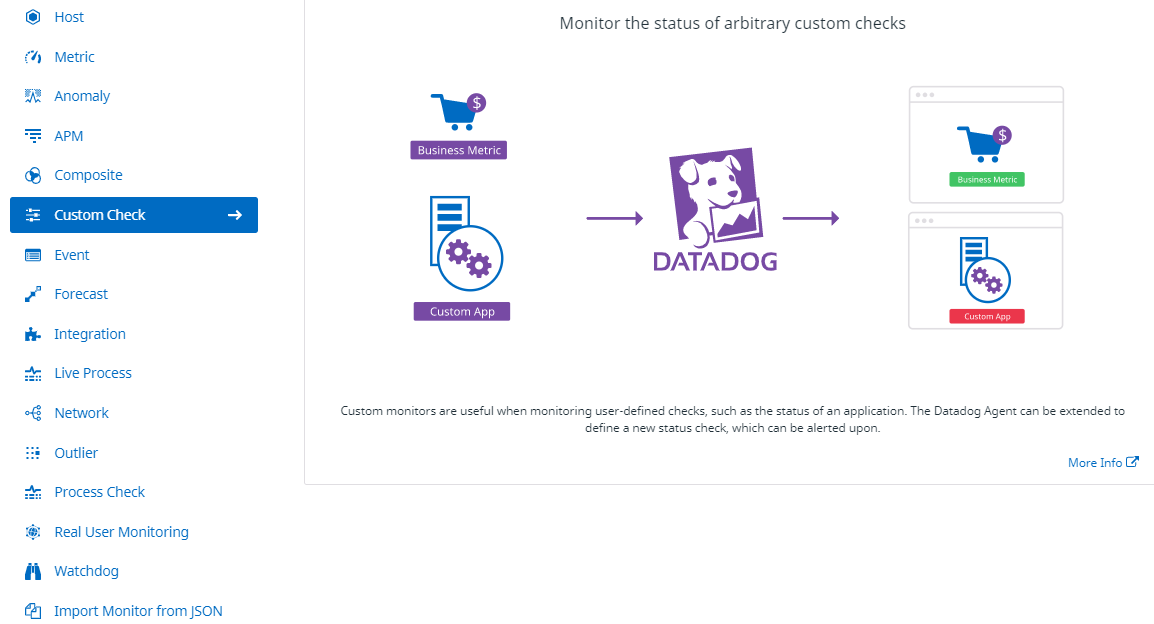
Custom Check - Monitor the status of arbitrary custom checks.
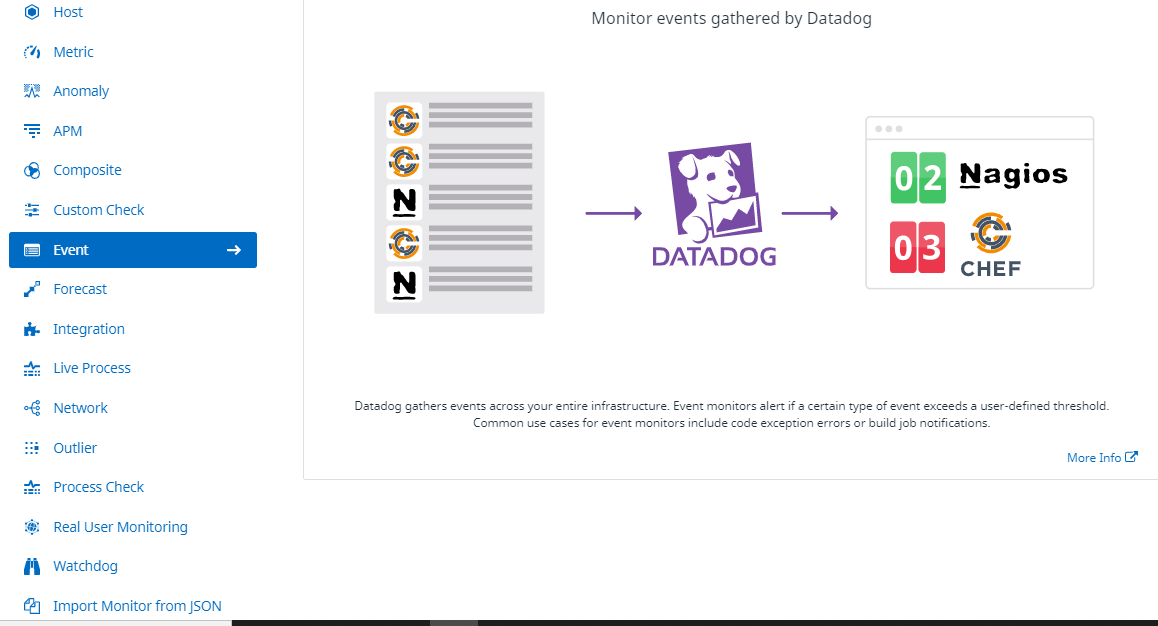
Event - Monitor events gathered by Datadog.
Logs - Monitor logs gathered by Datadog.
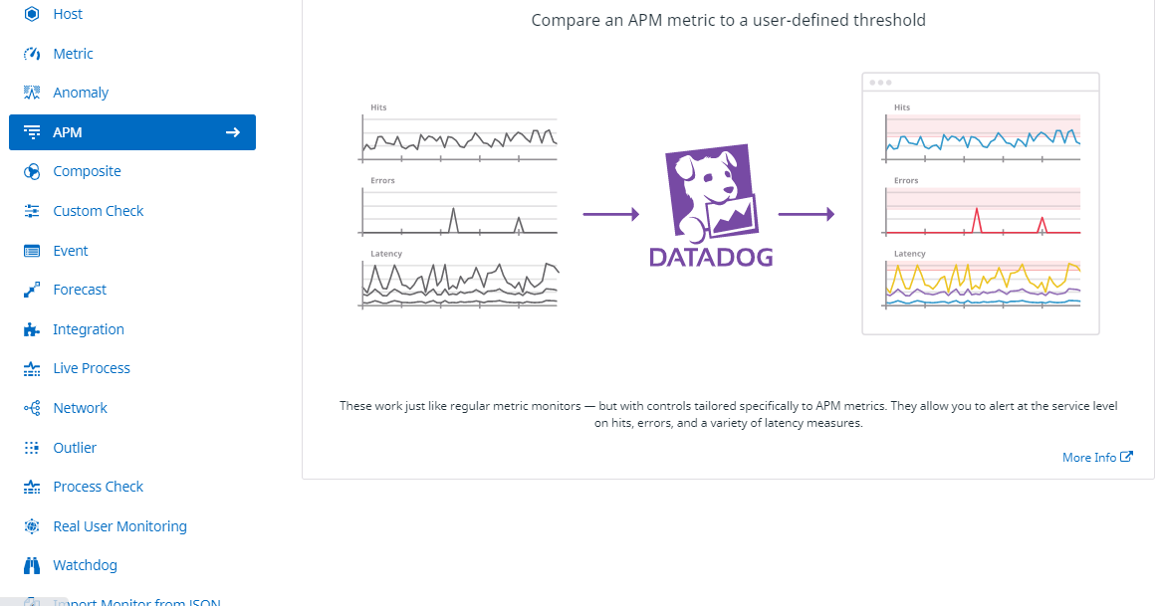
APM - Compare an APM metric to a user-defined threshold.
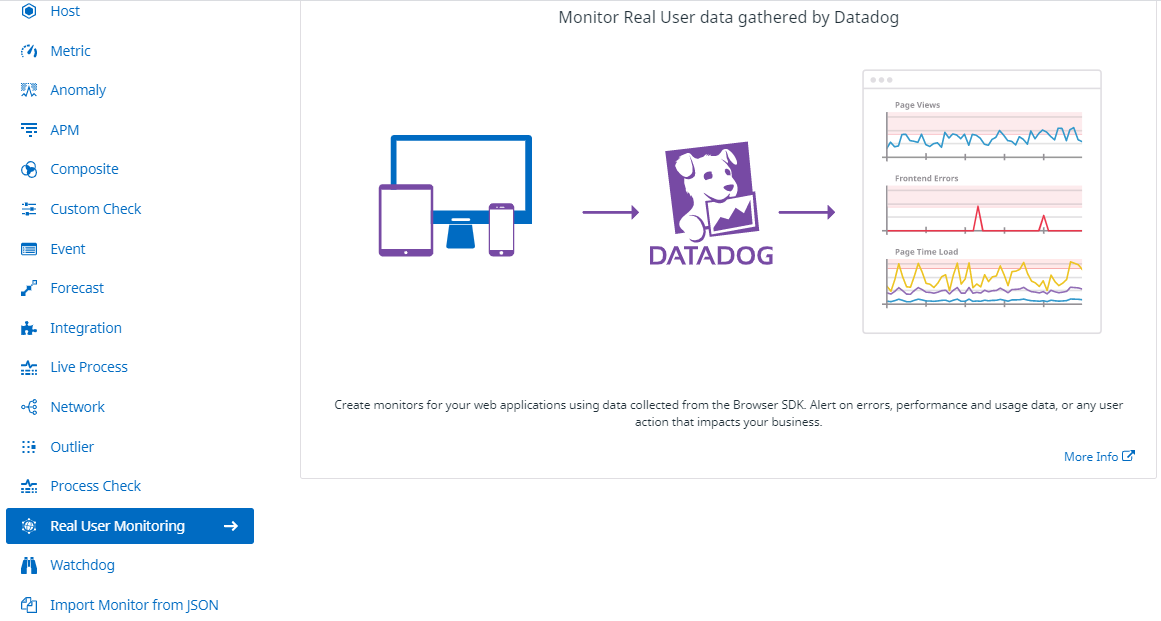
Real User Monitoring - Monitor real user data gathered by Datadog.
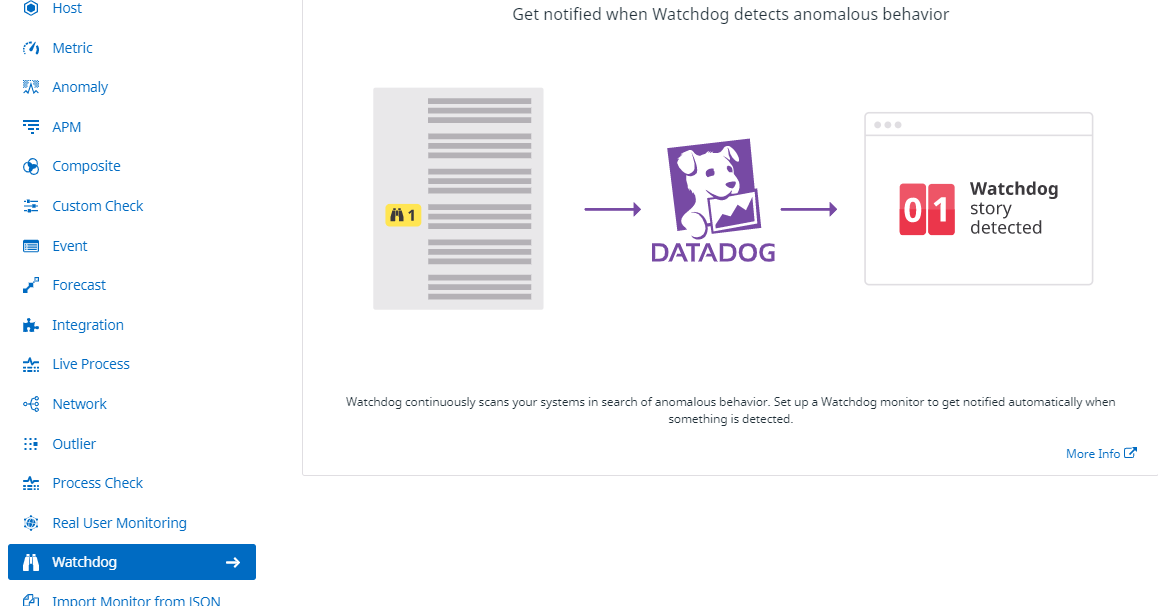
Watchdog - Get notified when Watchdog detects anomalous behavior.
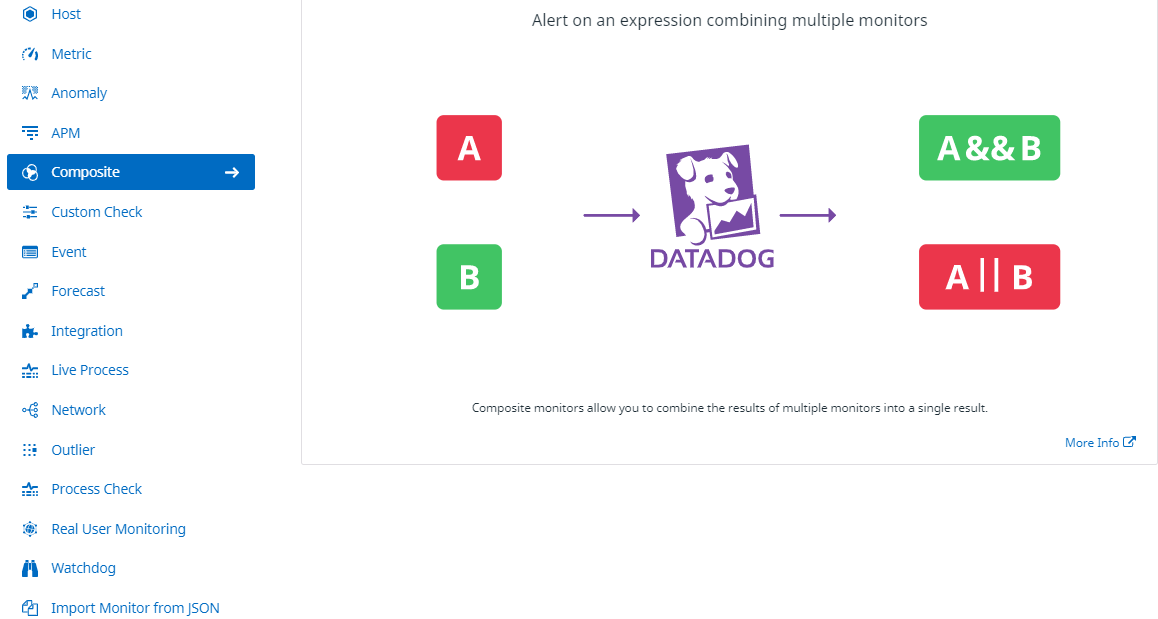
Composite - Alert on an expression combining multiple monitors.
Detection Methods
Detection Methods
- Threshold Alert
- Change Alerts
- Anomaly Detection
- Outliers Alert
- Forecast Alert

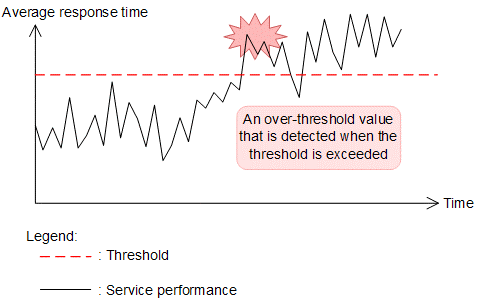
Detection Methods: Threshold Alert
- An alert is triggered whenever a metric crosses a threshold.
Detection Methods: Change Alerts
- An alert is triggered when the delta between values is higher than the threshold.
- A change alert evaluates the difference between a value N minutes ago and now.
- On each alert evaluation Datadog will calculate the raw difference (not absolute value) between the series now and N minutes ago then compute the average/minimum/maximum/sum over the selected period. An alert is triggered when this computed series crosses the threshold.
Detection Methods: Anomaly Detection
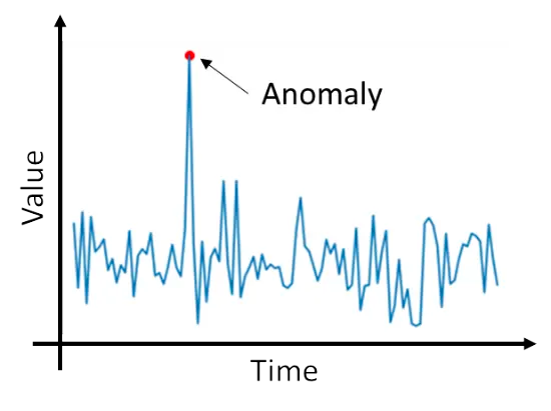
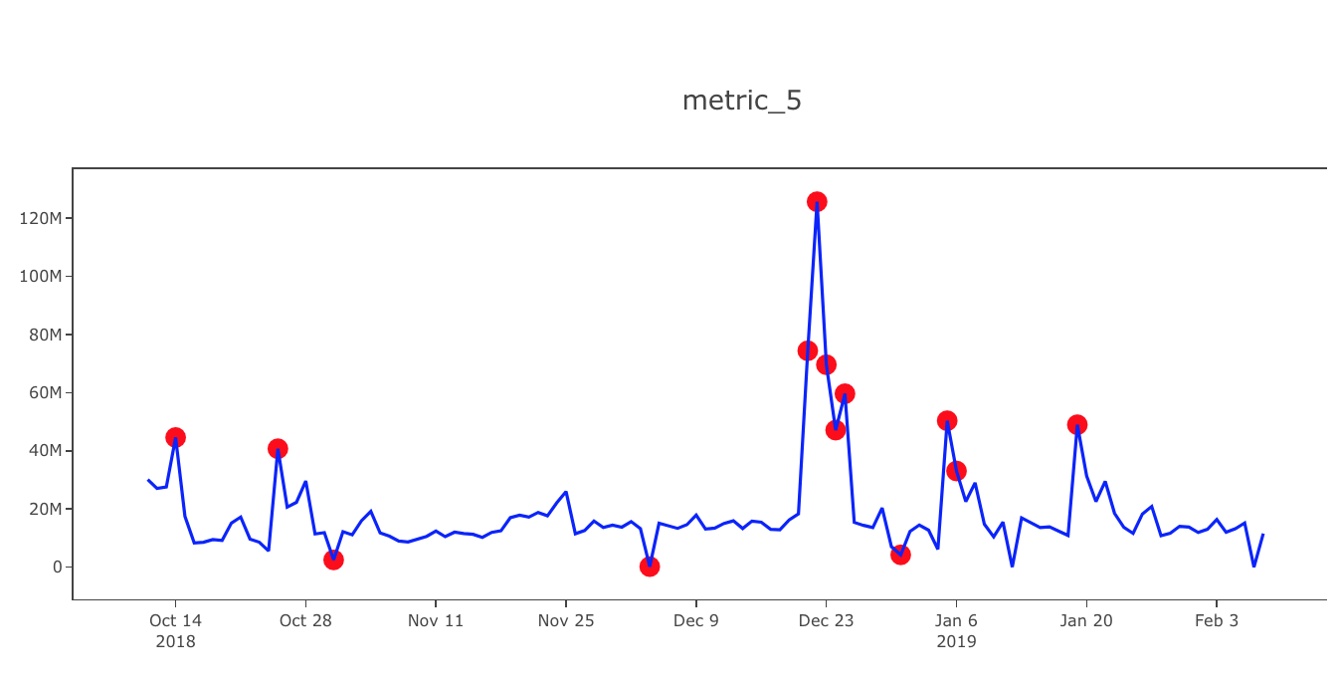
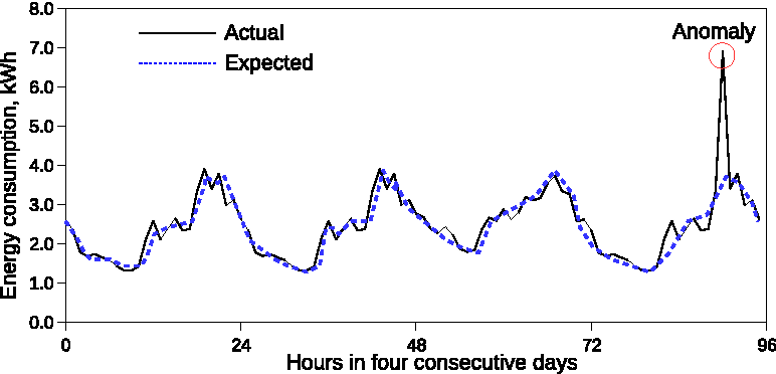
- An alert is triggered whenever a metric deviates from an expected pattern.
- Anomaly monitors detect when a metric is behaving differently than it has in the past, taking into account trends, seasonal day-of-week, and time-of-day patterns.
- To Detect anomalous behaviour for a metric based on historical data
Detection Methods: Anomaly Detection

Detection Methods: Anomaly Detection
Detection Methods: Anomaly Detection
Detection Methods: Anomaly Detection
Detection Methods: Anomaly Detection
Detection Methods: Outliers Alert
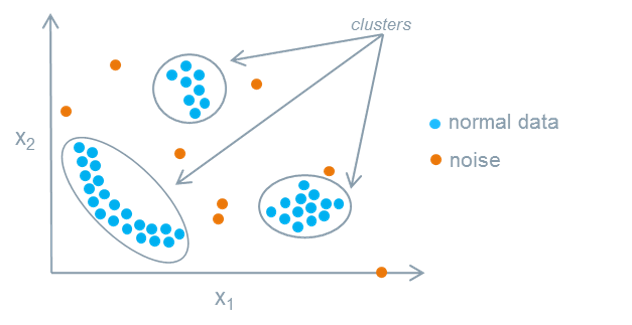
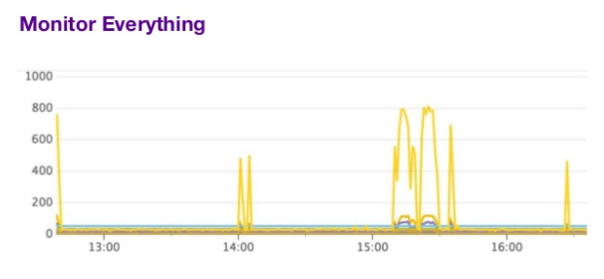
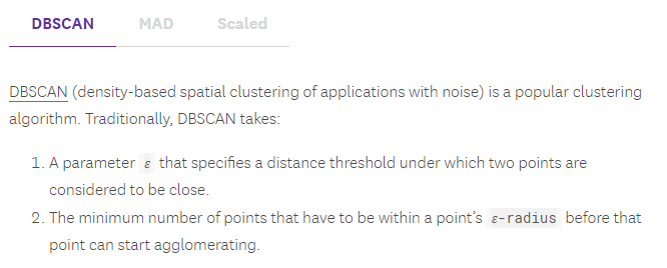
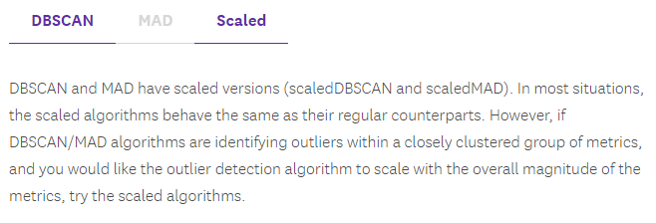
- Outlier detection is an algorithmic feature that allows you to detect when a specific group is behaving different compared to its peers. For example, you could detect that one web server in a pool is processing an unusual number of requests, or significantly more 500 errors are happening in one AWS availability zone than the others.
- An alert is triggered whenever one member in a group behaves differently from its peers.
Detection Methods: Outliers Alert

Detection Methods: Outliers Alert

Detection Methods: Outliers Alert
Detection Methods: Outliers Alert
Detection Methods: Outliers Alert

Detection Methods: Outliers Alert
Detection Methods: Forecast Alert
- An alert is triggered whenever a metric is forecast to cross a threshold in the future.
- Forecasting is an algorithmic feature that allows you to predict where a metric is heading in the future. It is well-suited for metrics with strong trends or recurring patterns. For example, if your application starts logging at a faster rate, forecasts can alert you a week before a disk fills up, giving you adequate time to update your log rotation policy.
Detection Methods: Forecast Alert

Monitor type: Live Process

Monitor type: Process Check

Monitor type: Process Check

Why use Tags?
- Host Tags will automatically be added to that host's metrics and events.
- Metrics can be filtered and aggregated by Tag.
- Events can be searched by Tag.
What's a Tag?
- Tags can be any word or key:value pair, such as pool:web or test.
- Tags of the form key:value define new dimensions by which you can slice metrics or alerts.
Special Tags
- Certain integrations allow Datadog to automatically tag your hosts. For example:
- AWS instances will automatically be tagged with properties, including availability-zone and instance-type.
- Hosts managed by Chef will automatically be tagged with the right role.
DevOpsSchool Community Networks
These platforms provide you the opportunity to connect with peers and industry DevOps leaders, where you can share, discuss or get information on latest topics or happenings in DevOps culture and grow your DevOps professionals network.
 |
|---|
| DevOps |
| Build & Release |
 |
|---|
| DevOps |
| Build & Release |
 |
|---|
| DevOpsSchool |
| DevOps Group |
 |
|---|
| BestDevOps.com |

Any Questions?

Thank You!
DevOpsSchool — Lets Learn, Share & Practice DevOps
Connect with us on
contact@devopsschool.com | +91 700 483 5930Next up:

Datadog Course
5. Datadog Dashboard
