Introduction of Monitoring & Observability
by DevOpsSchool.com
Rajesh Kumar
(Senior DevOps Manager & Principal Architect)

-
DevOps@RajeshKumar.xyz
www.rajeshkumar.xyz
/RajeshKumarLog
/RajeshKumarIN
/RajeshKumarIN
Rajesh Kumar — an award-winning academician and consultant trainer, with 15+ years’ experience in diverse skill management, who has more than a decade of experience in training large and diverse groups across multiple industry sectors.
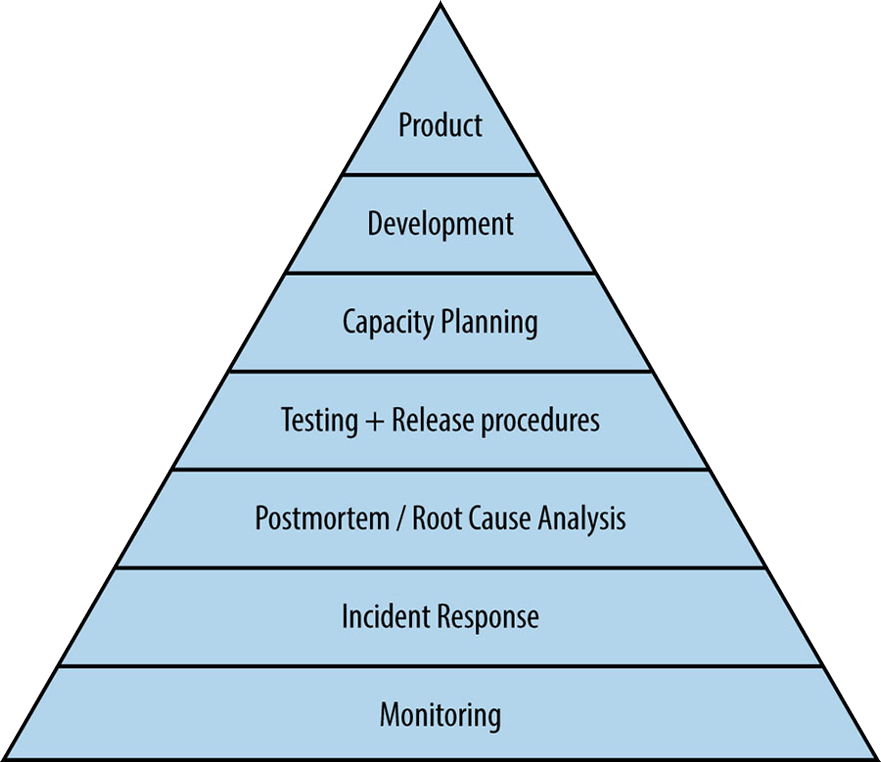
Monitoring
Monitoring is the most basic component in their reliability pyramid and enables incident response and postmortems. When we understand what causes problems in our services we can take steps to prevent them.
Monitoring
Monitoring and Observability
Once upon a time there was “Monitoring”
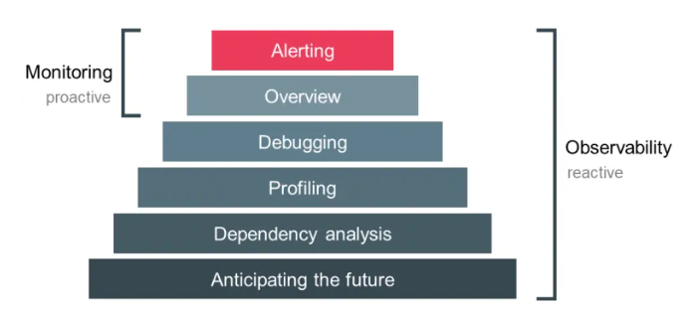
Observability is a superset of monitoring. It provides not only high-level overviews of the system’s health but also highly granular insights into the implicit failure modes of the system.
In addition, an observable system furnishes ample context about its inner workings, unlocking the ability to uncover deeper, systemic issues.
Monitoring, on the other hand, is best suited to report the overall health of systems and to derive alerts.
"Monitoring tells you whether a systems is working, obserability lets you ask why it ist't working."
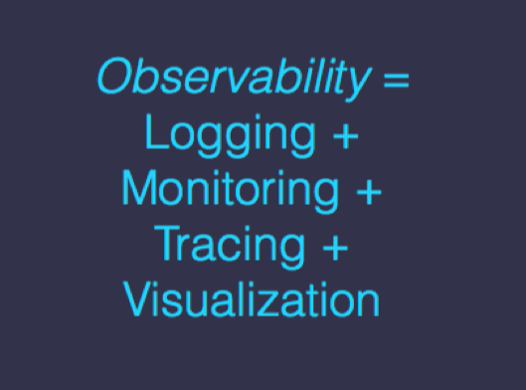
Observability
Observability means assembling all fragments from logs,
monitoring tools and oranize them in such a way which gives actionable knowledge of the whole enviroment,
thus creating an insight.
Taken from Artical, Observability Working Architecture and Benefits
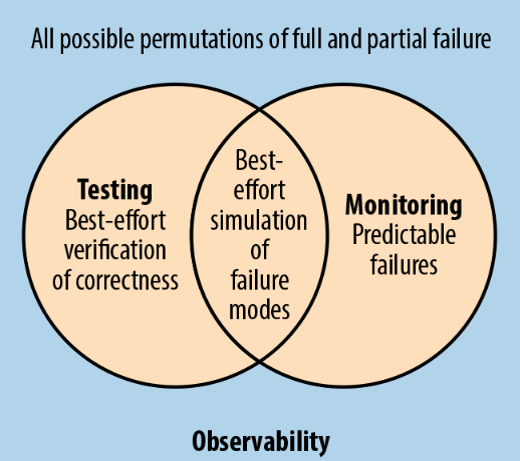
Monitoring systyem should address two questions: what's broken, and why?
In summary, Observability is a property of a system and Monitoring is an activety we perform on a system.
While Observability covers a larger scope, monitoring is mainly used in terms of metrics monitoring.
These are the types of data that a system should produce to be observable.
- Health checks: they are often custom HTTP endpoints, help orchestrators, like Kubernetes or Cloud Foundry, they are performed to maintain the excellent health of the system.
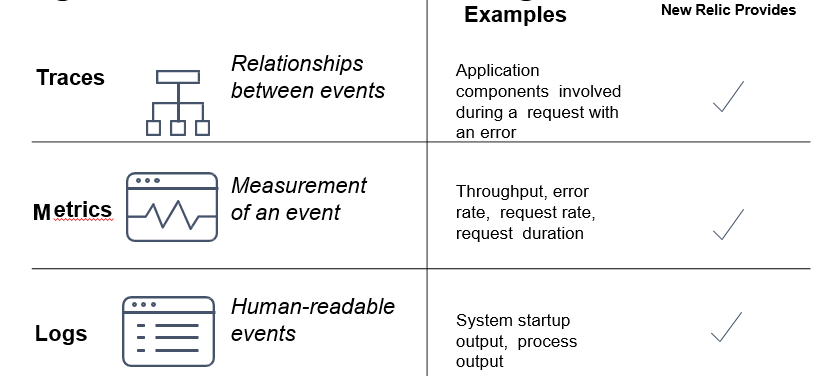
- Metrics: they are a numeric representation of data that is collected at regular intervals into a time series. The Numerical time series data is straightforward to store and can query quickly; it helps when looking for historical trends.
- Log entries: they represent discrete events. The Log entries are essential for debugging, as they often include stack traces and other contextual information that can help identify the root cause of observed failures.
- Distributed, request or end-to-end tracing: they capture the end-to-end flow of an application through the system. Tracing essentially captures both relationships between services (the services the request touched), and the structure of work through the system (synchronous or asynchronous processing, child-of or follows-from relations).
Telemetry
Telemetry is the collection of measurements or other data at remote points and their automatic transmission to receiving equipment for monitoring. The word is derived from the Greek roots tele, "remote", and metron, "measure".
MELT
Four essential telemetry data types
- Metrics
- Events
- Logs
- Traces
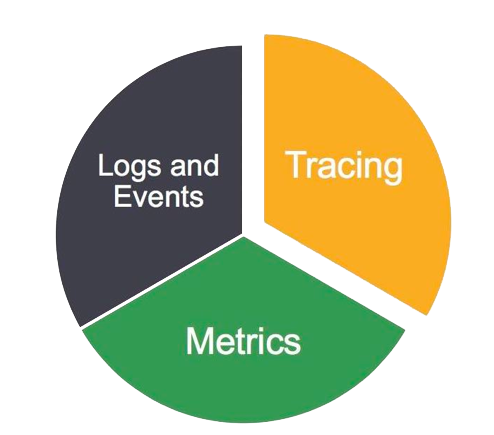
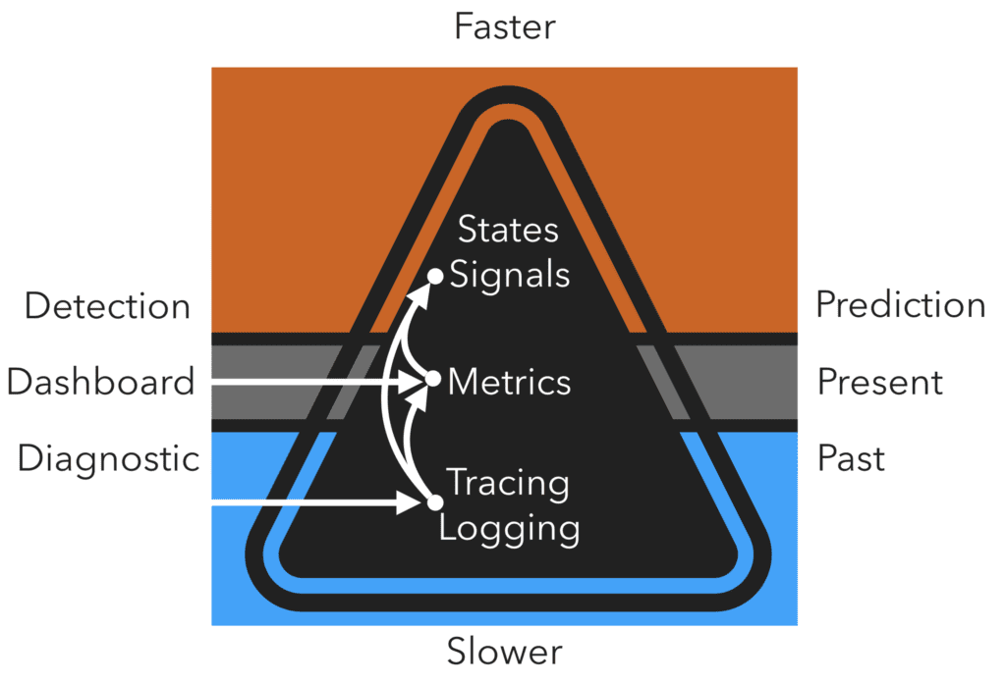
The Observability Hierarchy
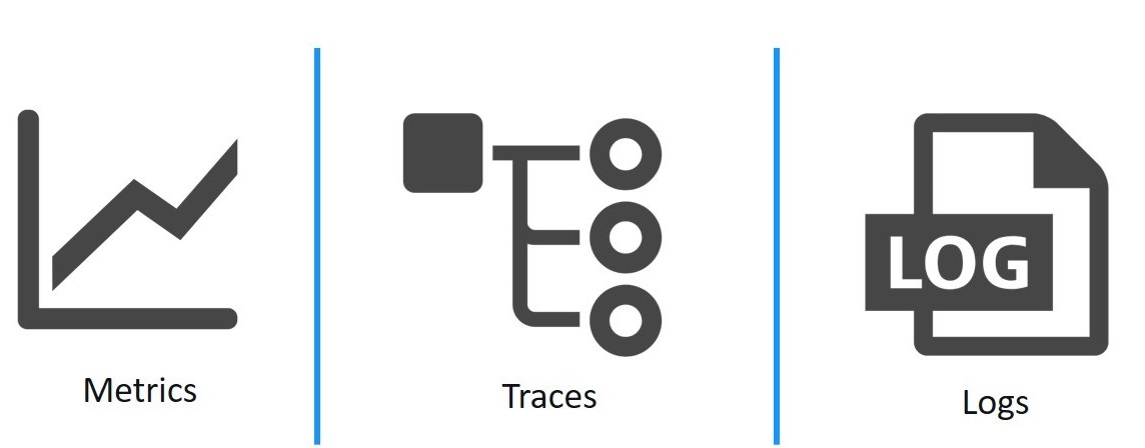
Three pillars of observability
Why is Observability hard?
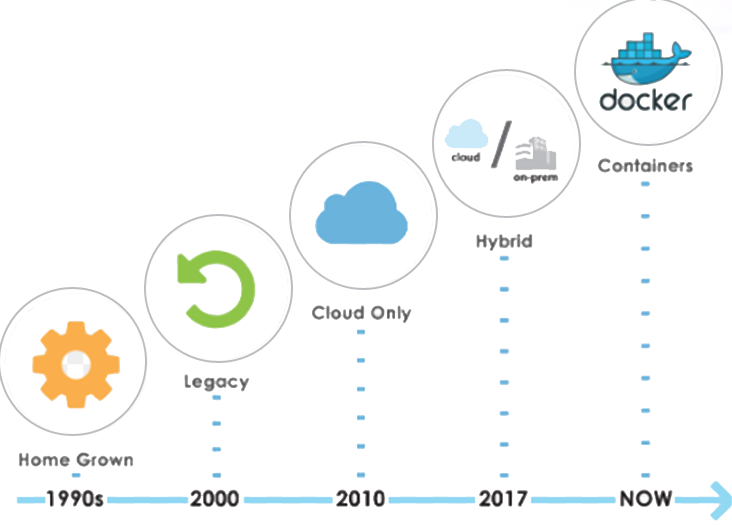
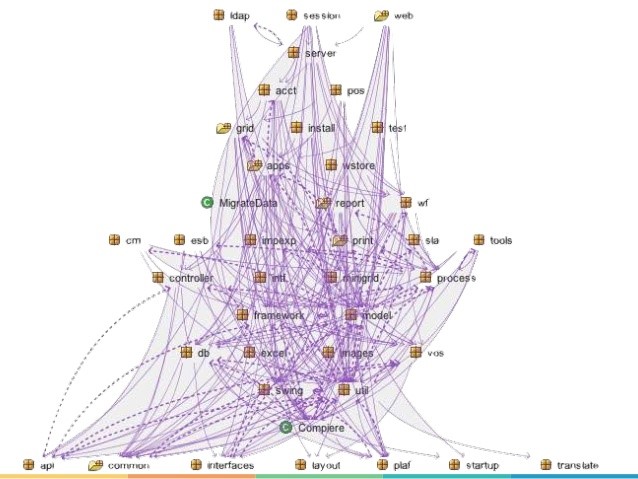
Evolution of Software Architectures
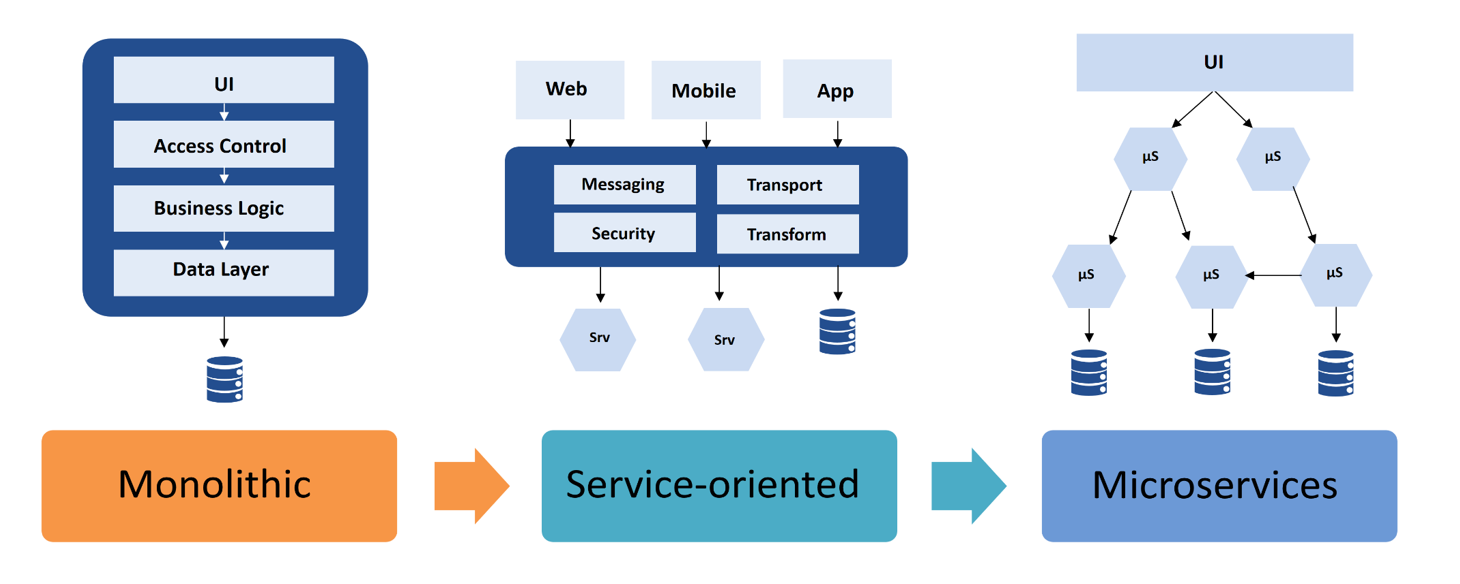
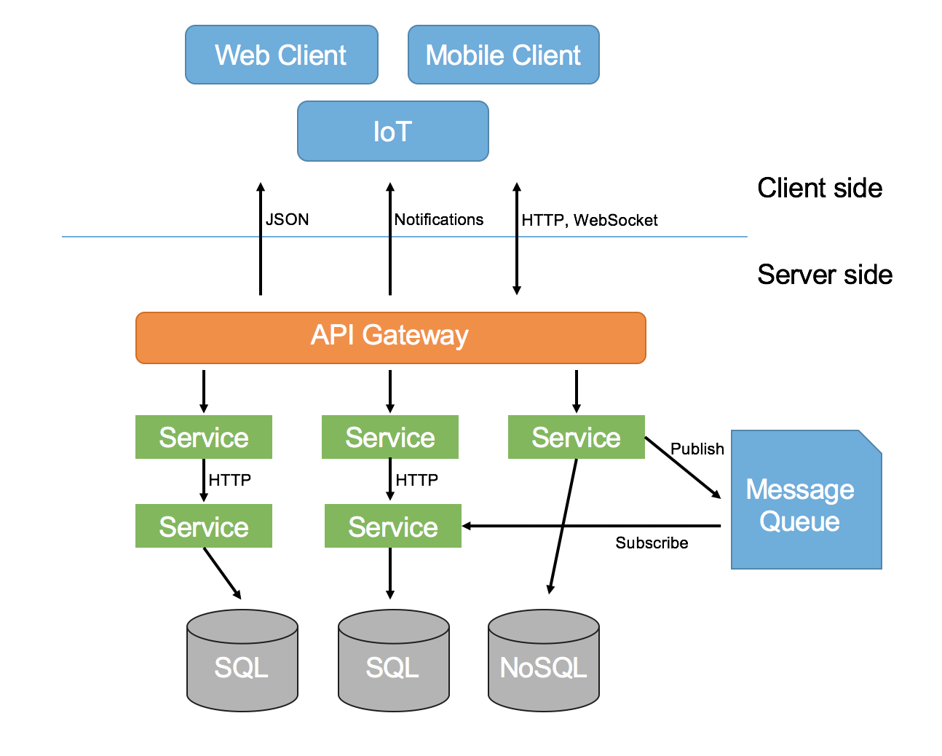
Service Oriented Architecture
SOA
Architecture Diagram
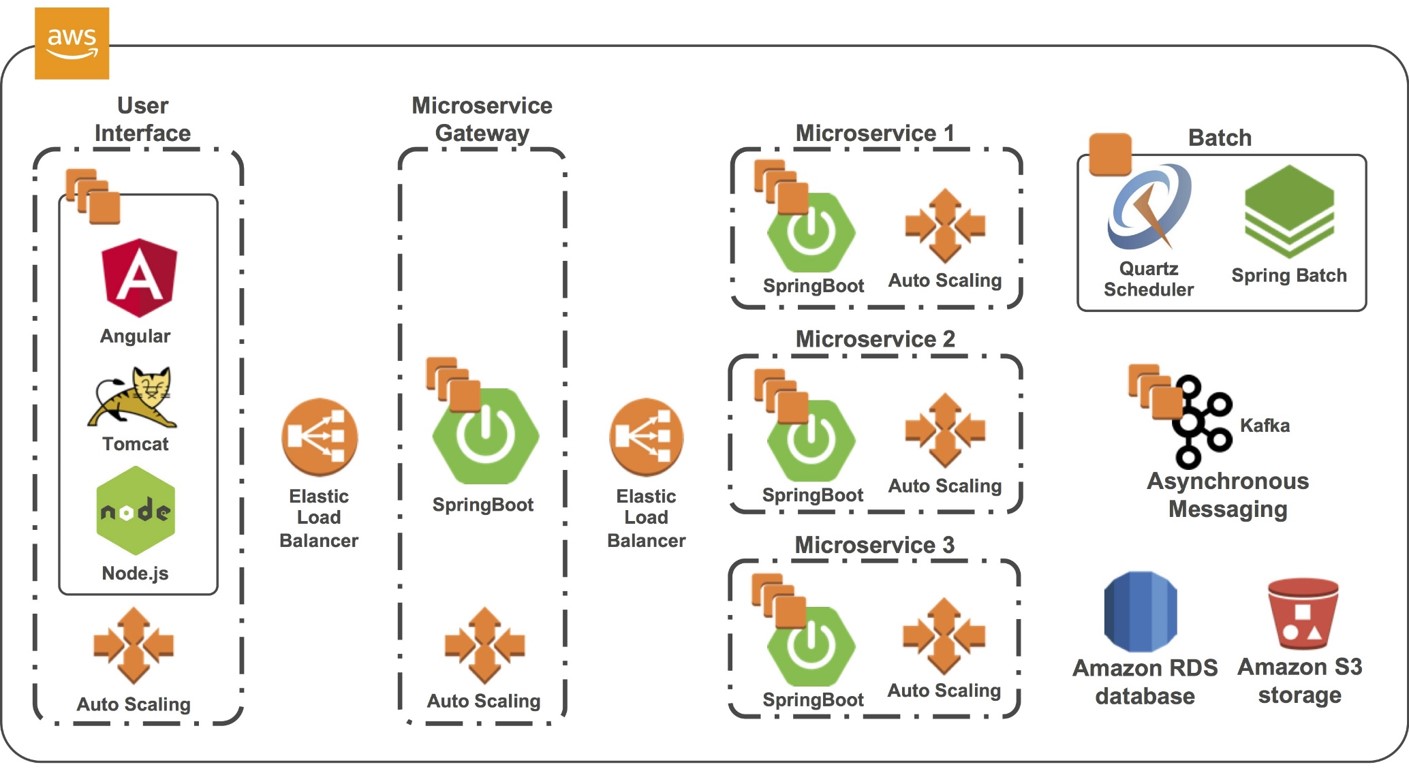
Software Architecture for Cloud Native Apps
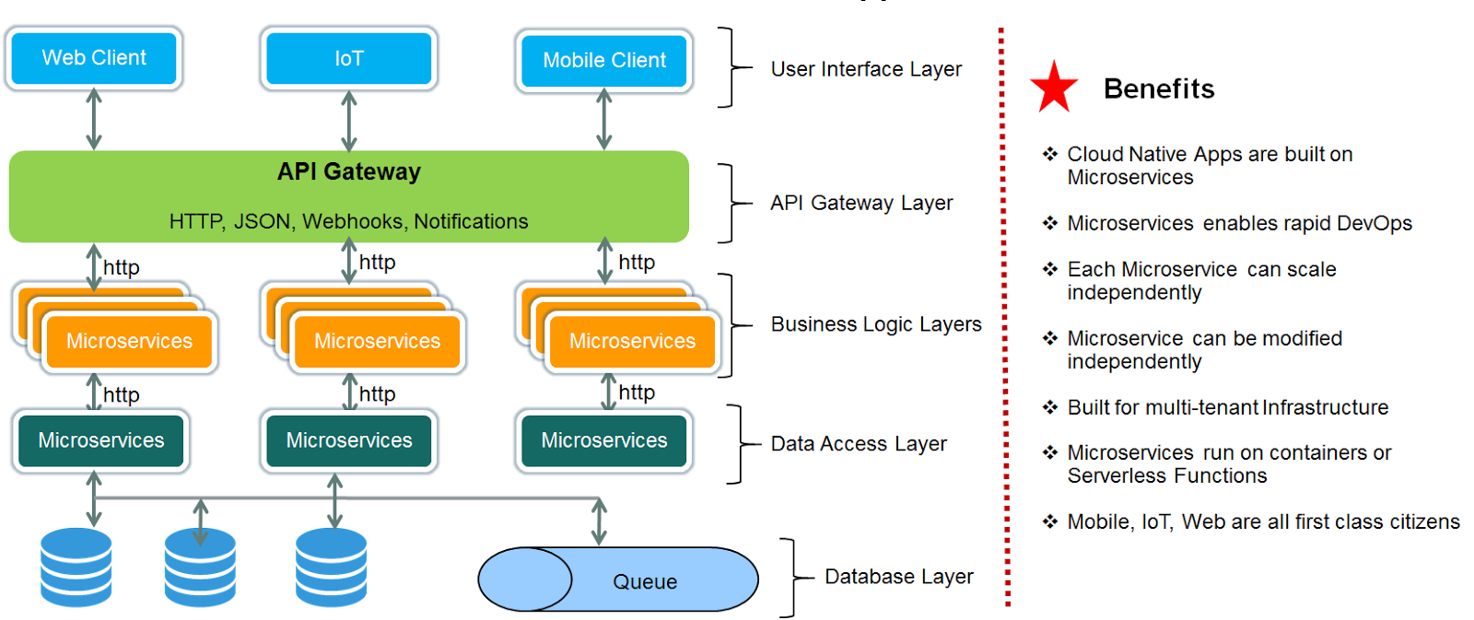
Too many
Micro services!!!!
From any source, monitoring data can be
organized into three main categories

Thank You!
DevOpsSchool — Lets Learn, Share & Practice DevOps