New Relic Introduction and Its Components
by DevOpsSchool.com
Rajesh Kumar
(Senior DevOps Manager & Principal Architect)

-
DevOps@RajeshKumar.xyz
www.rajeshkumar.xyz
/RajeshKumarLog
/RajeshKumarIN
/RajeshKumarIN
Rajesh Kumar — an award-winning academician and consultant trainer, with 15+ years’ experience in diverse skill management, who has more than a decade of experience in training large and diverse groups across multiple industry sectors.
Digital Experience is Now Brand Experience
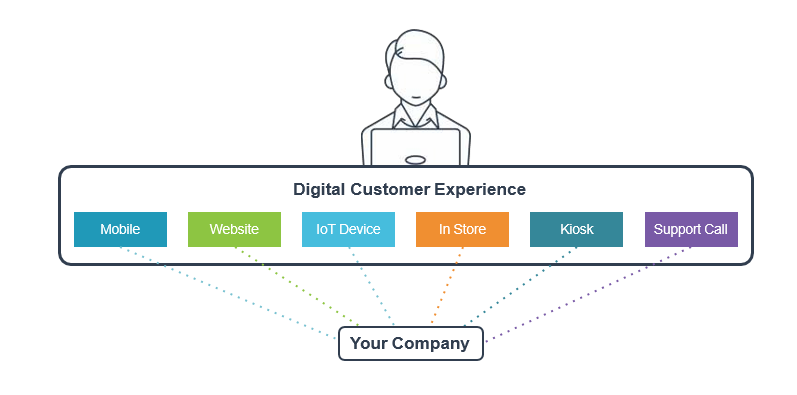
What makes up your digital customer experience (DCX) ?
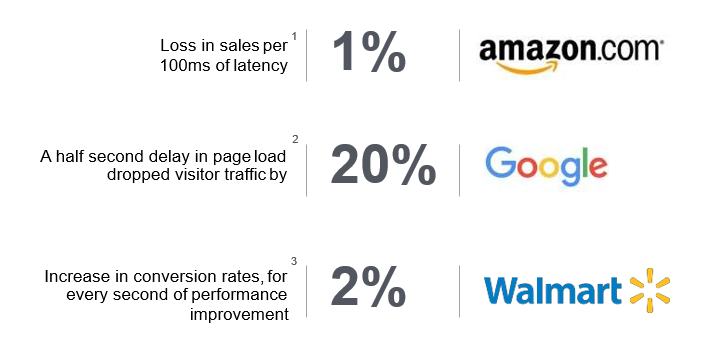
Poor digital experiences risk customer backlashes

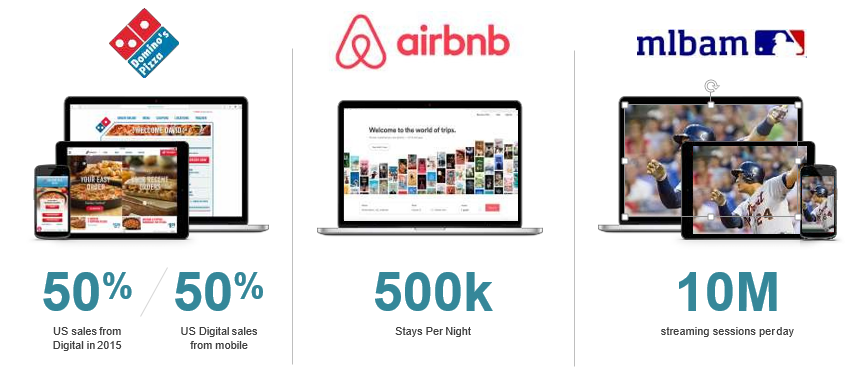
Digital Experience impacts important business metrics
Our Goal:
To be the first, best place to look to understand your digital business
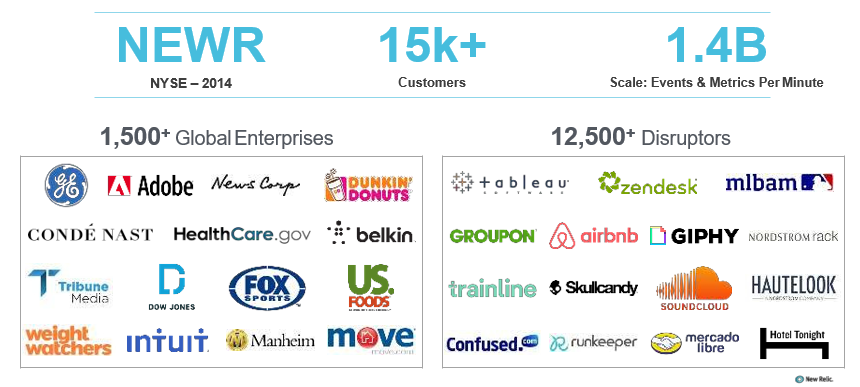
New Relic History
- Wily Technology - Founded 1998 by Lew Cirne
- Java Profiler - JProfiler, JProbe, YourKit, CA Profiler
- CA Acquires Wily in 2006
- Lew Cirne found New Relic in 2008
- AT&T Using New Relic in 2009 @ $1M/year
- Chegg, Oversee.net, Synctree all use New Relic
NewRelic into all?
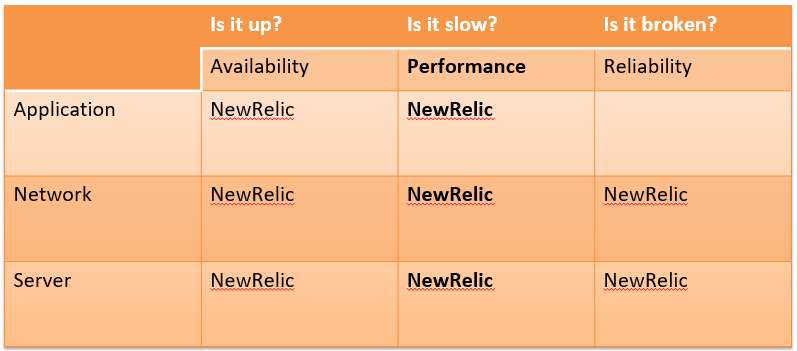
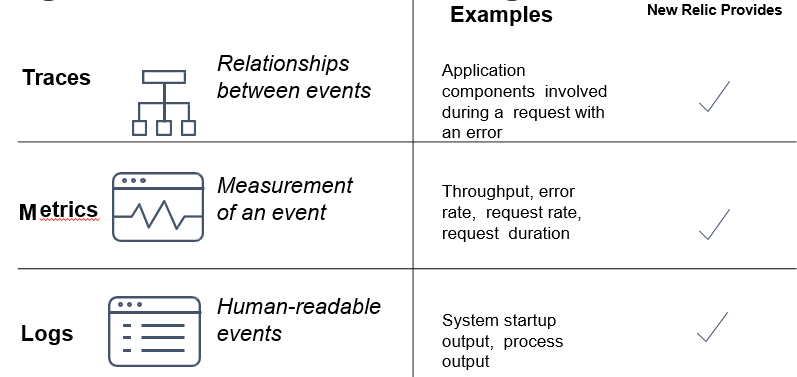
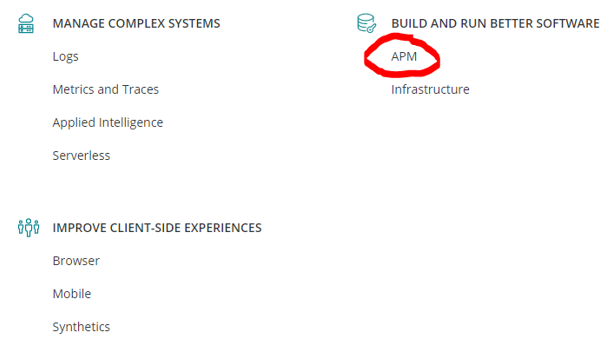
Newrelic Components
From any source, monitoring data can be
organized into three main categories
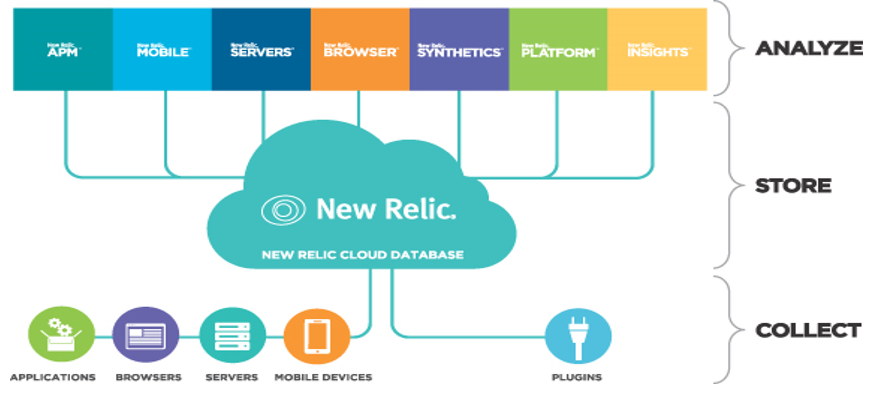
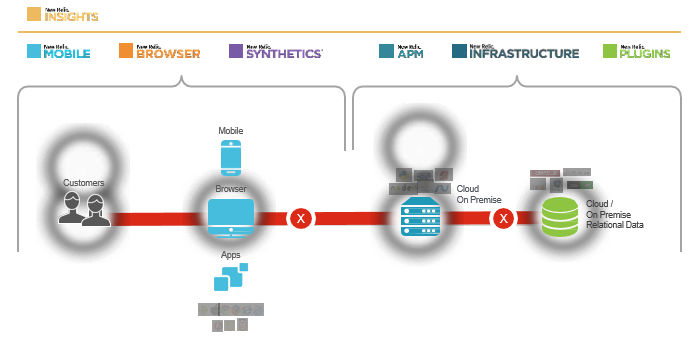
New Relic Architecture
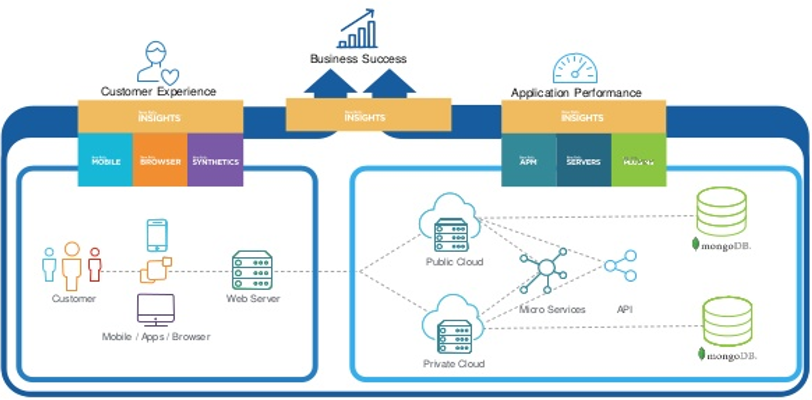
New Relic in Your Software Architecture
NewRelic monitor everything
Ease of Setup
- Sign up on newrelic.com for 30 day free trial,
get license key - Download appropriate SDKs
- Add SDK to startup script of app
- Data comes in within minutes!
- Chef/Puppet/Ansible package
configuration management allows you
to scale NR
New Relic Pricing and Spend
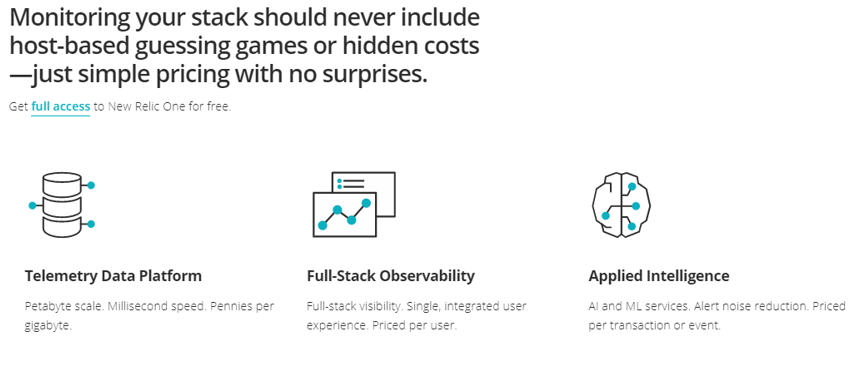
New Relic Pricing and Spend
Telemetry Data Platform
Collect, analyze, and alert on all your mrtrics, events, logs, and traces from any source- all in one place
- Basic user get plactform access to ingest, query , and dashboard telemetry data at $0 per user
- Free up to 100 GB/month.
- $0.25 per GB ingested beyond free limit.
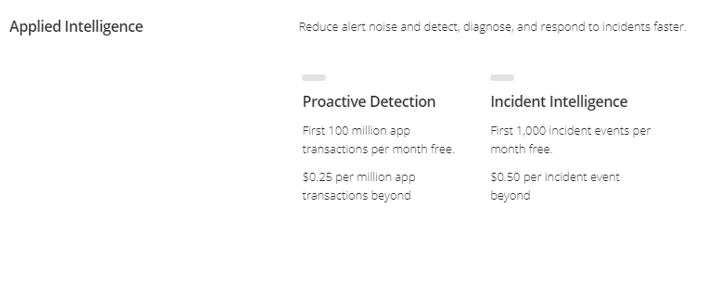
New Relic Pricing and Spend
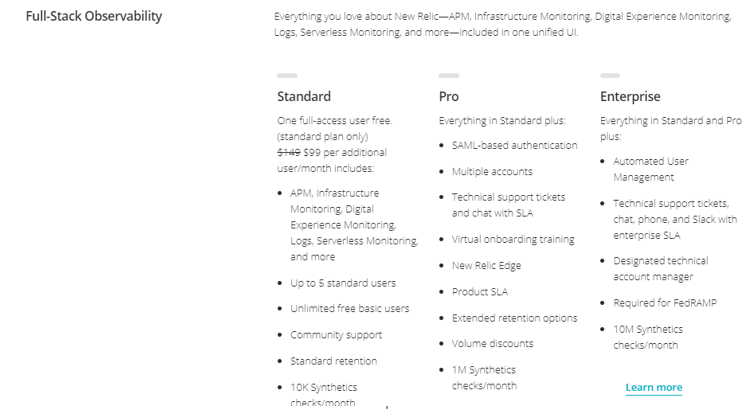
New Relic Pricing and Spend
The 10 key capabilities of New Relic
Let’s look at 10 specific capabilities that make New Relic APM the application performance monitoring tool of choice for modern software teams
- Easy-to-set-up real-time instrumentation and analytics
- Flexible instrumentation and Dashboarding
- Guides appropriate engineer responses
- Correlate application performance to end-user experience
- Connects application and infrastructure performance
- Rich, detailed transaction data
- Real-time error analysis with on-demand diagnostic tools
- Integration with DevOps tooling
- Cloud-service instrumentation
- Built to scale
Improving the service level quality of your digital experience
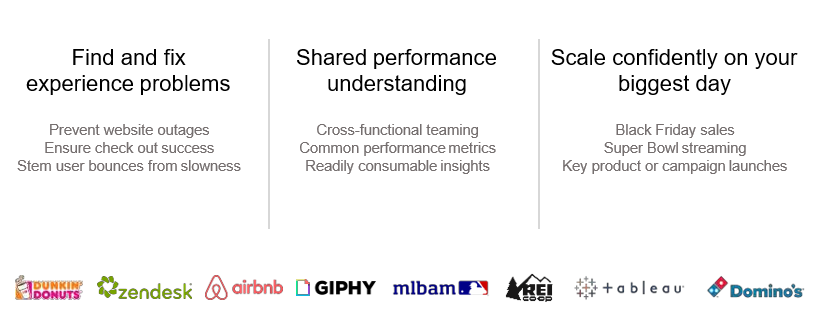
A break anywhere in your technology stack can
impact your customer experience
Find and fix problems in all the layers of your tech stack
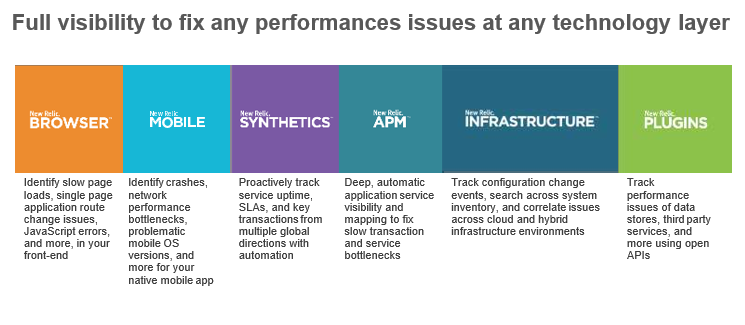
Find and fix problems in all the layers of your tech stack
How Do You Measure Digital Customer Experience?
Clay Smith
Developer Advocate
csmith@newrelic.com
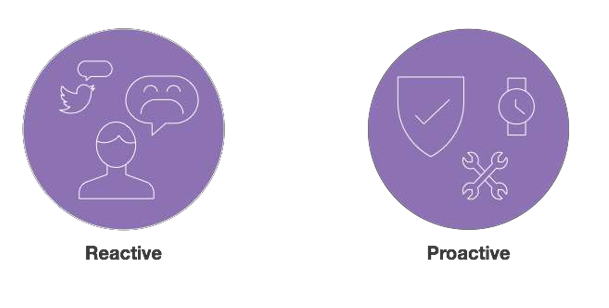
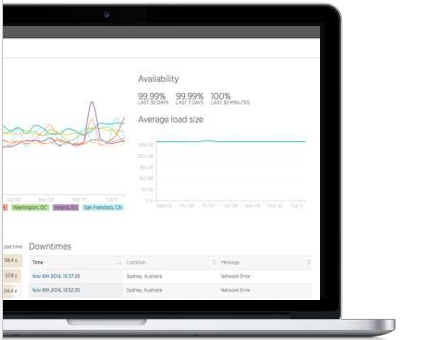
Finding problems from a customer’s perspective
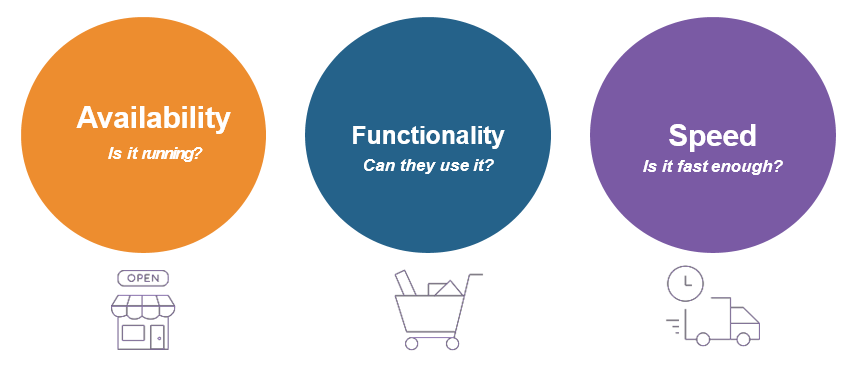
Digital Customer Experience: Critical Measurements
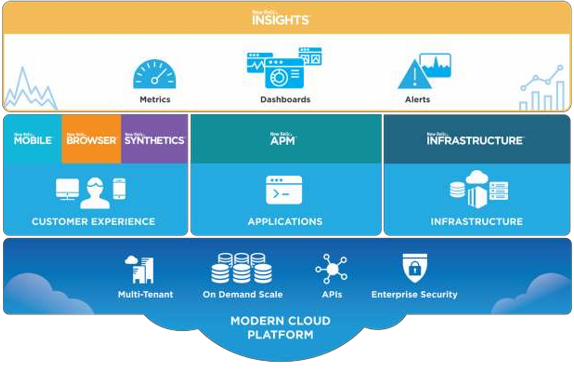
New Relic Digital Intelligence Platform
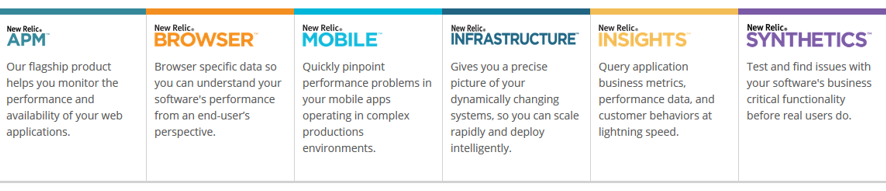
New Relic APM
New Relic APM is a development-time dependency that you add to your backend code which will give detailed information about your application such as response time, throughput, and error rate wherever it is running. APM will show you the line of code that an exception was thrown from, the exact database query that’s slowing down your system, and even automatically build a map of all upstream and downstream dependencies to your application. Bear in mind that the setup process for New Relic APM will differ depending on the language your particular applications were developed in.
New Relic
BROWSER
What it does:
- Identify slow page loads, single page application route change issues, JavaScript errors, and more
- Provide actionable code level data to troubleshoot and resolve any of these performance issues quickly
Impact to digital experience:
- Ensure your desktop and mobile websites load quickly without any errors

New Relic
SYNTHETICS
What it does:
- Monitor service uptime and SLAs for key services from multiple global directions
- Proactively verify key transaction success for external and internal services
Impact to digital experience:
- Ensure the APIs, backend, and microservices that
power your websites and mobile apps
are up and running smoothly
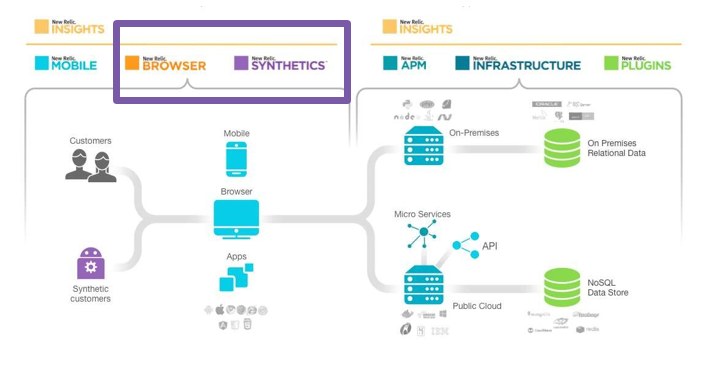
New Relic Browser
New Relic Browser is a JavaScript library which is injected into your HTML documents to get detailed information about how your front-end code is executing on your users’ browsers. New Relic Browser will show you JS errors broken down by browser, geographic response times and even full session traces of user engagement with your website.
New Relic Browser can be setup automatically by simply installing New Relic APM on your backend and turning it on via the web interface or by copy/pasting the JavaScript directly into your HTML pages.
New Relic Synthetics
New Relic Synthetics is a distributed synthetic monitoring tool which will take a URL or Selenium-style script and execute it to validate your systems as if it were a user accessing your content.
This tool acts as a ‘canary in a coal mine’ notifying you of issues long before your users experience them. Synthetics is managed entirely from the New Relic interface and can be setup in a matter of minutes without a single change to your systems.
New Relic Infrastructure
New Relic Infrastructure is a daemon agent which runs on your hosts grabbing server level details about the underlying infrastructure supporting your applications such as CPU, memory, and running processes. This tool is equally well-suited for traditional on-premises deploys as well as dynamic, cloud-scale environments.
In addition to the daemon agent, there is both a SaaS-to-SaaS integration with AWS to pull in additional data about AWS components as well as an SDK for instrumenting additional on-host systems such as databases, caches, and more.
Sign up
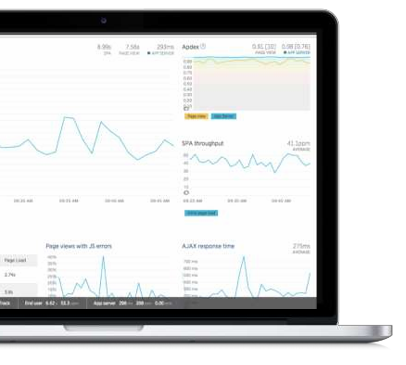
Welcome Page
Welcome Page
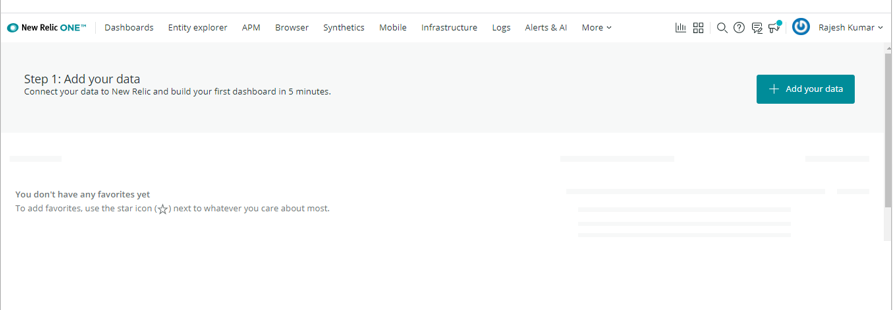
NewRelic One

NewRelic One
New Relic One lets you find, visualize, and understand everything that’s happening across your software environment. Cut through complexity, provide context, and see across artificial organizational boundaries, quickly finding and fixing problems.
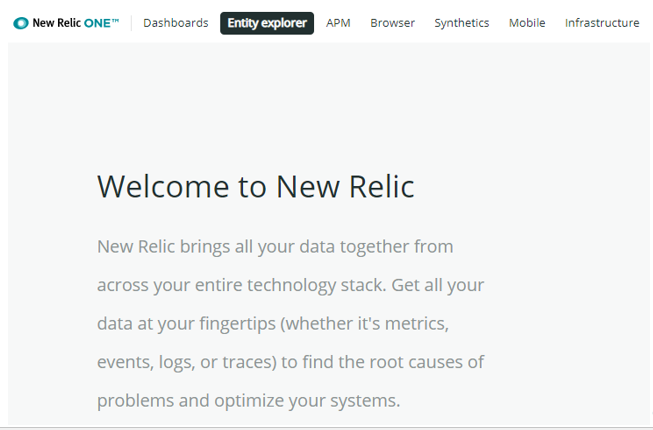
Entity explorer

Thank You!
DevOpsSchool — Lets Learn, Share & Practice DevOps