Understanding Microservices
With RAJESH KUMAR
www.DevOpsSchool.com
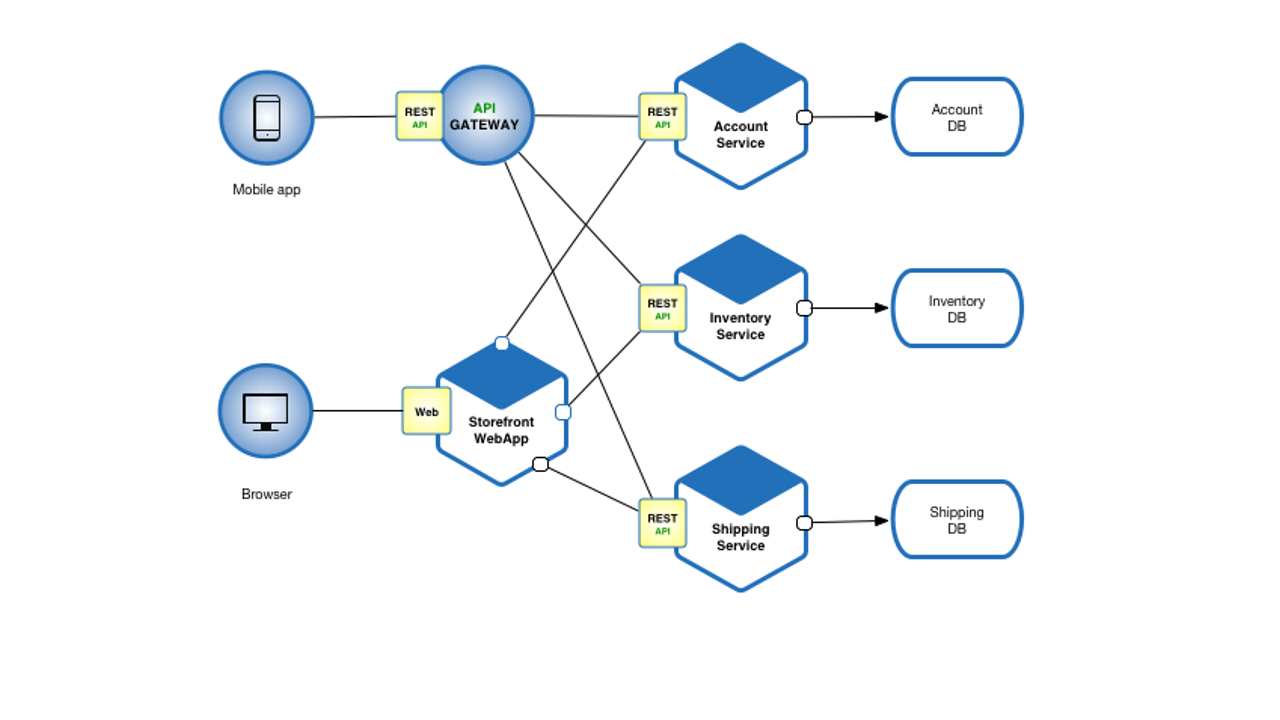
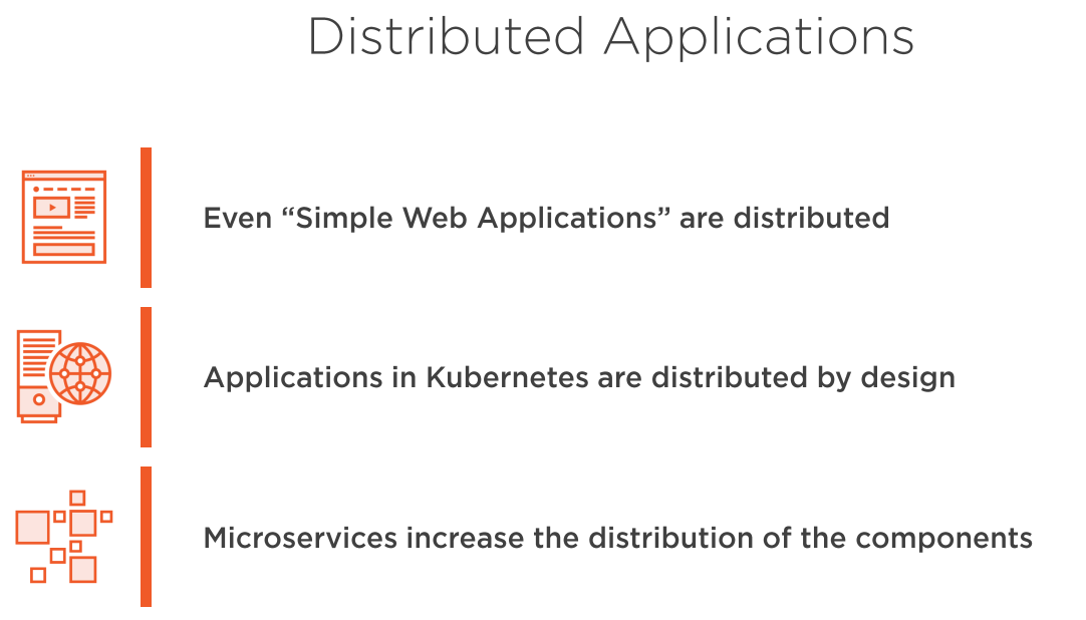
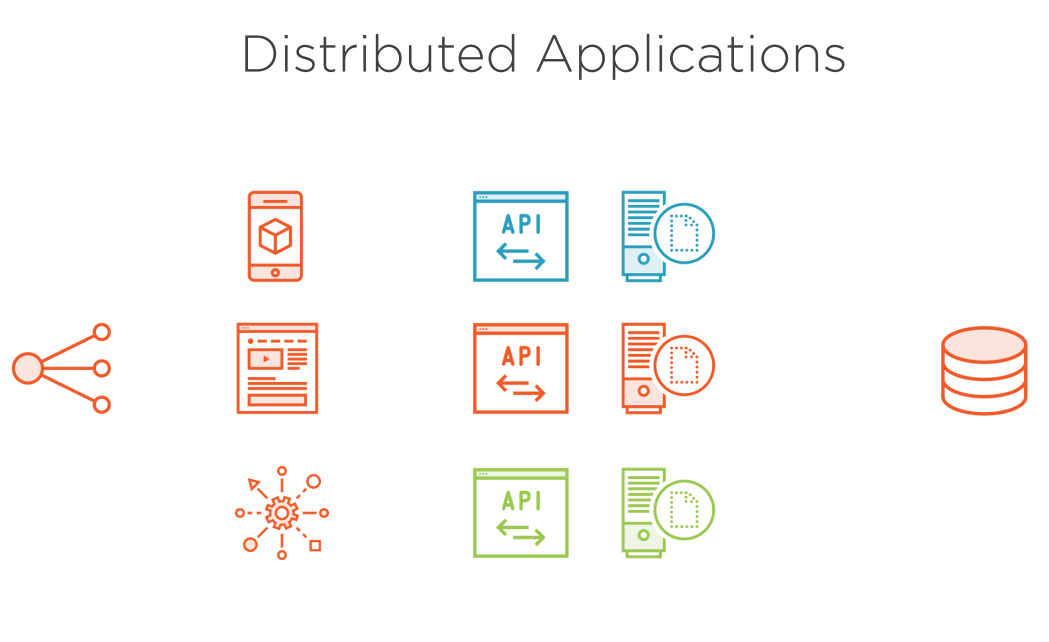
Microservices are loosely coupled independent services, that work in tandem to execute a function or a request.
The communication between individual services happen via interconnected APIs. Since each service works independently, dependencies between services are reduced and this favours scalability and faster code deployments.
Identifying and Eliminating Bottlenecks
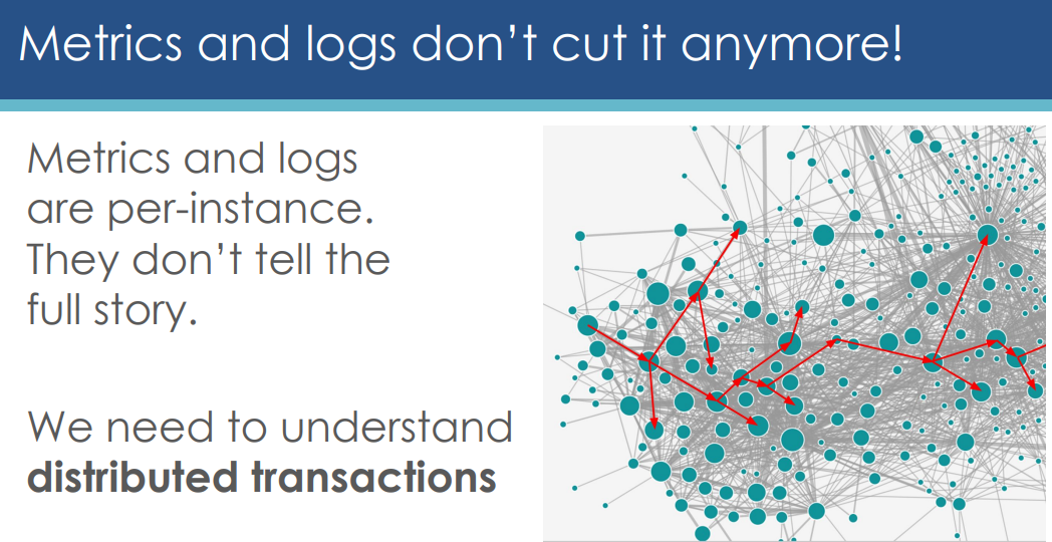
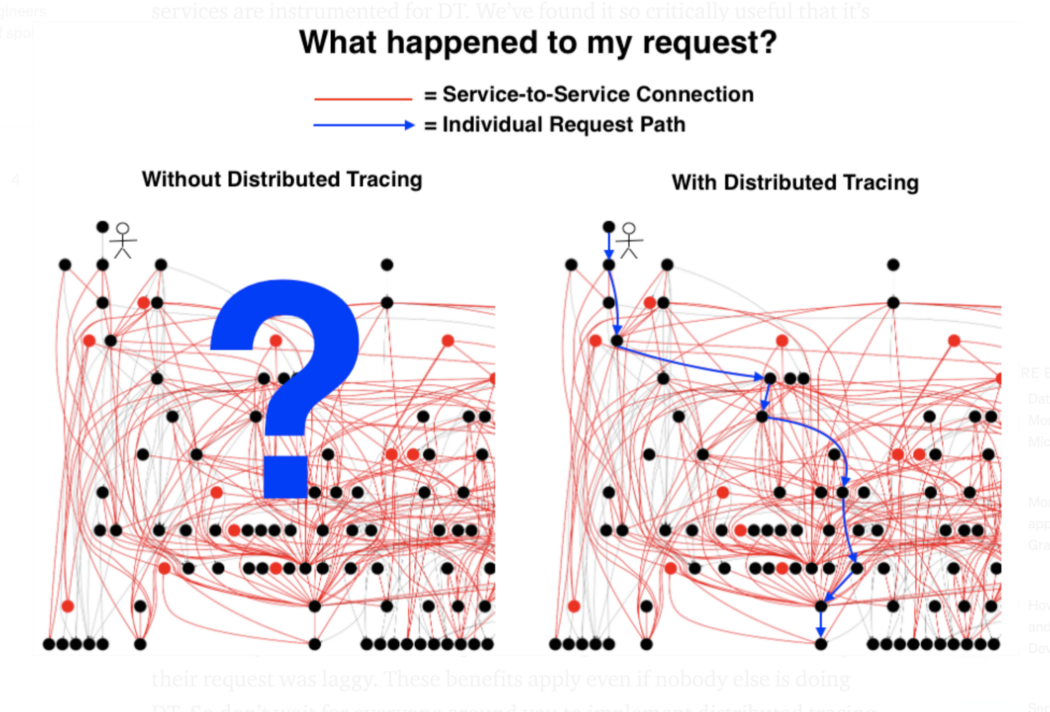
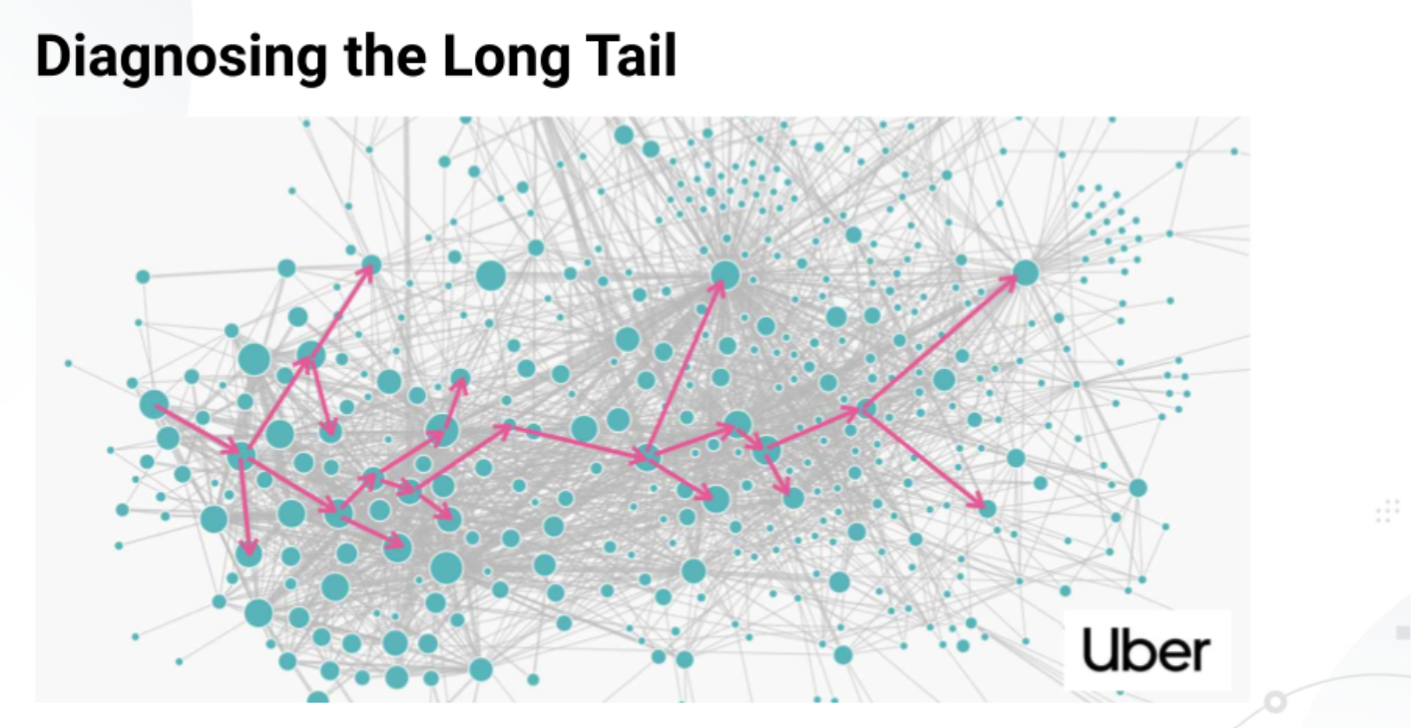
But complex applications tend to bring complex problems. In a microservice architecture, when an error occurs, it is difficult to trace back to the root cause of the error because of the interconnected services. So rather than looking at how to resolve the error, finding the error becomes a challenge in itself.
And it wont help to just look at the root cause without enough context. Since every service is independent on it's own, correlating the logs, metrics, and traces of the involved services and narrowing down to the exact issue may take time and effort, more than anticipated.
This is where distributed tracing comes handy.
Common problems with Microservices

Common problems with Microservices
Loss of coherence: To fulfil a single end-user request is now broken across multiple processes, possibly written in multiple frameworks and implementation languages, it is much harder for team members to understand what exactly happened in the course of processing a request.
Unlike a monolithic process, where we could gather the complete story of how a request was handled from a single process written in a single language, we no longer have an easy way of doing that in a microservices environment.
Common problems with Microservices
Increased debugging and troubleshooting costs: The act of tracking down and fixing sources of errors inside microservice architectures can be tremendously more expensive and time-consuming.
In most cases failure data isn’t propagated in an immediately useful or clear manner inside microservices; instead of an immediately understandable stack trace, we have to work backwards from status codes and vague error messages propagated across the network.
Common problems with Microservices
Data silos and cross-team communication: Given that one request has to. make multiple hops over the network and has to be handled by multiple.
Processes developed by independent teams, figuring out exactly where an error occurred and whose responsibility it is to fix can become an exercise in. futility and frustration.
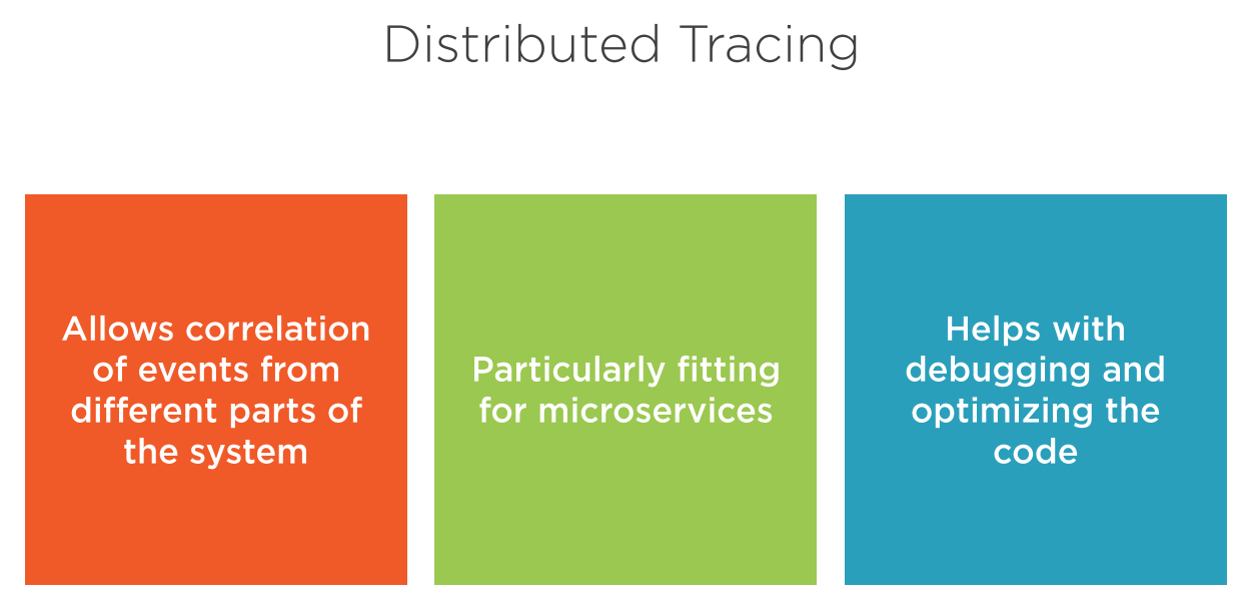
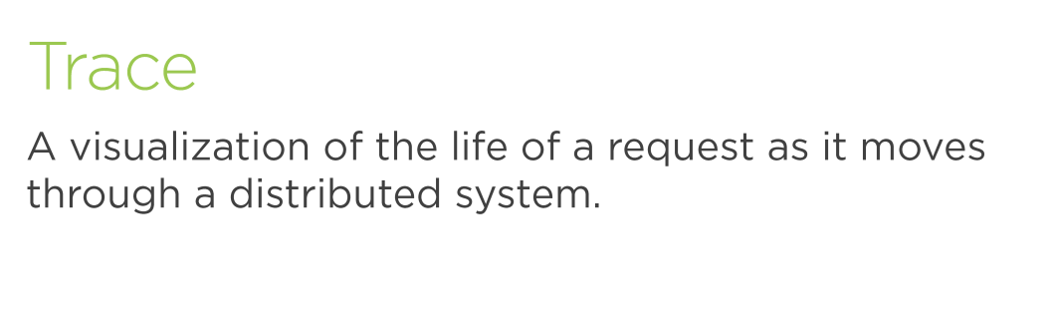
Distributed Tracing
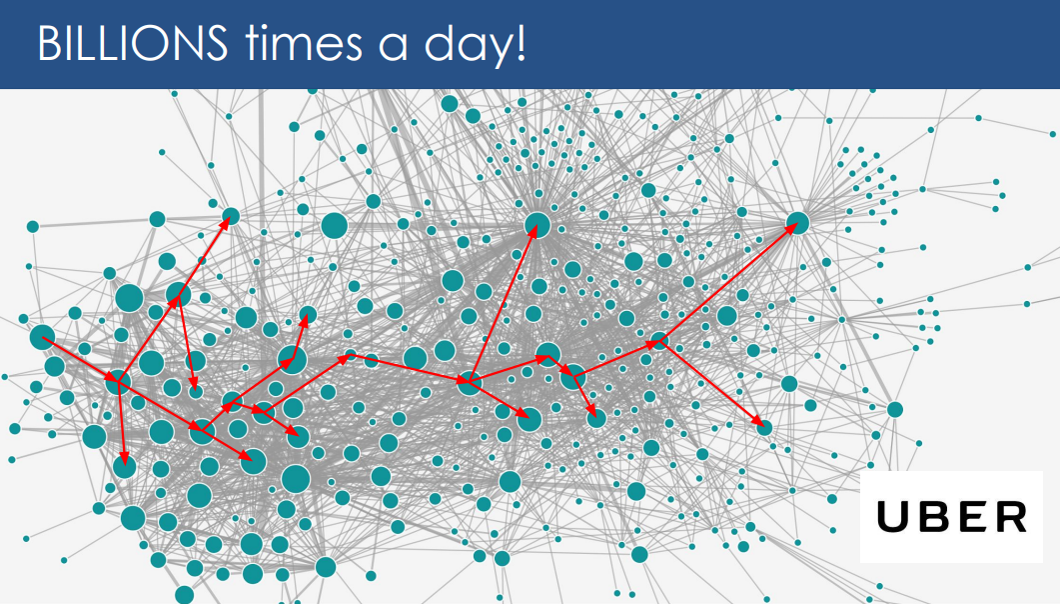
Distributed Tracing is the process of tracking and analyzing what happens to a request (transaction) across all services it touches.
What does "tracking" and "analyzing" mean?
"Tracking" means generating the raw data in each service that says, “I did some processing for a request with a Trace ID abc123 — here's what I did, what other services I talked to, and how long each chunk of work took."
"Analyzing" means using any of the various searching, aggregation, visualization, and other analysis tools that help you make sense of the raw tracking data.
Distributed tracing describes the act of following a transaction through all participating applications (tiers) and sub-systems, such as databases.
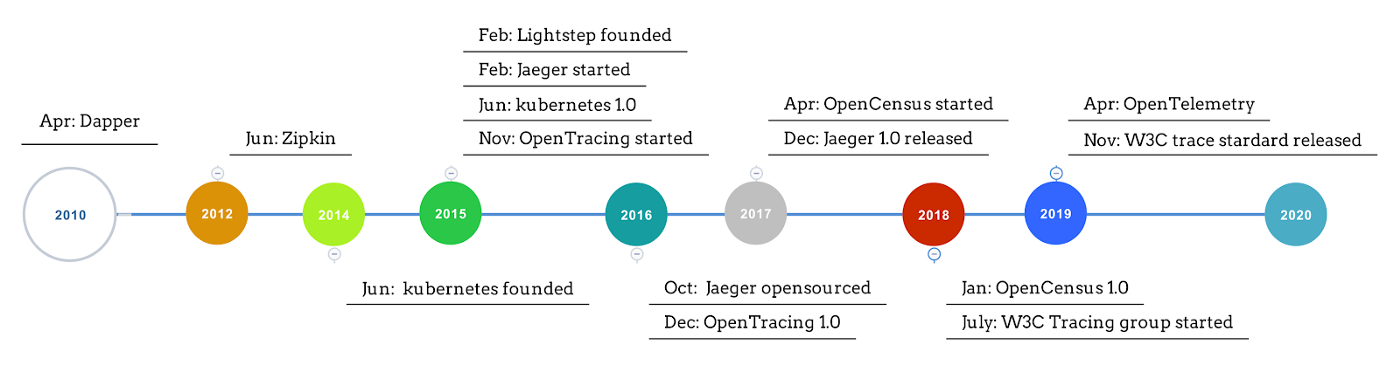
Evolution of Distributed Tracing
Expectations from Distributed Tracing
Few of the critical questions that DT can answer quickly and easily in a distributed system architecture:
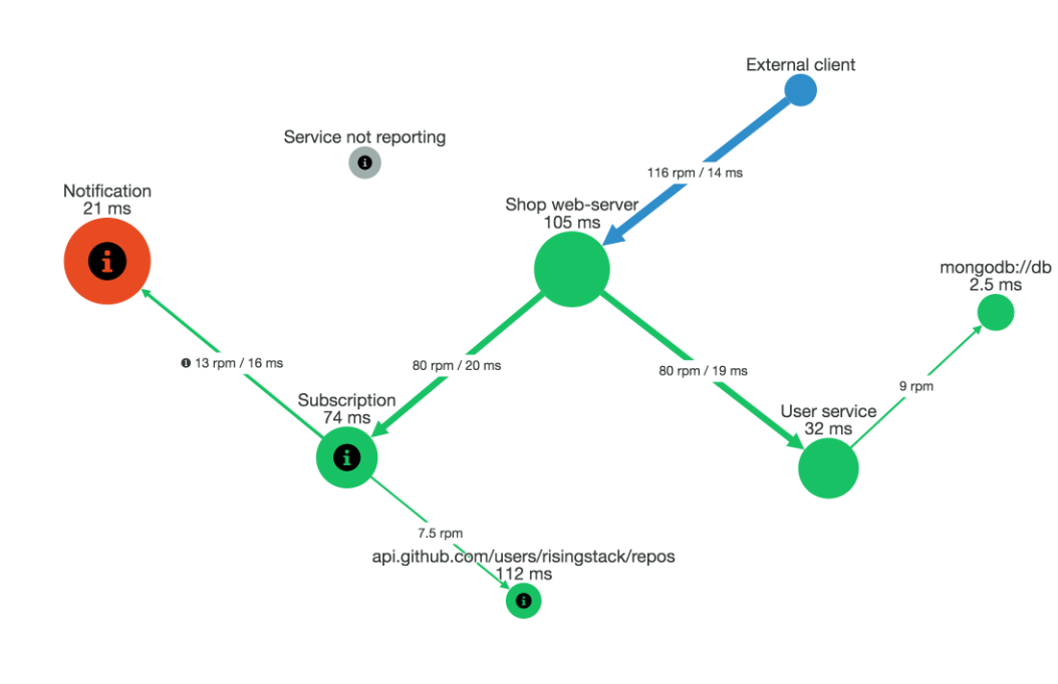
What services did a request pass through? Both for individual requests and for the distributed architecture as a whole (service maps).
Where are the bottlenecks? How long did each hop take? Again, DT answers this for individual requests and helps point out general patterns and intermittent anomalies between services in aggregate.
How much time is lost due to network lag during communication between services (as opposed to in-service work)?
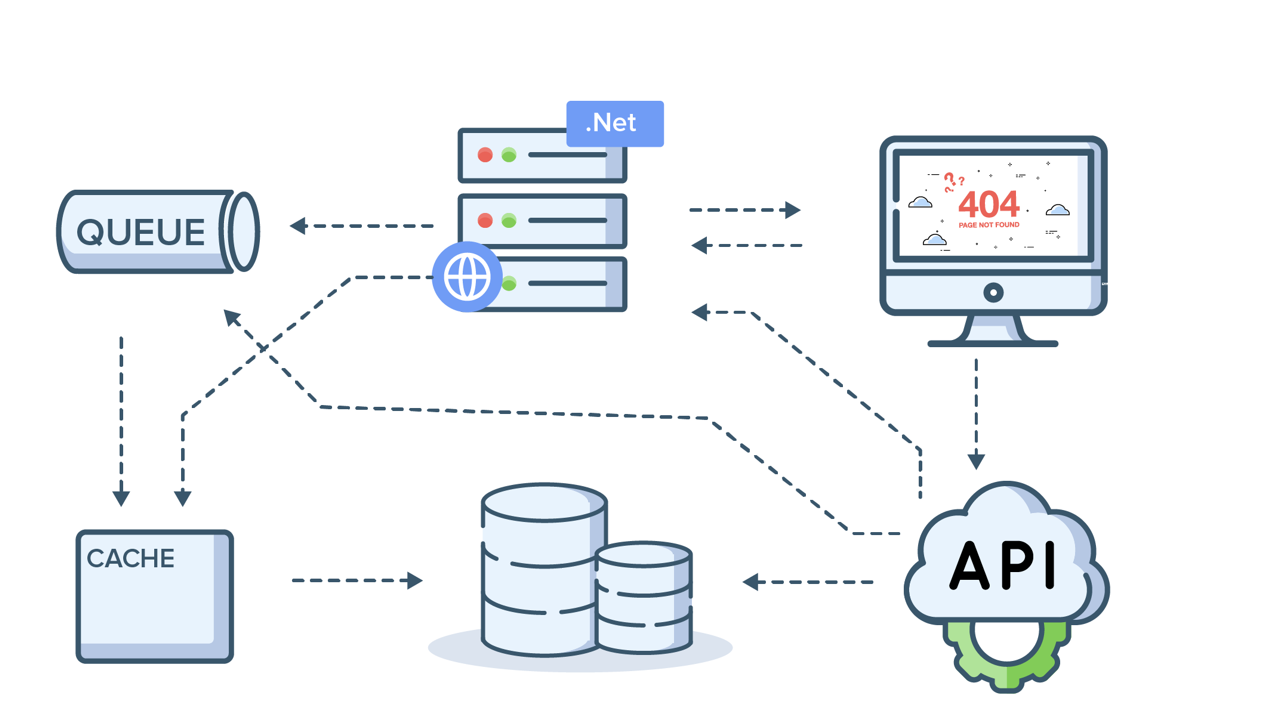
Key components of tracing system
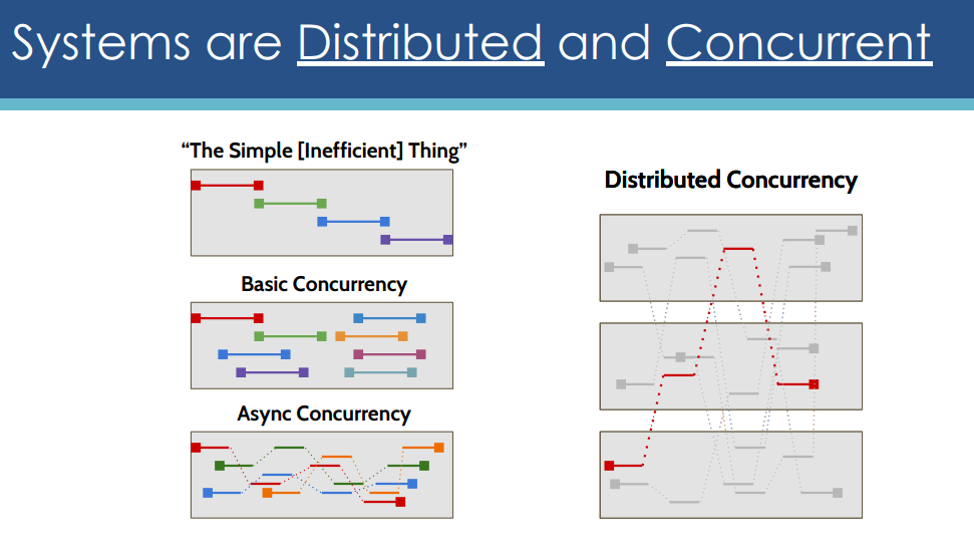
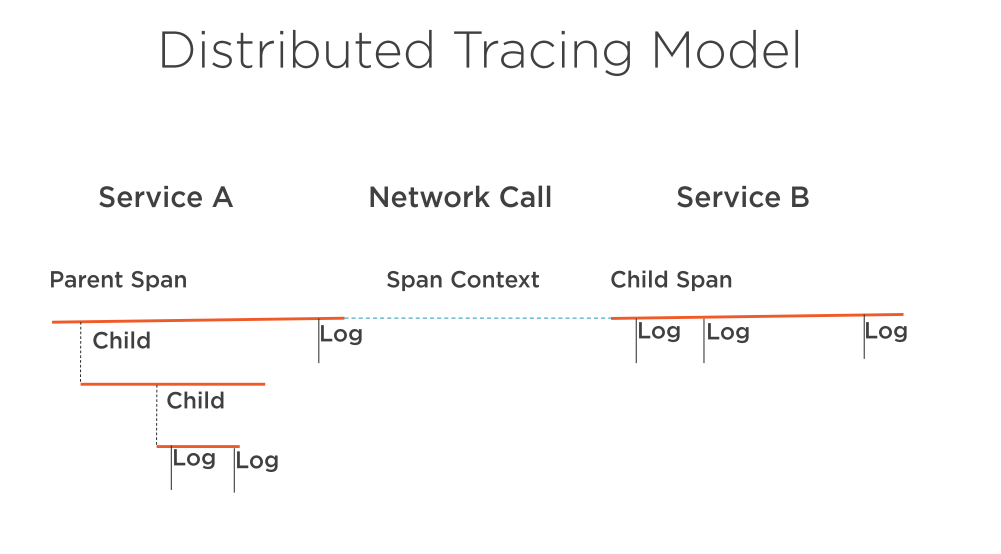
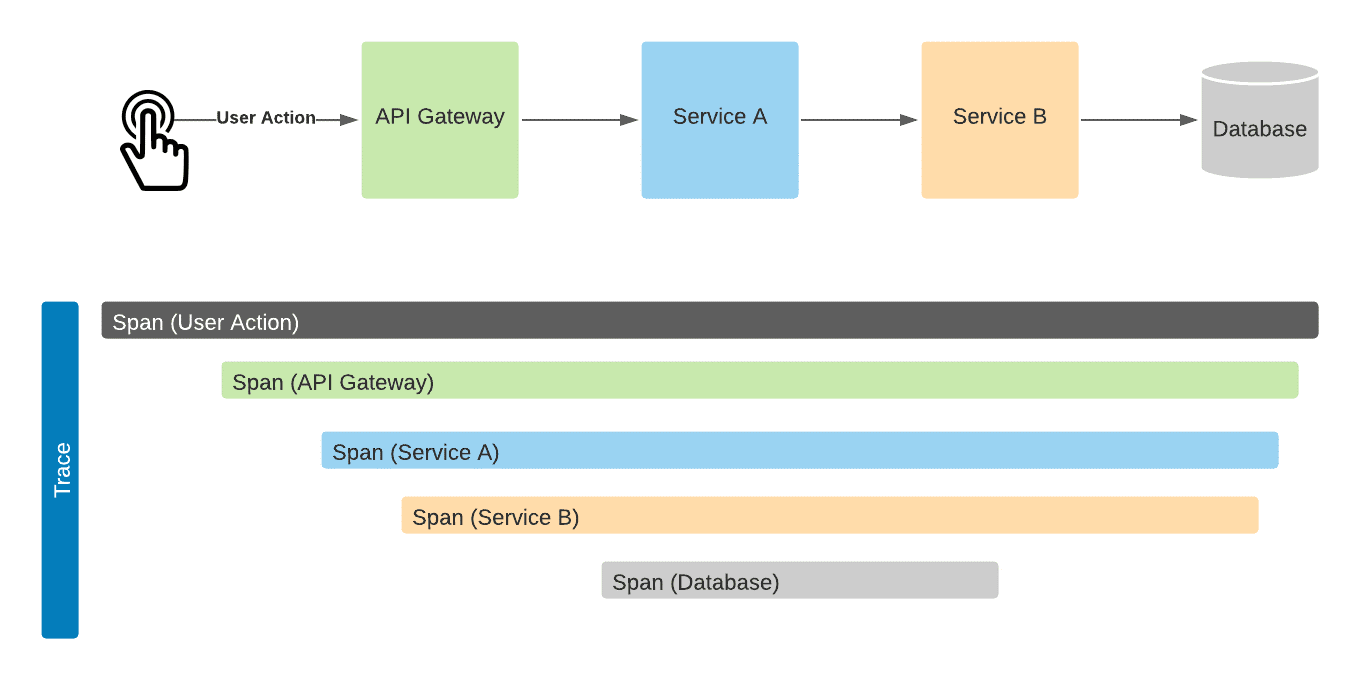
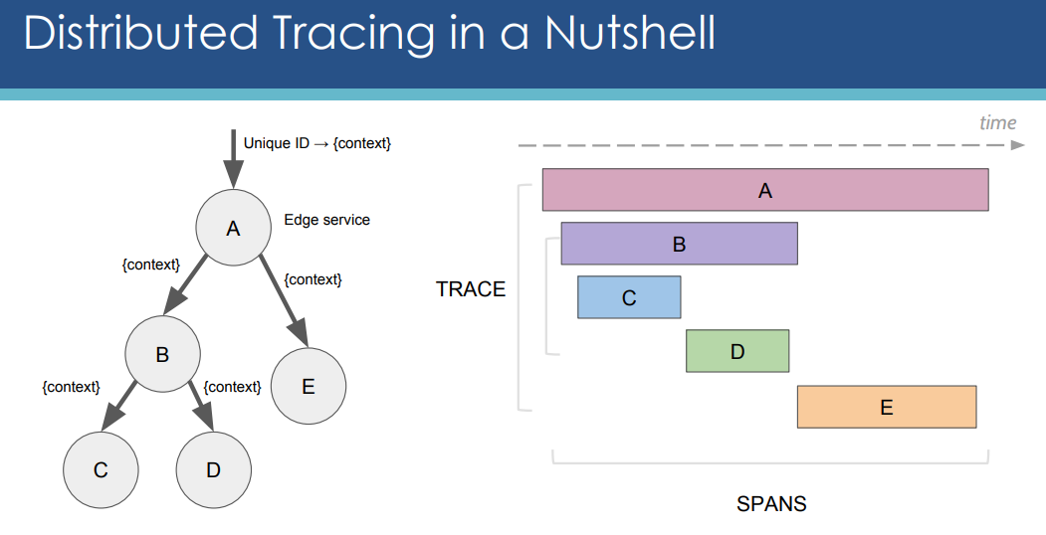
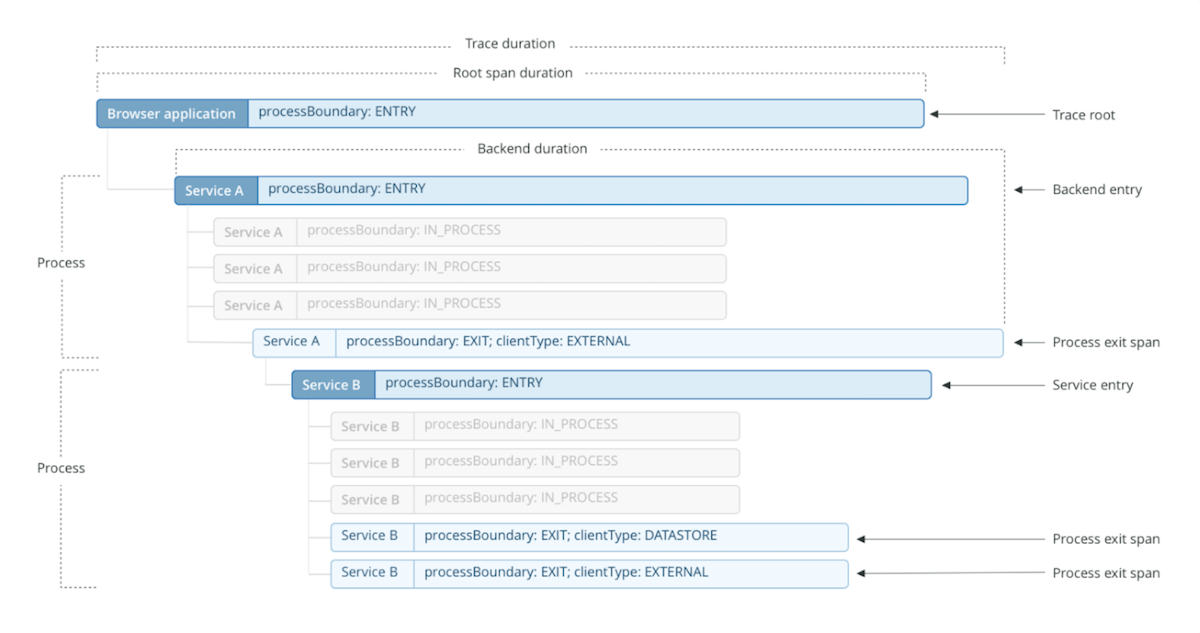
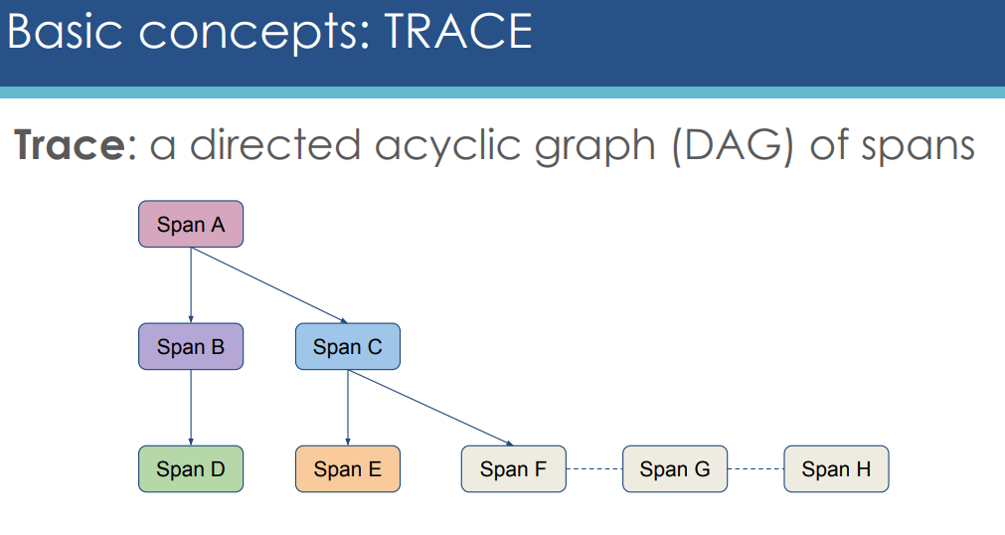
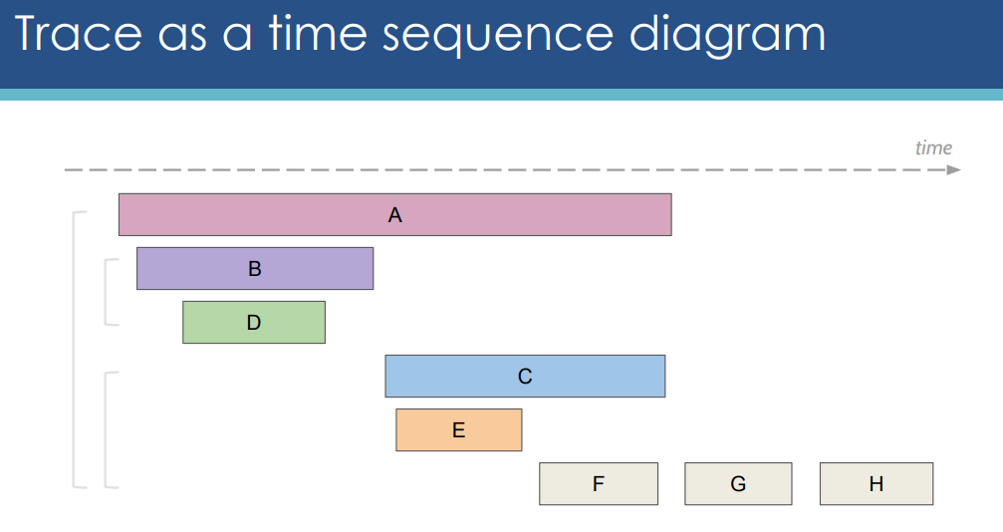
In order to discuss the core concepts for how distributed tracing works, we first need to define some common nomenclature and explain the anatomy of a trace. Lets take reference of the Google Dapper paper, so the main entities are Trace and Span. Note that distributed tracing has been around for a long time, so if you research DT you might find other tools and schemes that use different names. The concepts, however, are usually very similar:
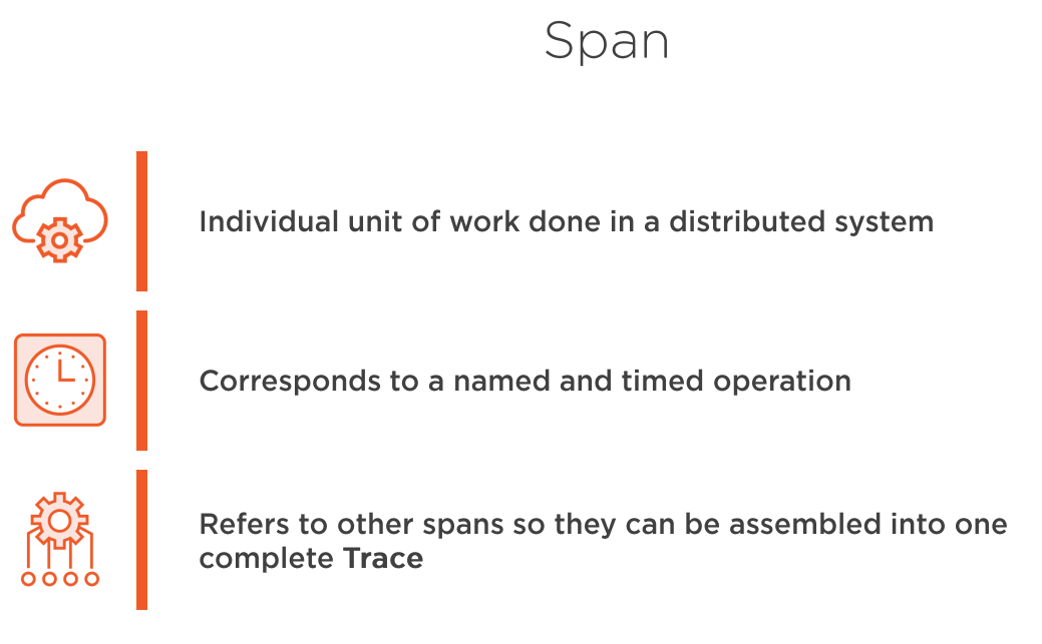
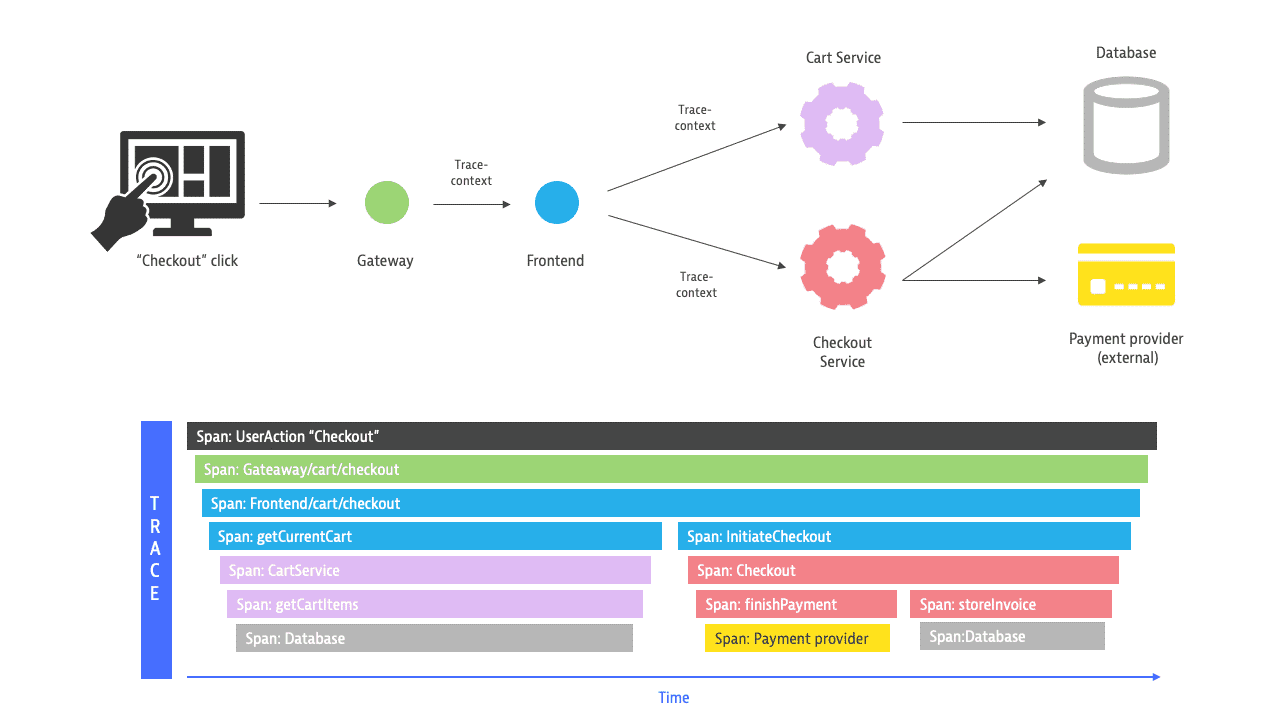
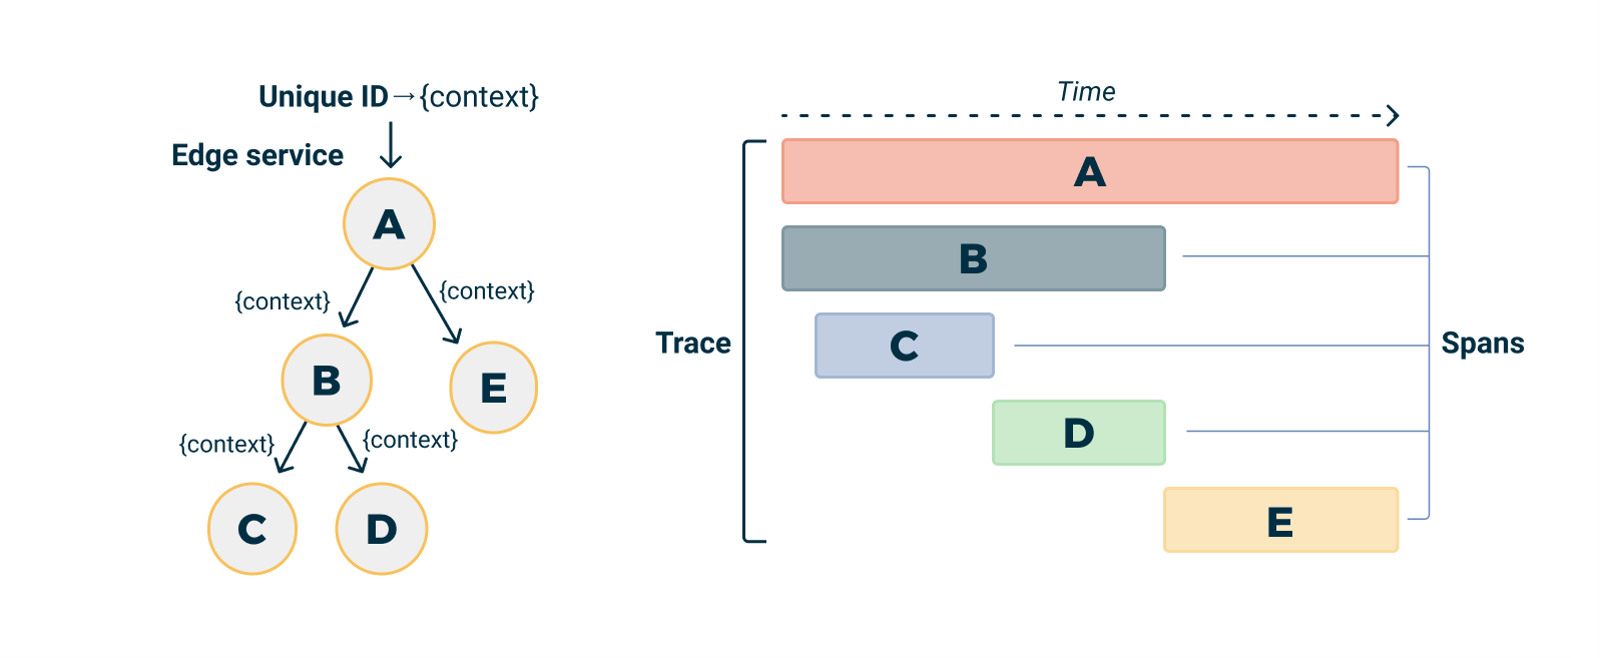
- Trace exposes the execution path through a distributed system. Trace is composed of one or more spans.
- Span in the trace represents one microservice in the execution path.
- Request is how applications, microservices, and functions talk to one another.
- Root span is the first span in a trace.
- Child span is a subsequent span, which can be nested.
How Distributed Tracing Works?
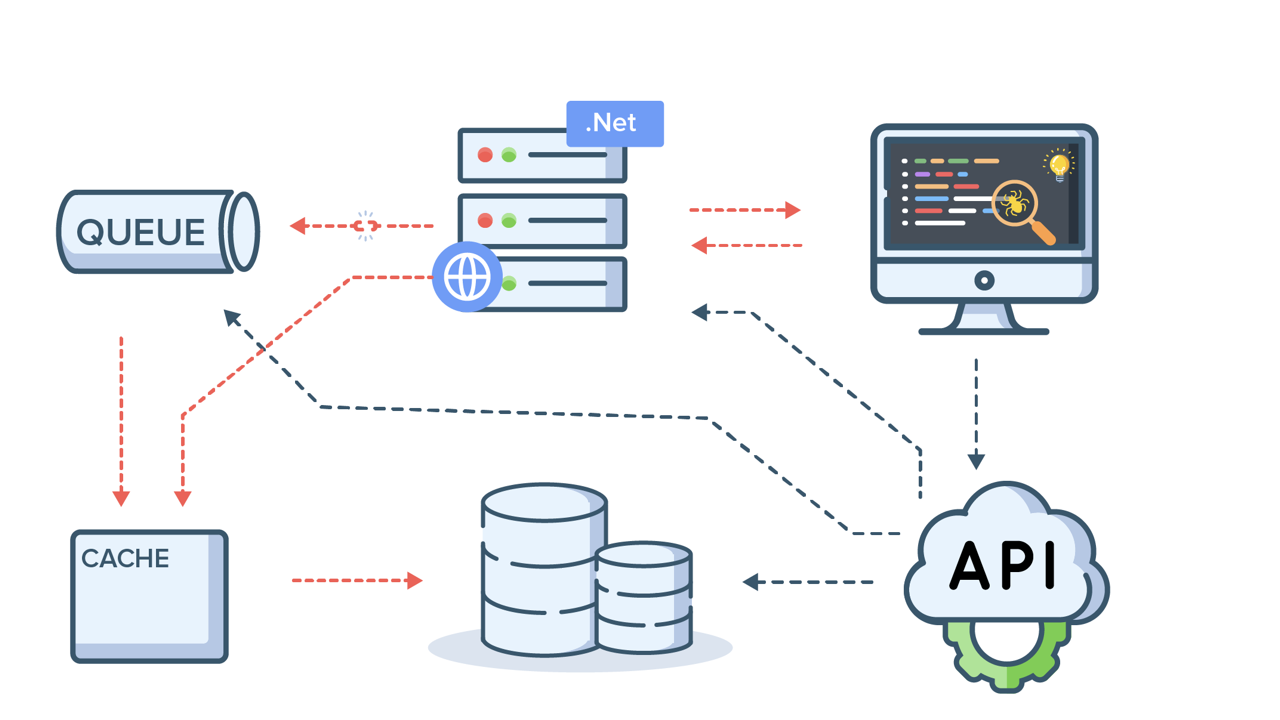
Distributed tracing enables you to identify the exact line of occurrence of a error in a complex architecture. With distributed tracing, the application transactions are captured using request and response headers.
A trace header gets added from the original request to subsequent requests and thus creating a link through out the entire transaction that can be traced back to the origin.
trace context
We now know that a set of spans forms a trace. But how is this relationship represented? All systems that support distributed tracing use some identifiers,the trace context, that is passed along with the transaction. For HTTP this means that at least a trace ID is injected into the header of outbound requests and extracted from the header of inbound requests.
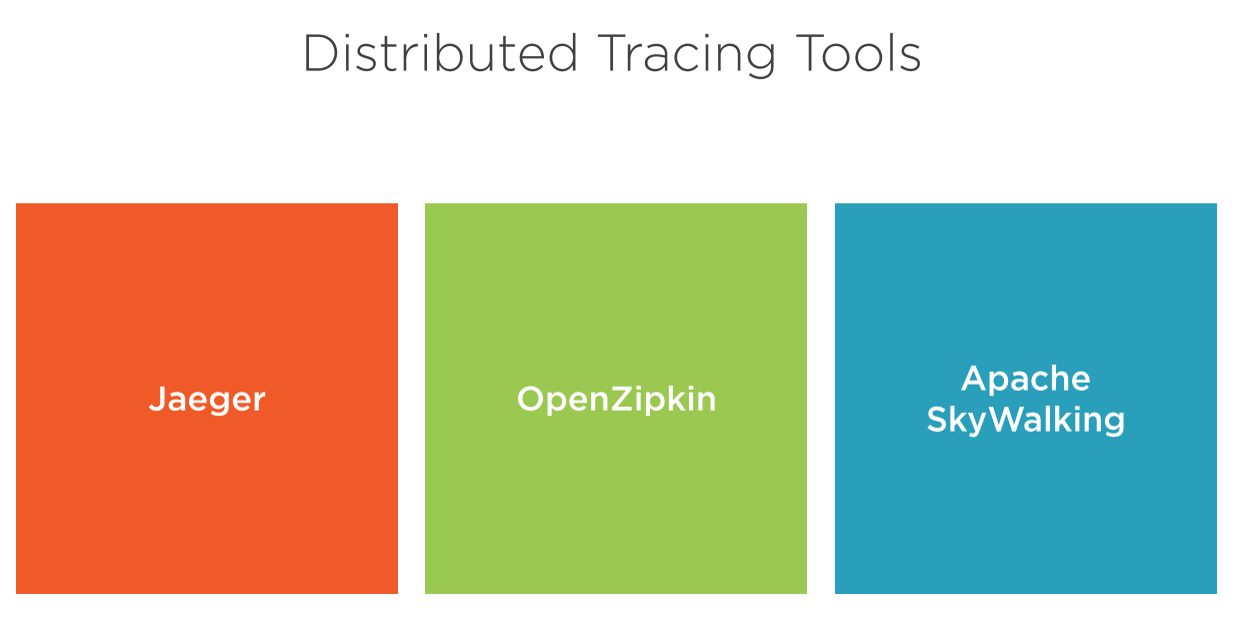
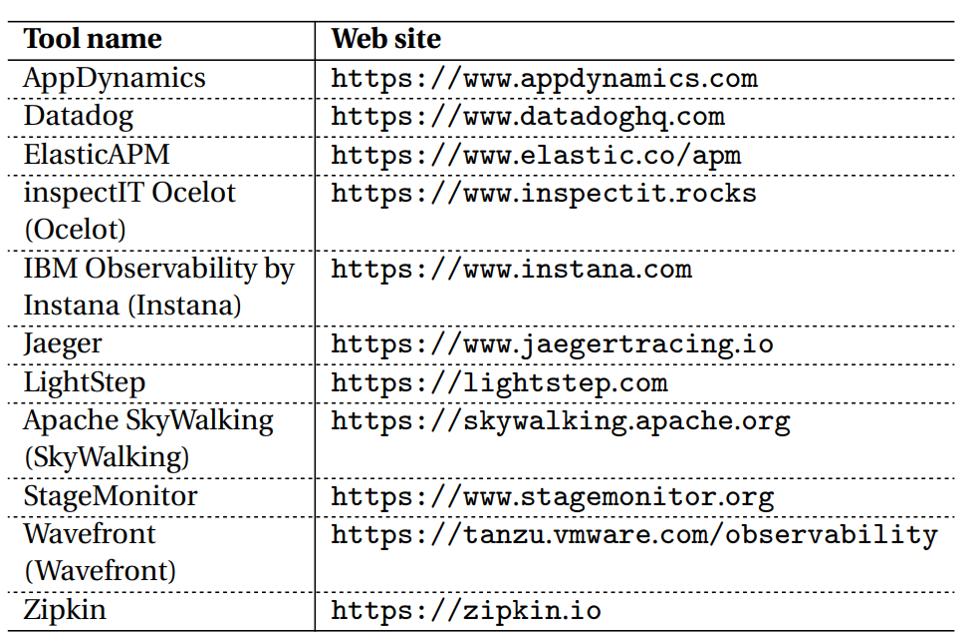
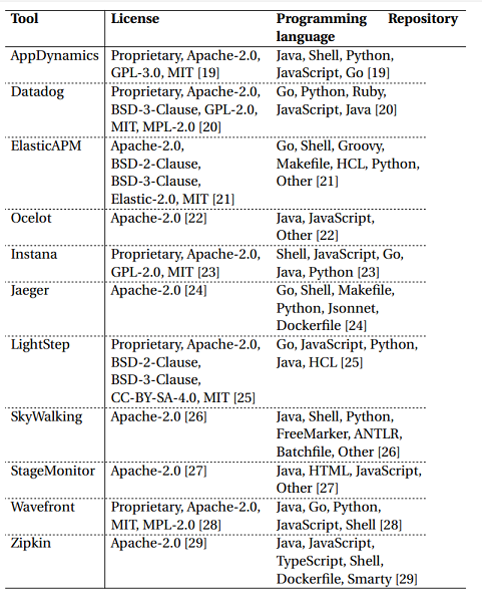
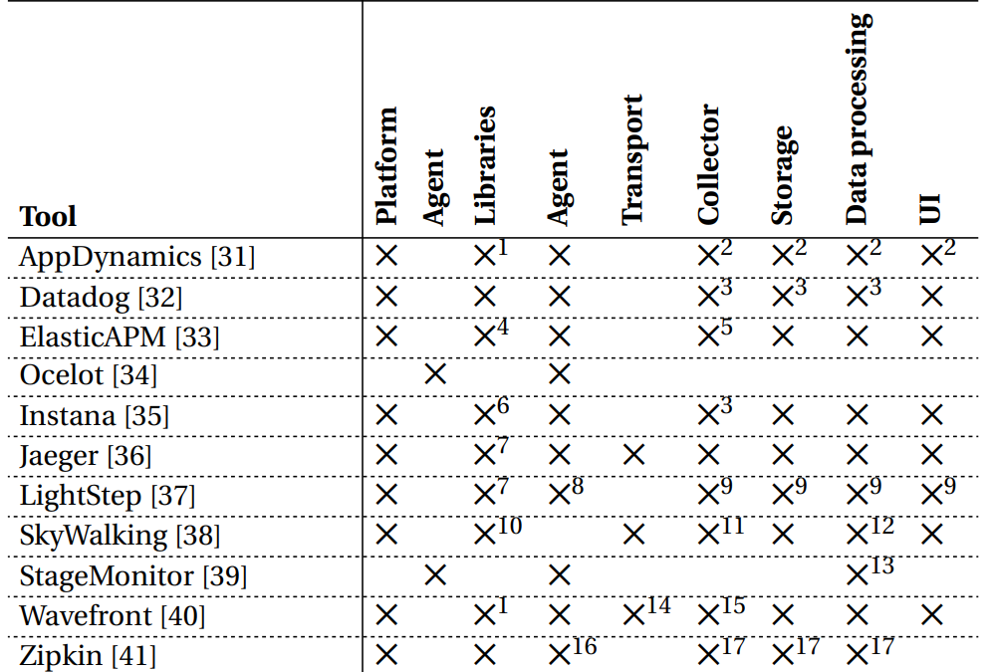
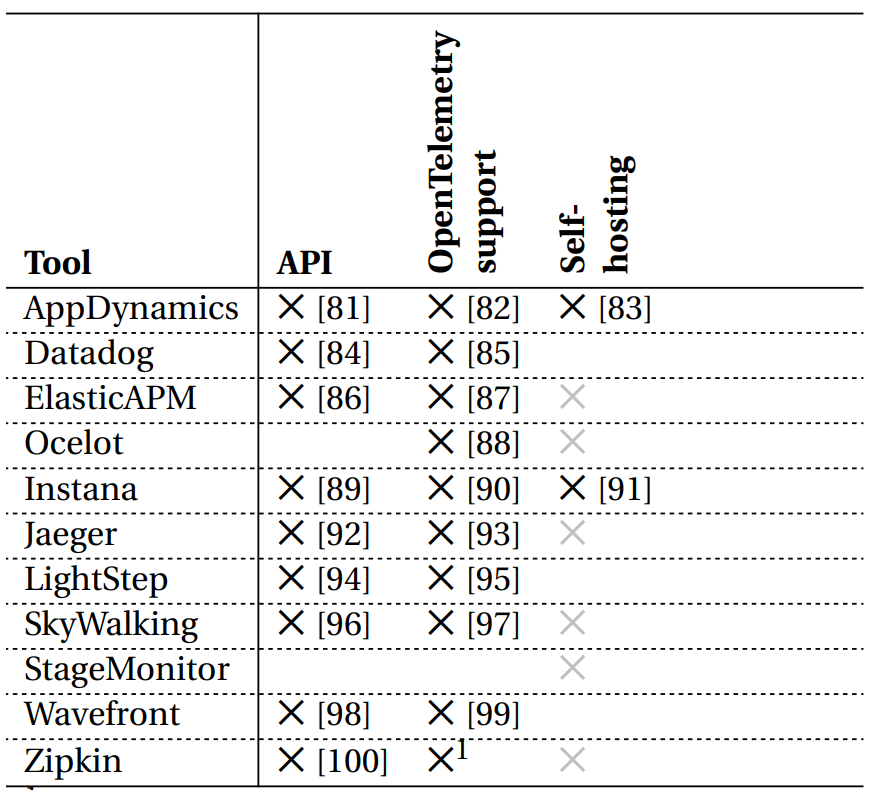
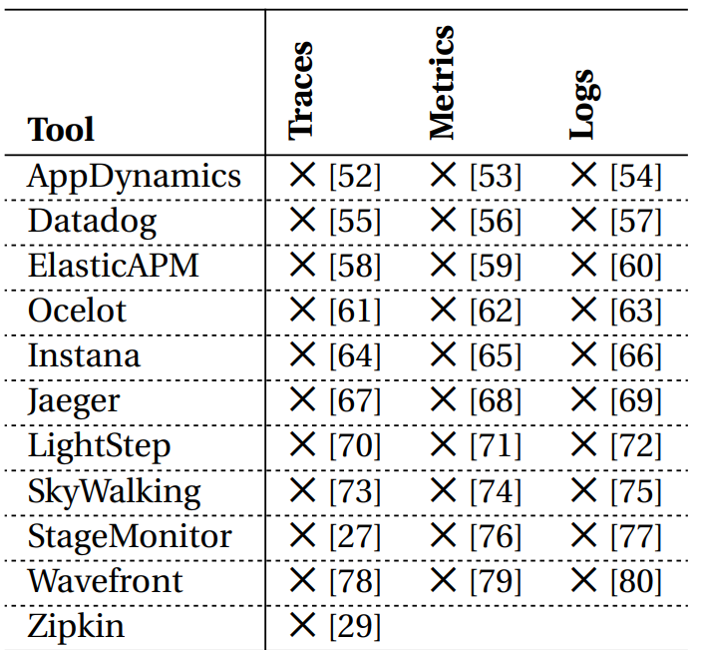
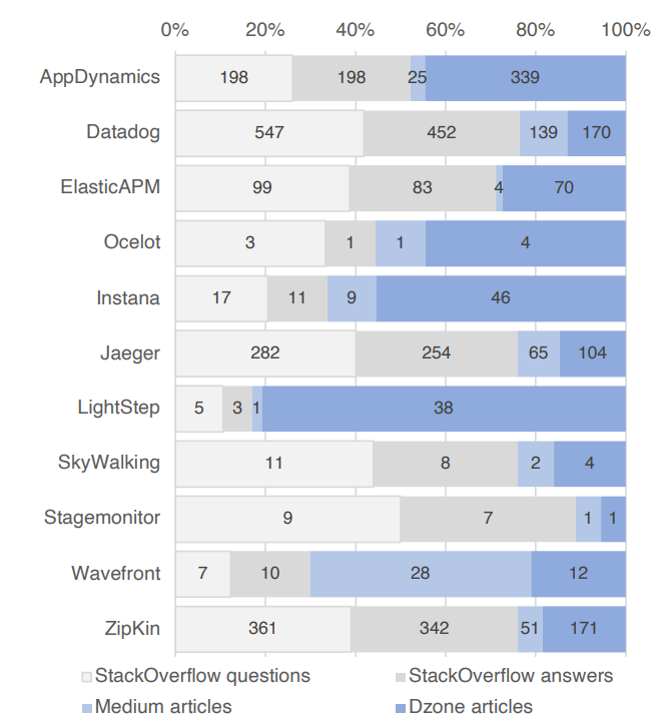
Tools for Distributed Tracing
There is a wide range of frameworks, libraries, and tools out there, both open-source and commercial that try to solve issues related to Distributed Tracing.
Some of the popular tracing tools are (open-source)
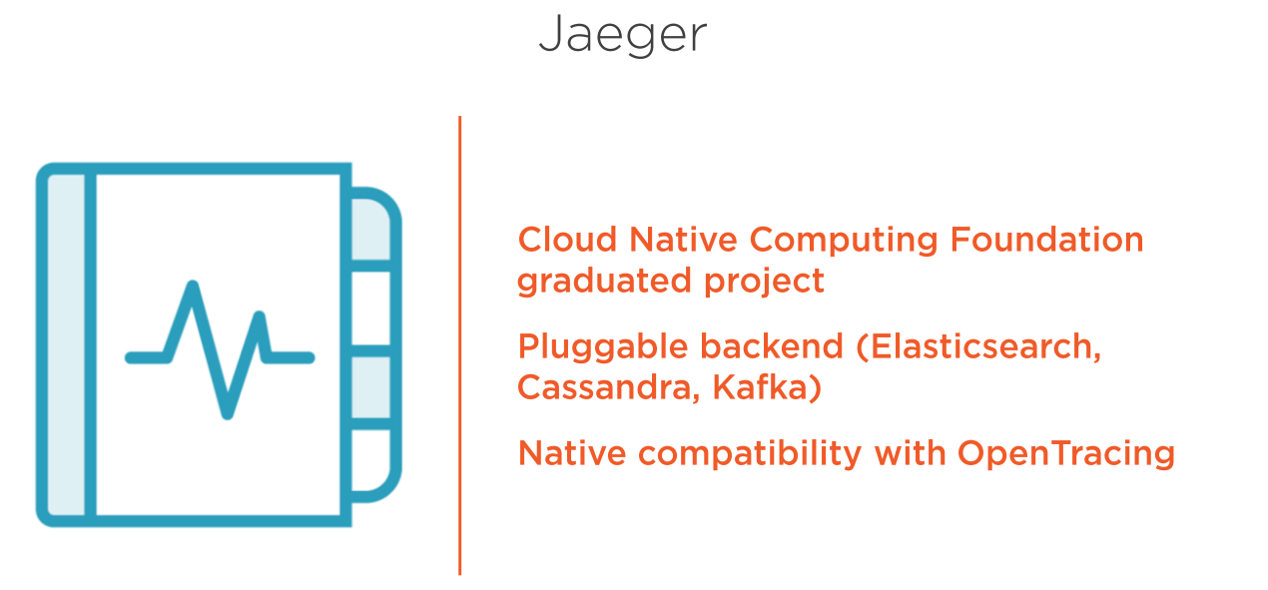
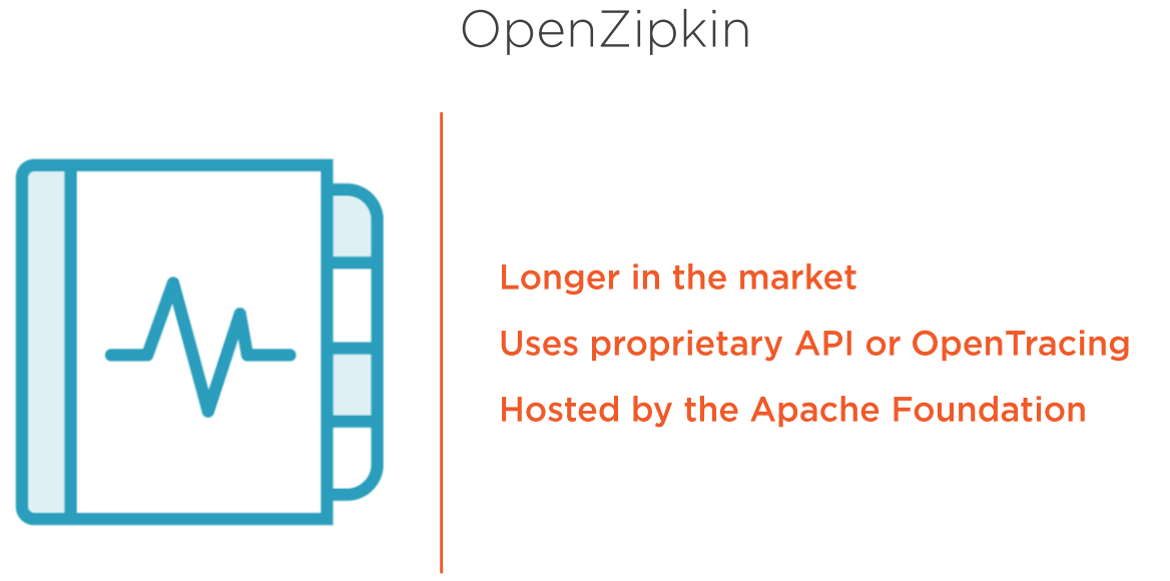
- Zipkin,
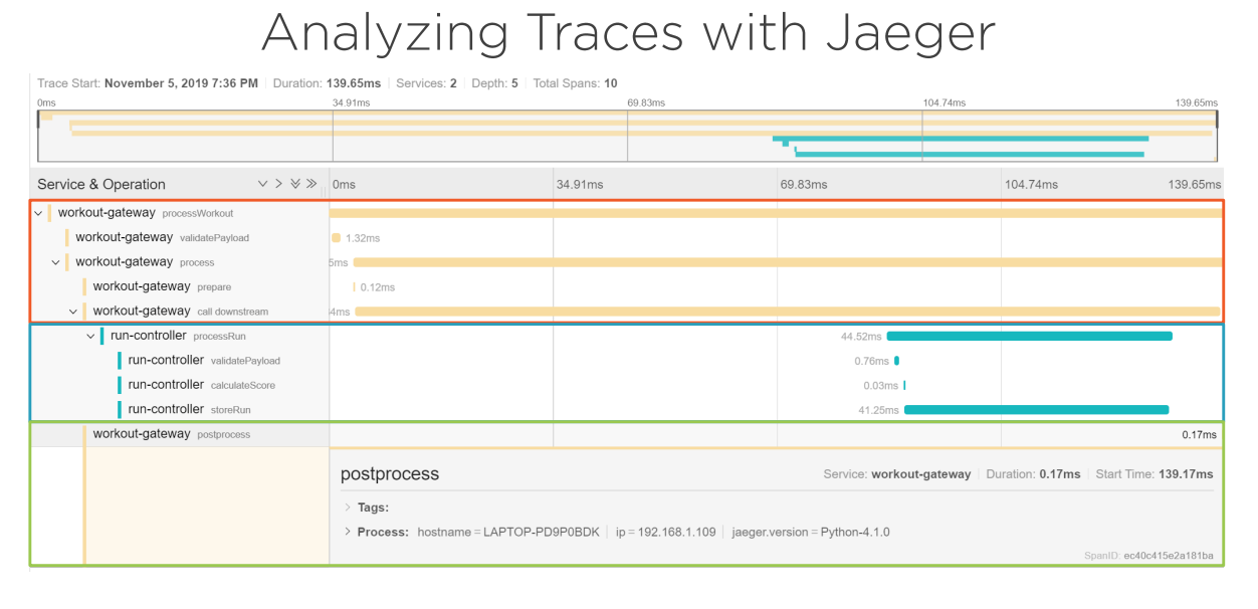
- Jaeger
Some of the popular tracing tools are (Commercial)
- Wavefront,
- Datadog,
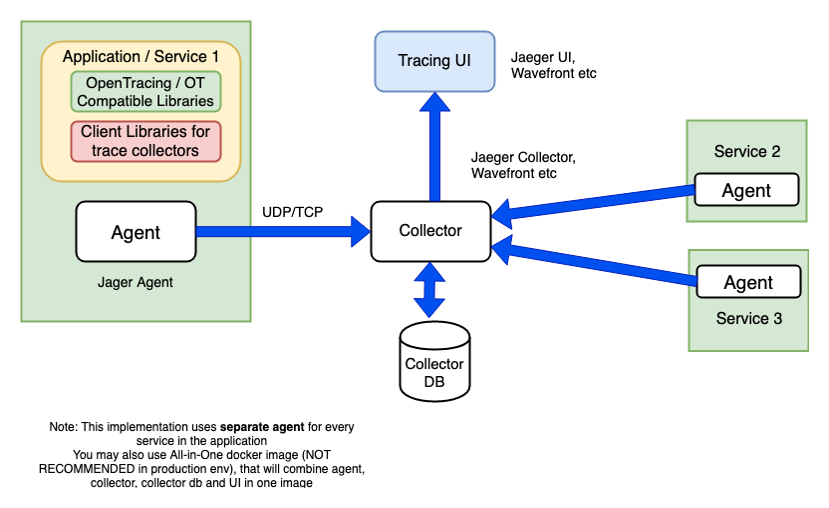
All of these have an agent (with services or as a sidecar), collector, and UI.
Use Cases
With a hierarchy of traces configured in your app, many debugging scenarios are made much simpler. Some example of these include:
- A distributed system has intermittent performance issues. The distributed traces can show timing information that can be examined to pinpoint the issue. N+1 database requests or a particularly slow API will immediately become apparent.
- A daily batch job is executed, how is it performing? With operations logged in the way described above, it is easy to understand how long jobs take to run? How many messages are processed each day?
- A request involves multiple resources. With the distributed trace, you can see all the child operations and understand how the request was fulfilled.
Using any of these tools and their specific components results in vendor lock-in, making it harder for developers to work because not all vendors have the same support across different frameworks and libraries.
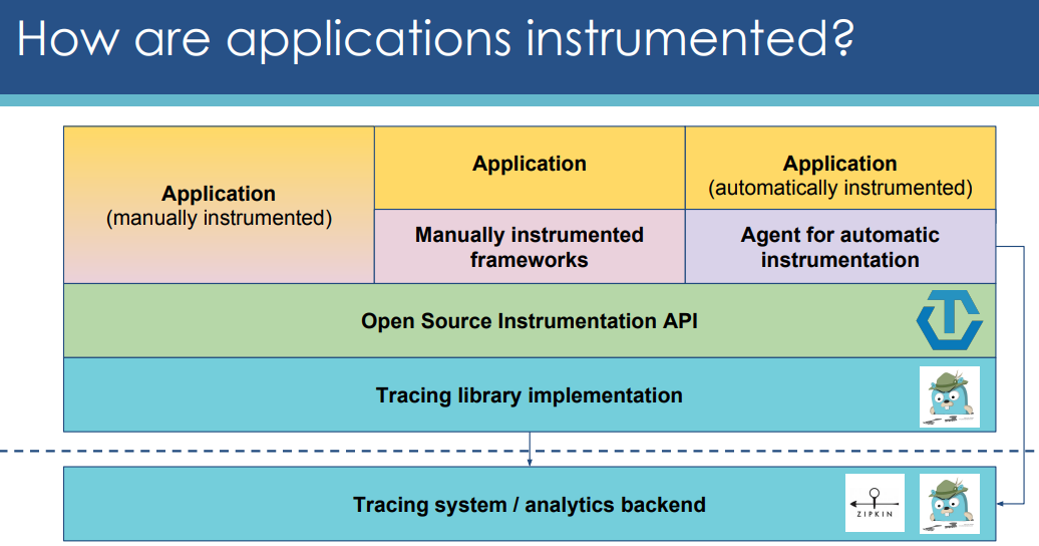
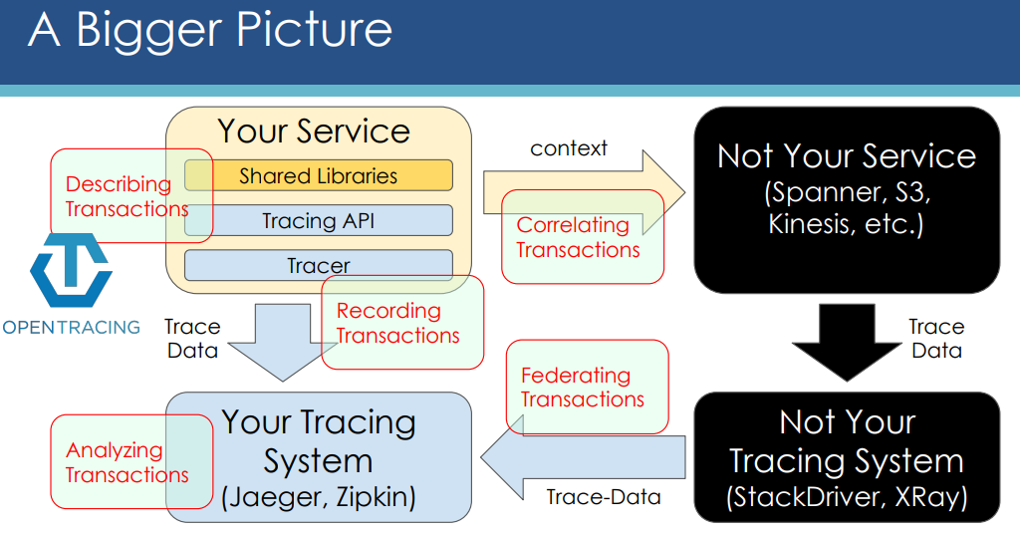
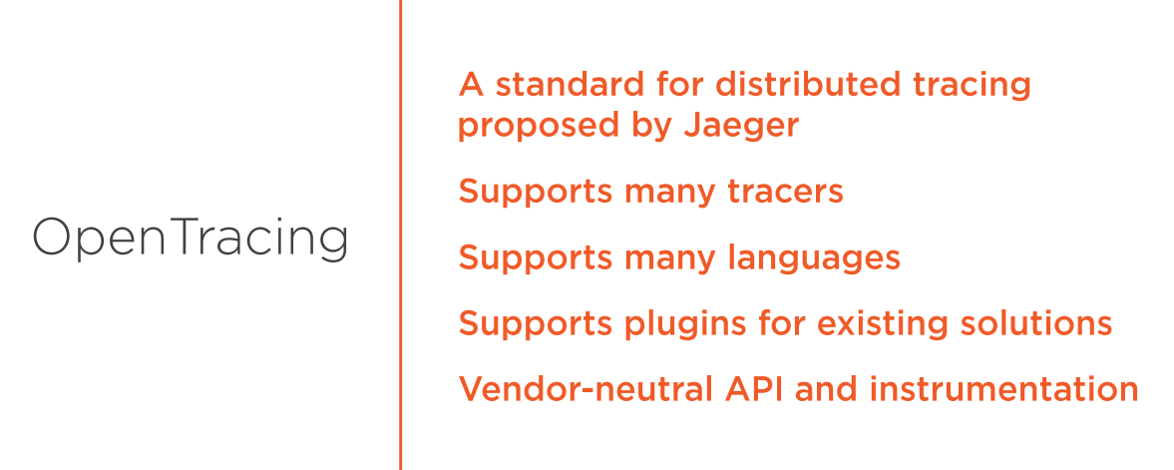
To solve this problem, OpenTracing and OpenCensus projects were started. They provide what other frameworks and libraries can implement. This enables developers to add instrumentation to their application code that won't lock them into any particular vendor. This low coupling, along with easy-to-use Interfaces, makes these two projects very attractive.
Open Tracing
An Open Standard for Distributed Tracing
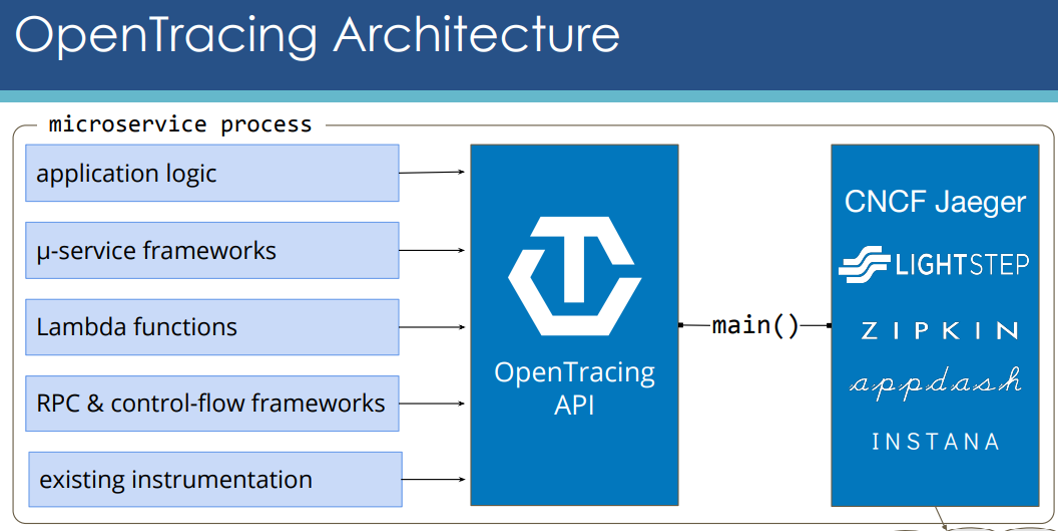
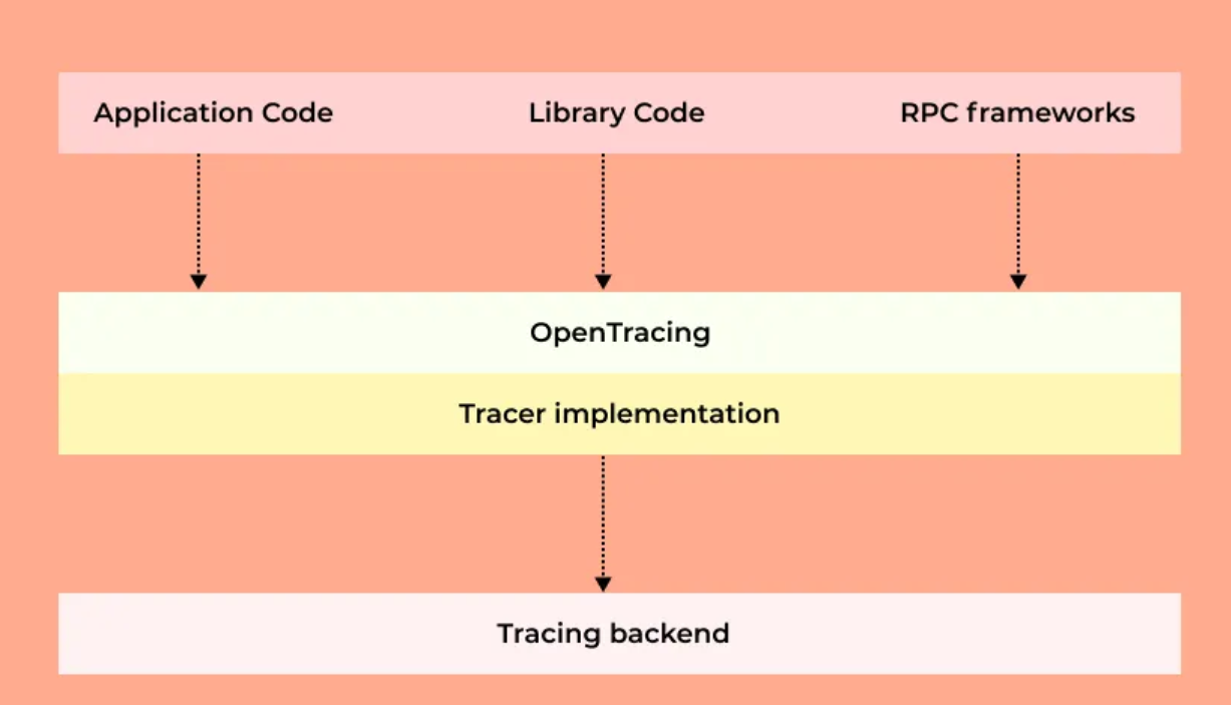
Architecture
Concepts and Terminology
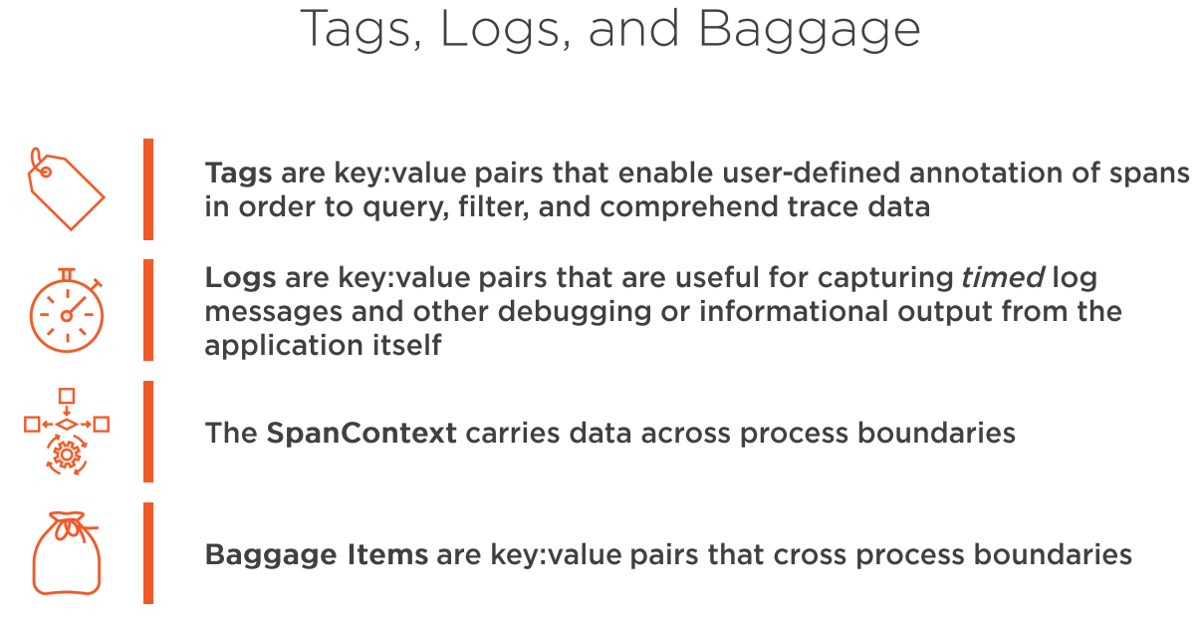
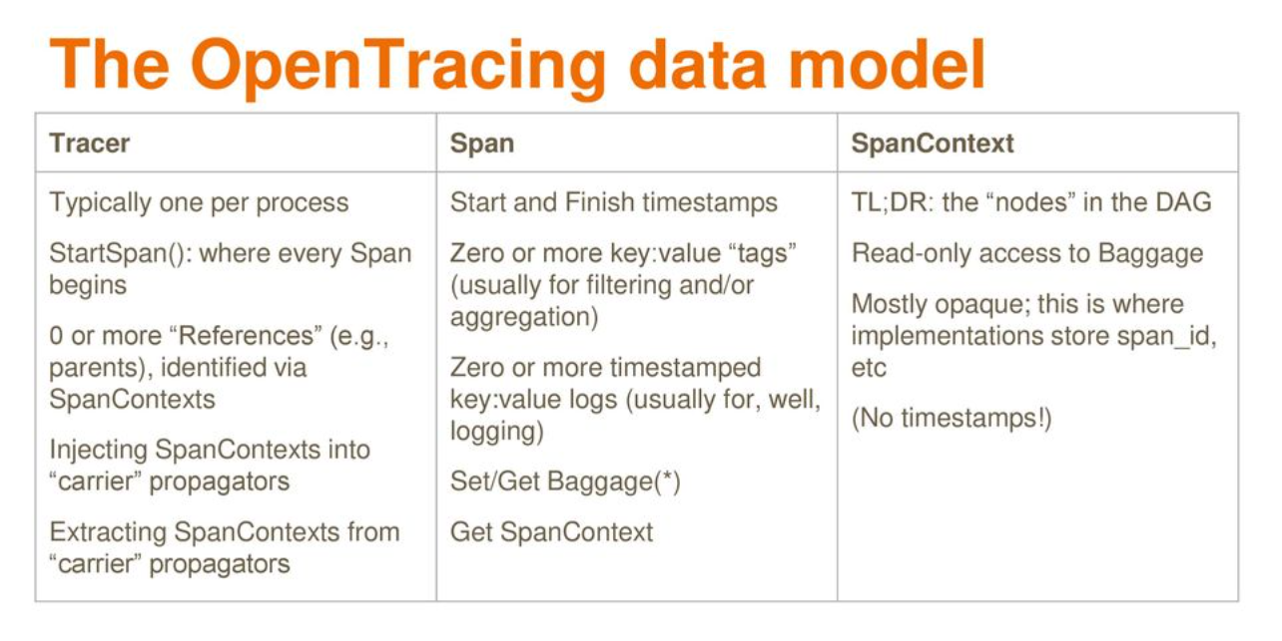
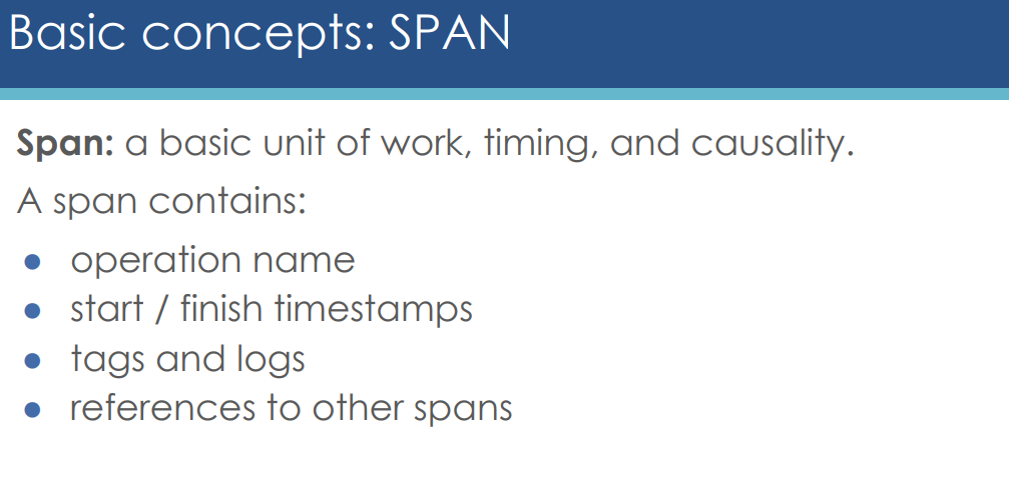
- Span — Span is the building block of a trace. In general, you need to have at least one span created for a particular request path within your service. A span contains the following information:
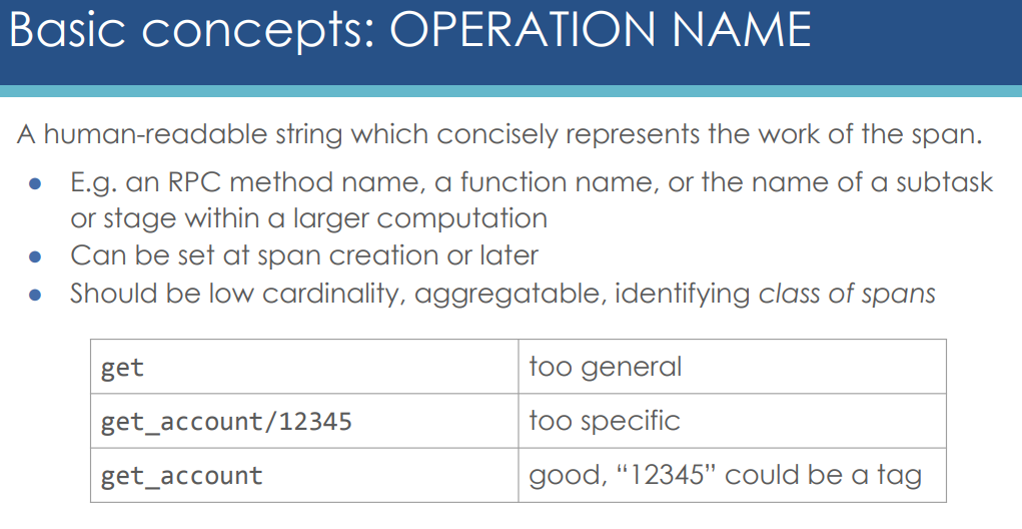
a. Operation Name — Identifier for an operation being performed when the span starts.
b. Start and Finish Timestamp
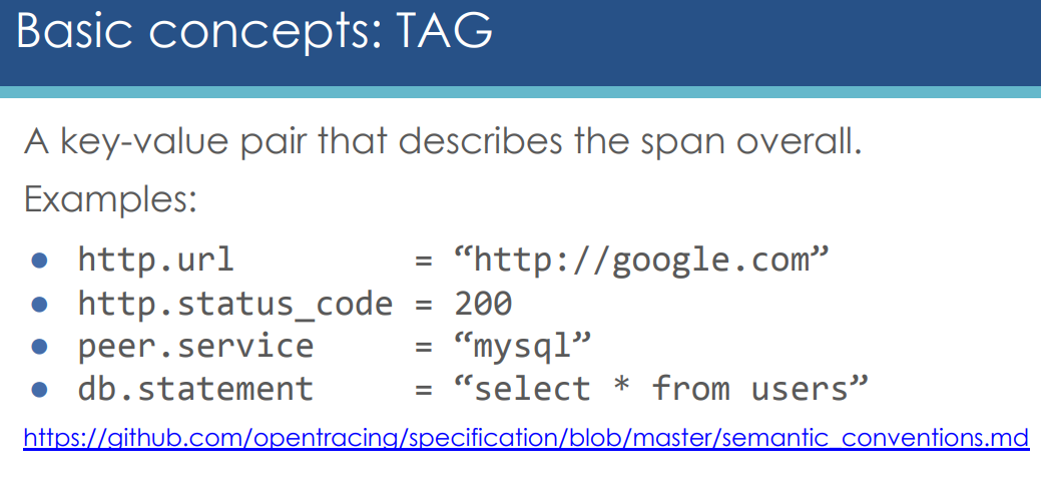
c. Key-Value Span Tags — These are user-defined key-value pairs that make querying or filtering data easier. They should be used across the entire span (i.e. http.status_code, user.id, db.instance, etc.).
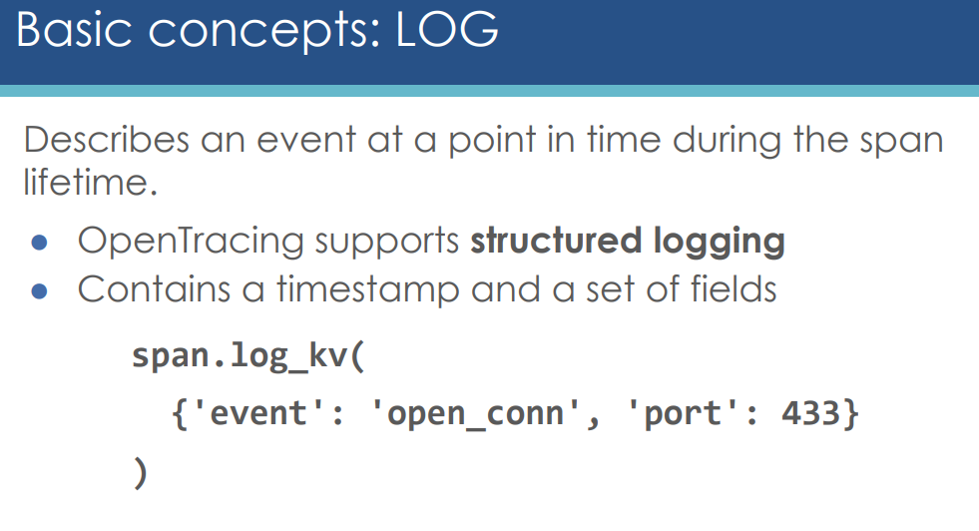
d. Key-Value Span Logs — These are useful for capturing logging messages. They should be used to capture only a specific event within the span. (Use Tags when they should be used across the whole span).
e. Span Context — This is one of the most important states in a span. Span Context carries the data across process boundaries. It has two major components.
i. Tracer's spanID or traceID
ii. Baggage items — like key-value pairs mentioned above.
Concepts and Terminology
- Span — Span is the building block of a trace. In general, you need to have at least one span created for a particular request path within your service. A span contains the following information:
- Trace — It crosses the boundaries of processes and tracks a request end-to-end.
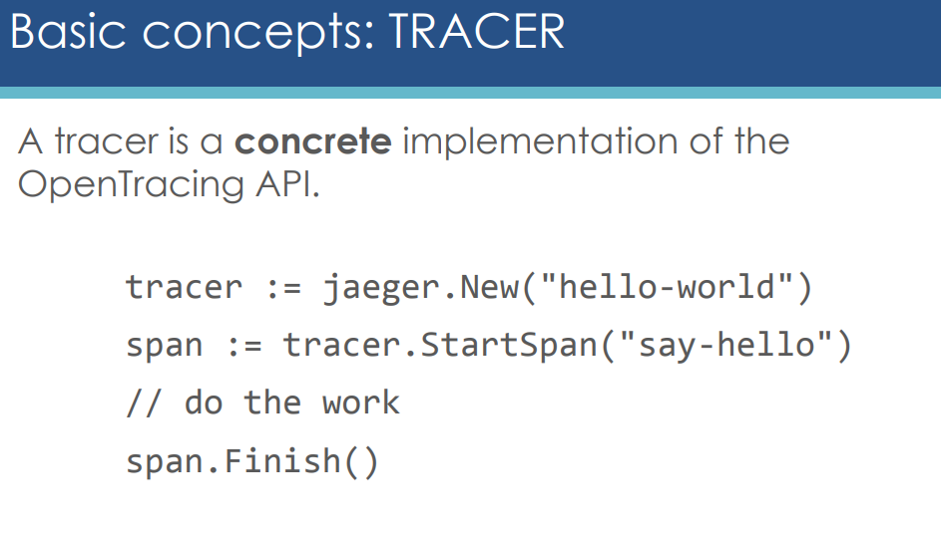
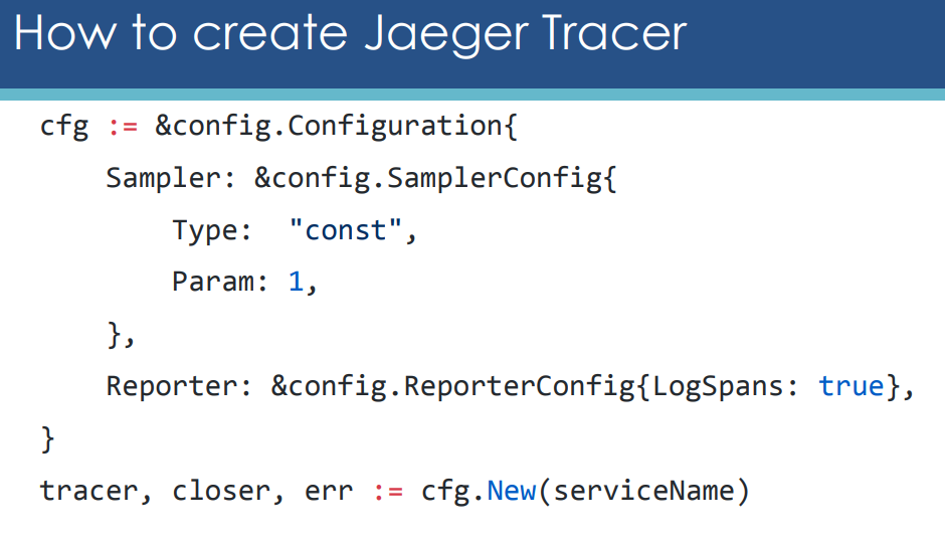
- Tracer— It is the actual implementation that records the Spans. This can be either Jaeger, Zipkin, Wavefront, or Datadog. Once the tracer is instantiated, it can be used to create new spans.
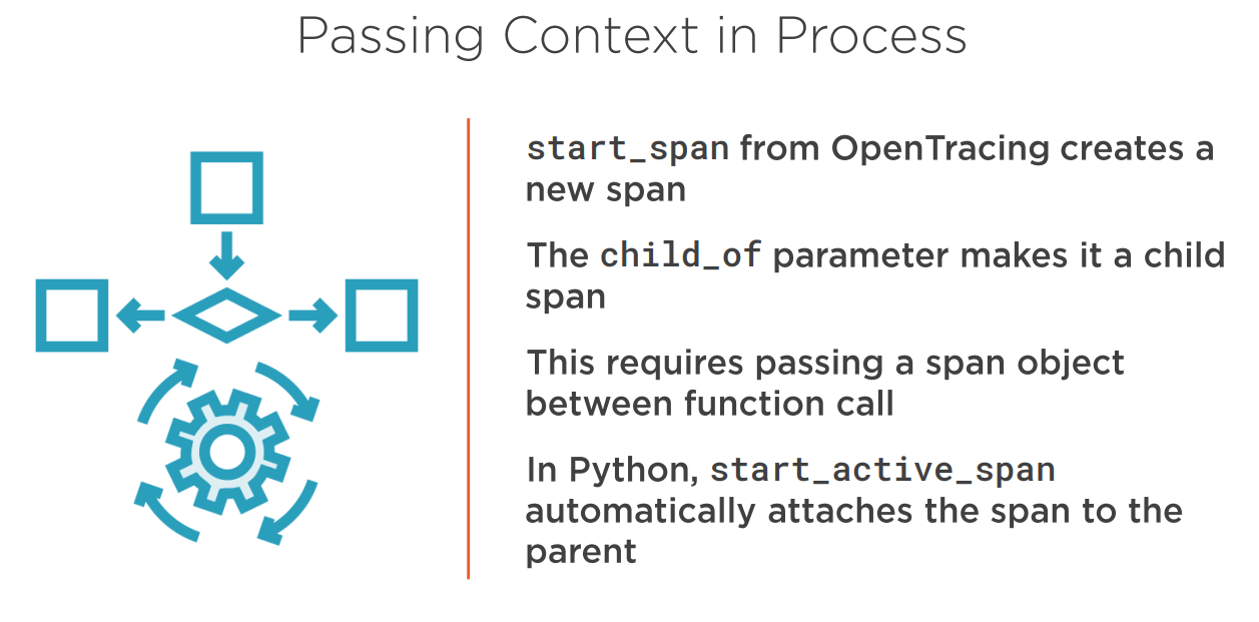
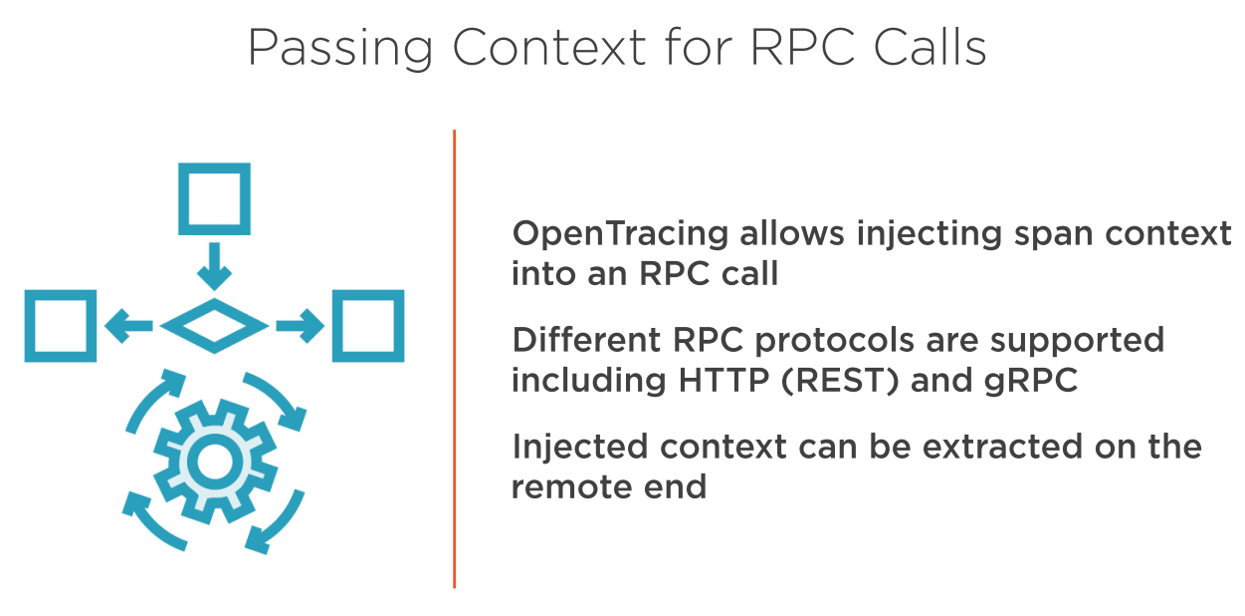
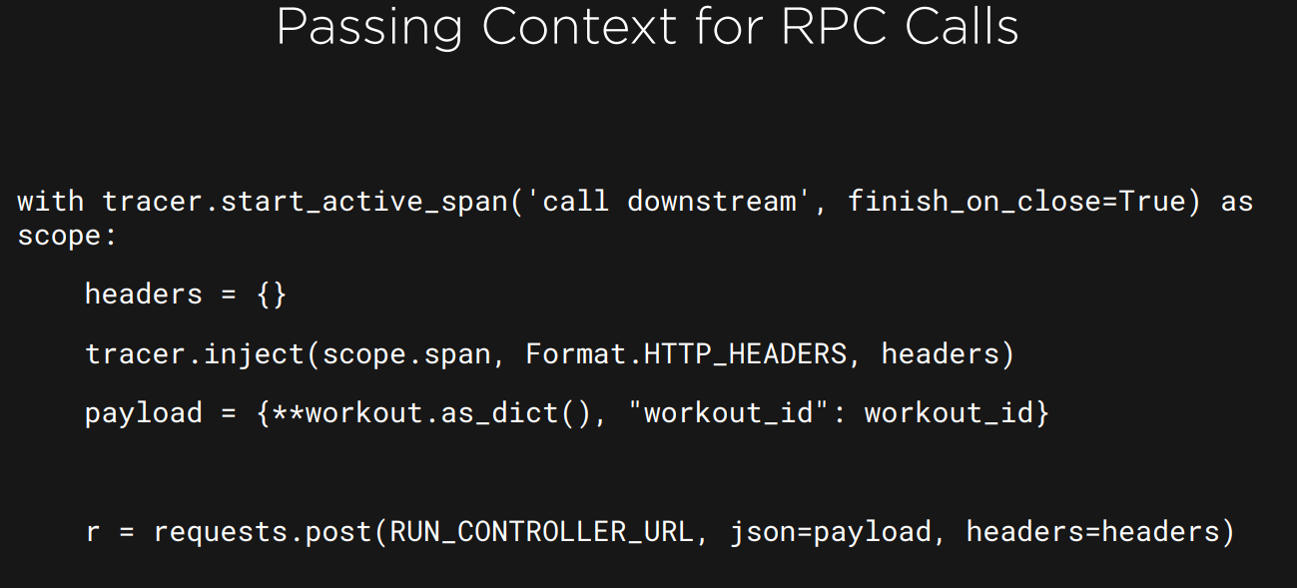
- Inject/Extract — These are some of the important methods available with any tracing specification:
i. inject method — This allows the context to be added into the request that is carried across the process boundaries.
ii. extract method — This obtains the Span Context from the request. This context can be used to create a new span, which is a ChildOf current span. It can also FollowFrom the current span. If no context is found, then a new span is started.
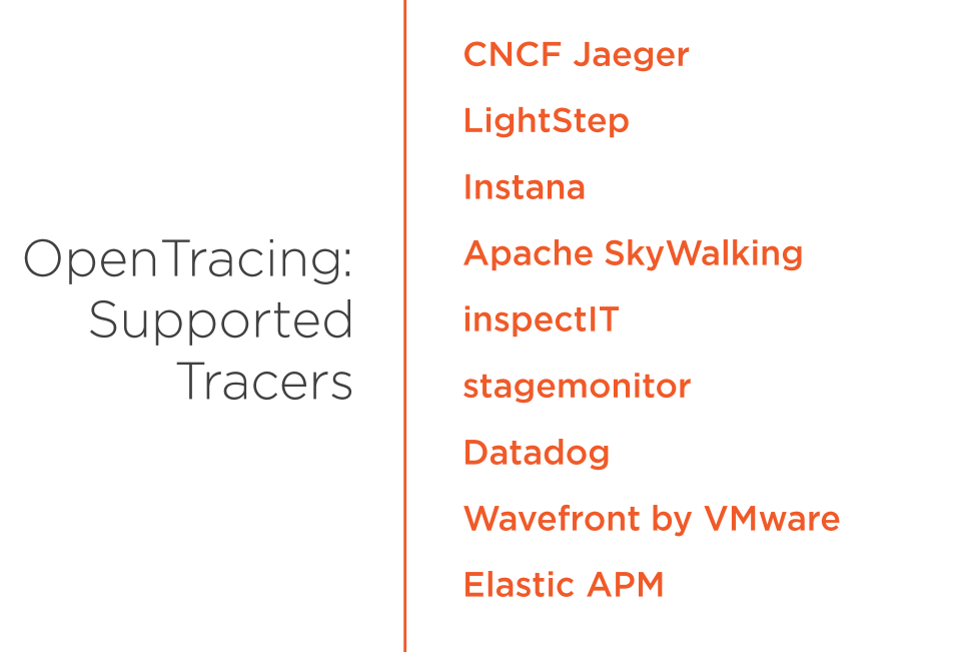
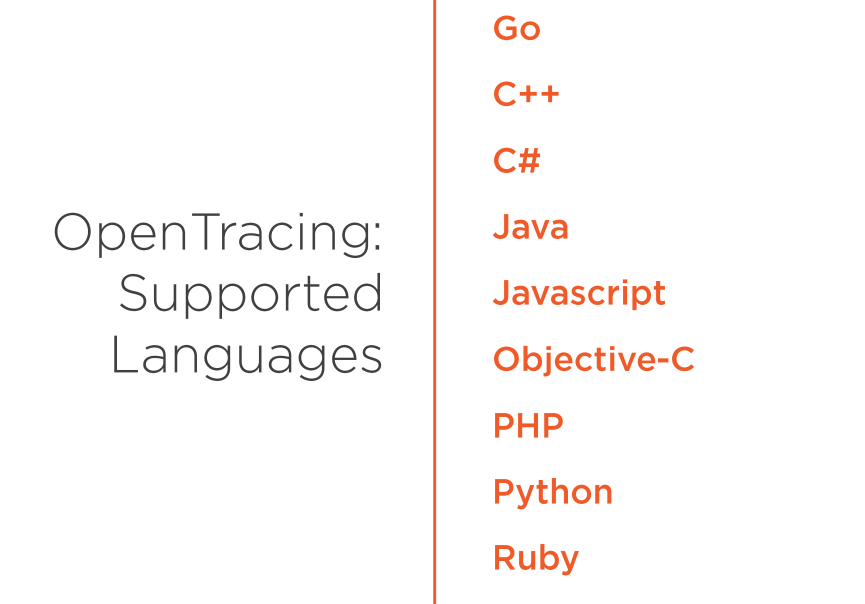
Comparing Opentracing Tools

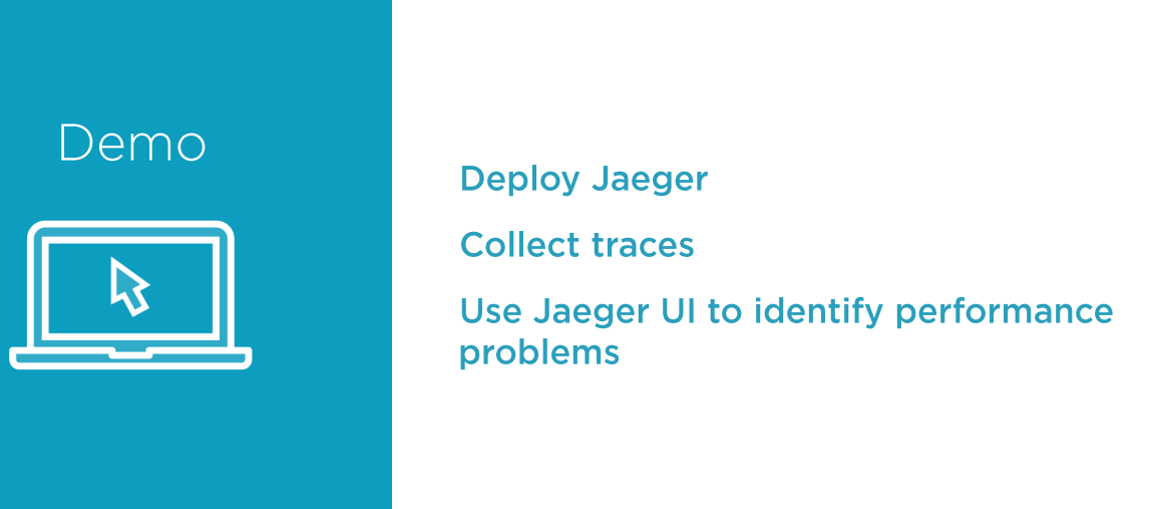
Tools used in DEMO