Zabbix Essentials
by DevOpsSchool.com
Rajesh Kumar
(Senior DevOps Manager & Principal Architect)

-
DevOps@RajeshKumar.xyz
www.rajeshkumar.xyz
/RajeshKumarLog
/RajeshKumarIN
/RajeshKumarIN
Rajesh Kumar — an award-winning academician and consultant trainer, with 15+ years’ experience in diverse skill management, who has more than a decade of experience in training large and diverse groups across multiple industry sectors.
What is Zabbix?
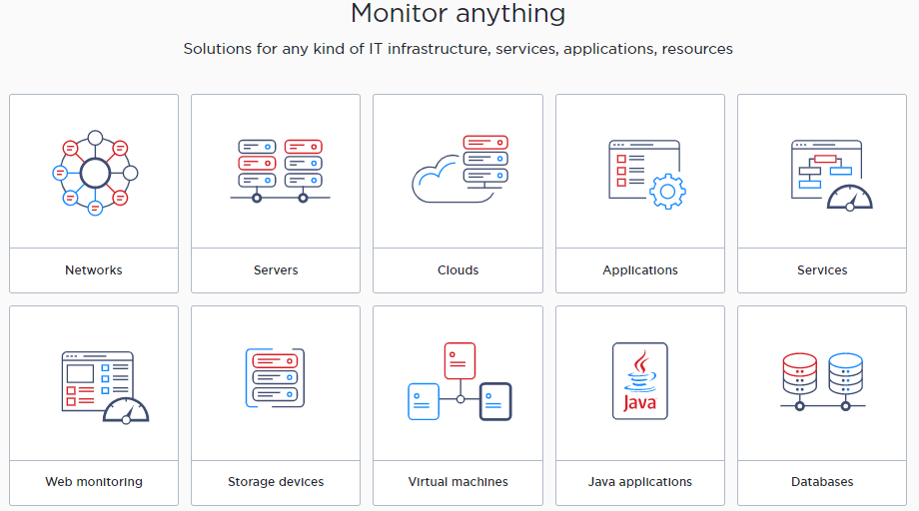
- Zabbix has a centralized web interface
- The server can be run on most Unix-like operating systems
- This monitoring system has native agents for most Unix, Unix-like, and Microsoft Windows operation systems
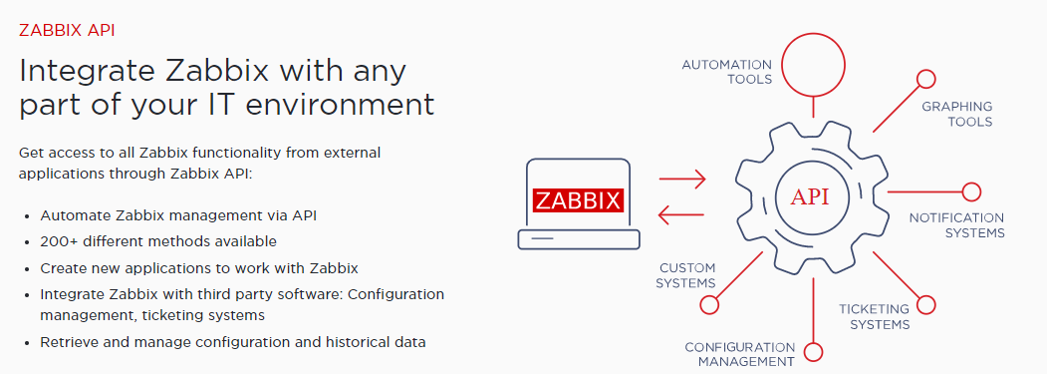
- The system is easy to integrate with other systems, thanks to the API available in many different programming languages and the option that Zabbix itself provides
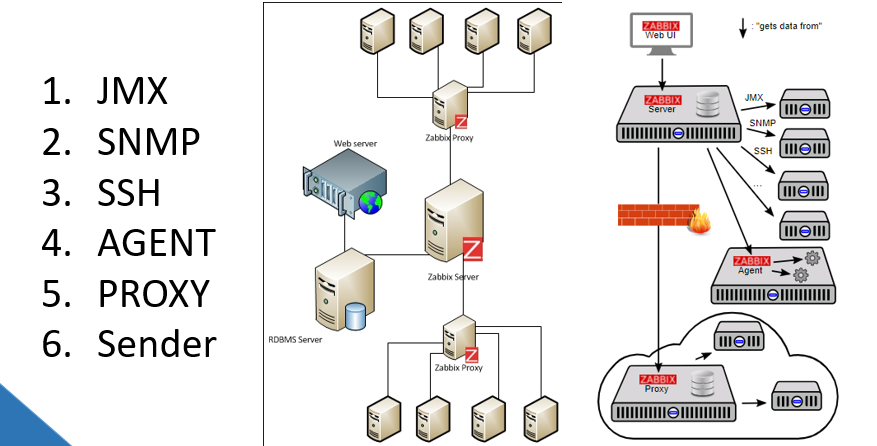
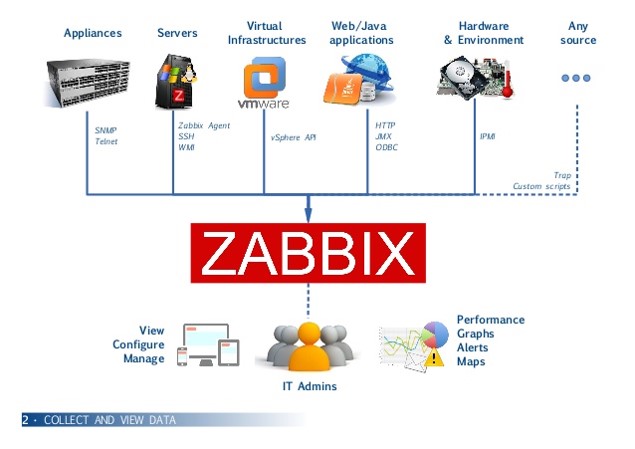
- Zabbix can monitor via SNMP (v1, v2, and v3), IPMI, JMX, ODBC, SSH, HTTP(s), TCP/UDP, and Telnet
- This monitoring system gives us the possibility of creating custom items and graphs and interpolating data
- The system is easy to customize
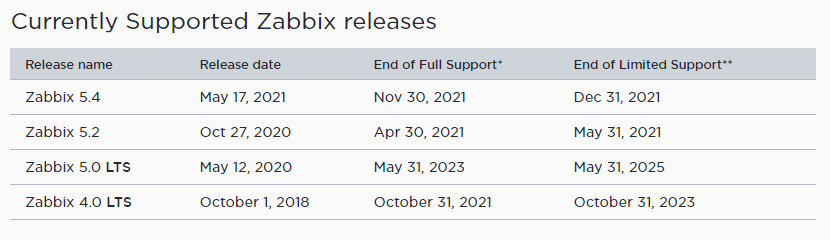
Zabbix Release Timeline
Why Zabbix?
Why Zabbix?
- Open Source – Zabbix is purely open source and comes at no cost.
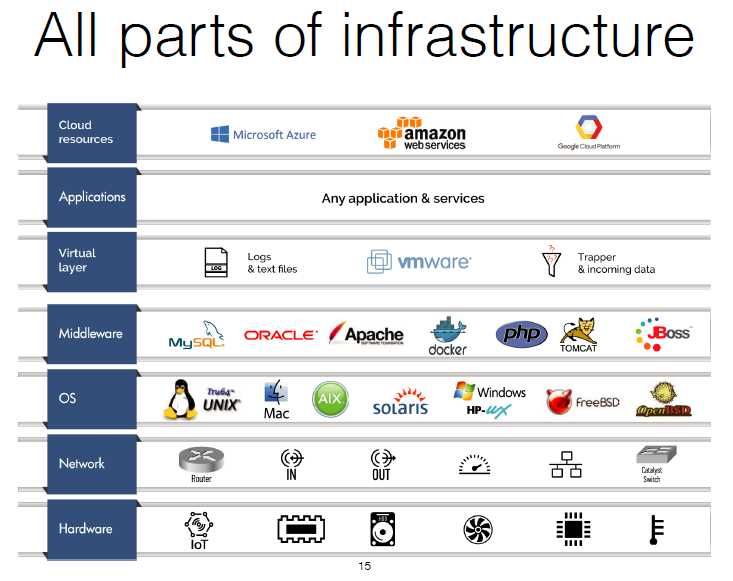
- Active Monitoring – You can easily monitor servers, applications and network devices, gathering accurate statistics and performance data
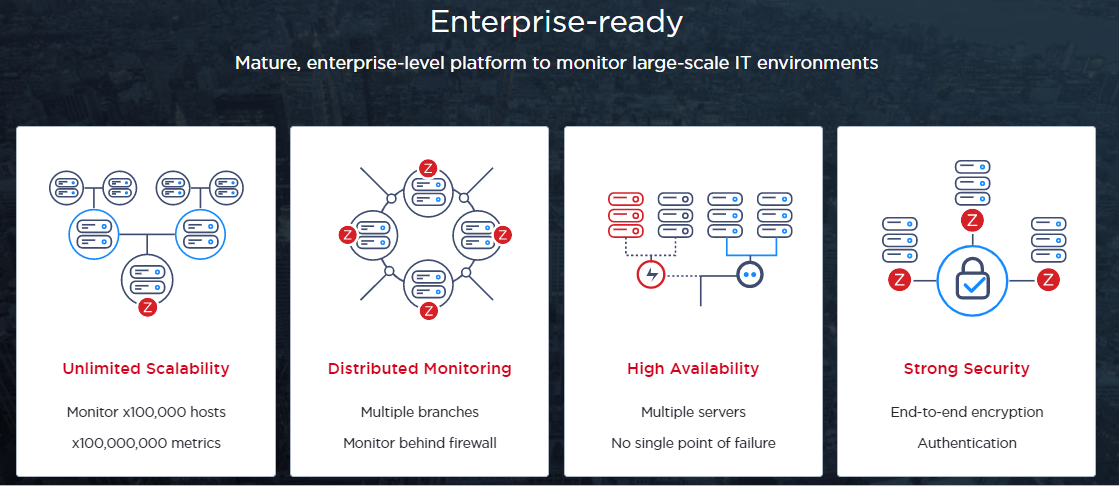
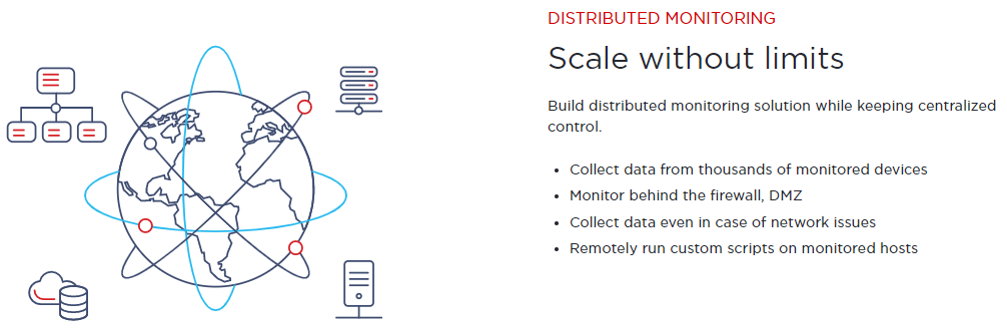
- Enterprise ready – Zabbix has been designed to scale from small environments to large environments
- Capacity Planning – With the data collected by Zabbix, you will be easy to analyze your infrastructure and plan the capacity accordingly.
Why Zabbix?

Why Zabbix?
Why Zabbix?
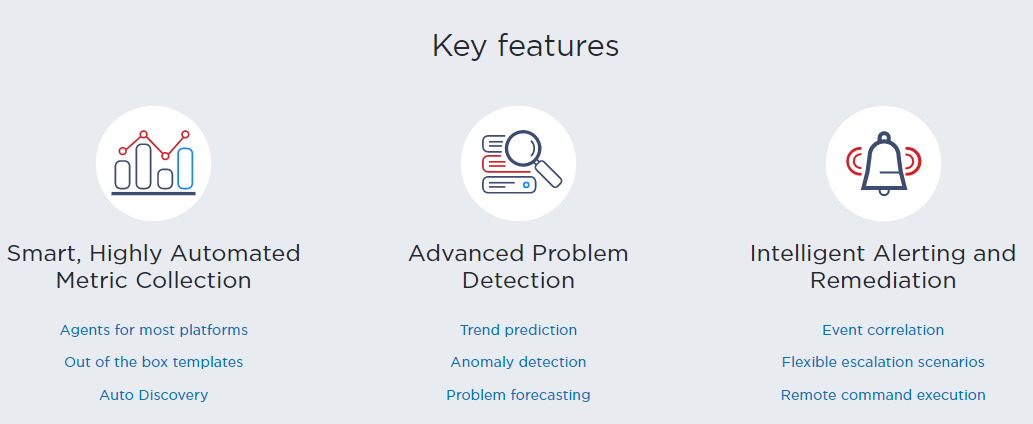
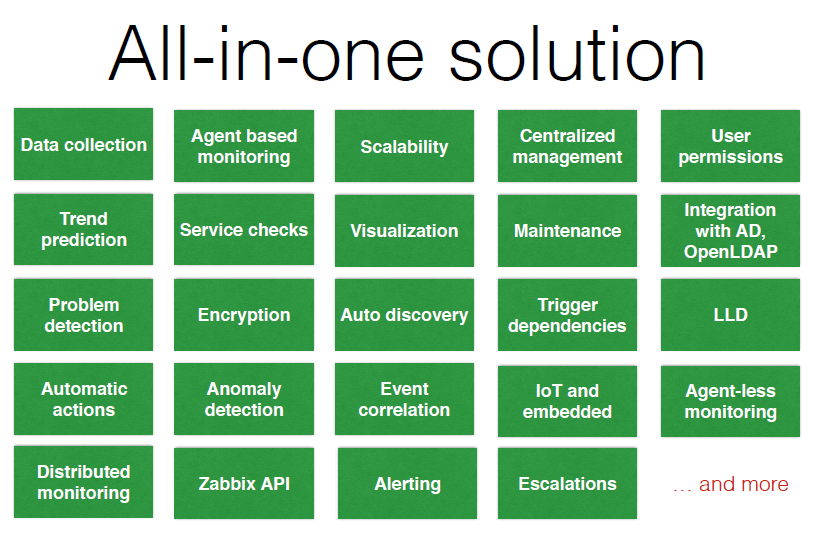
Zabbix Feature & Advantages
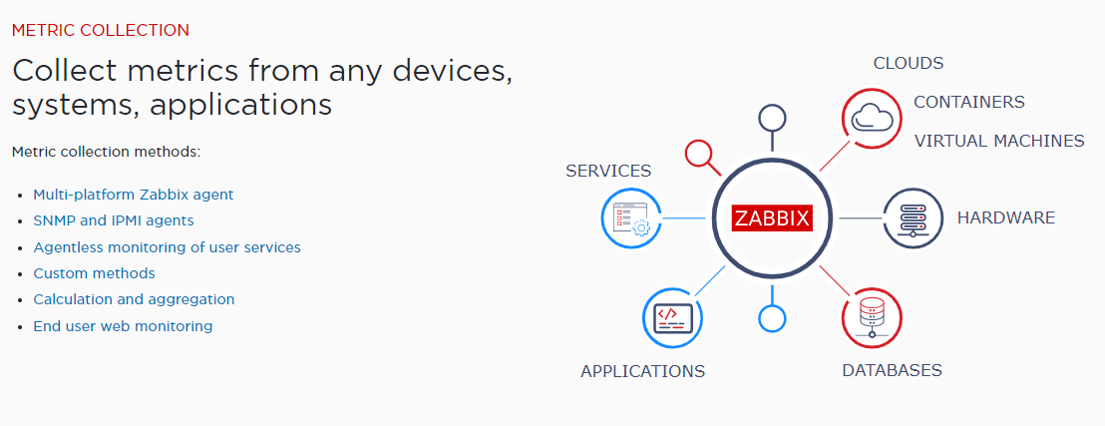
Zabbix Feature & Advantages
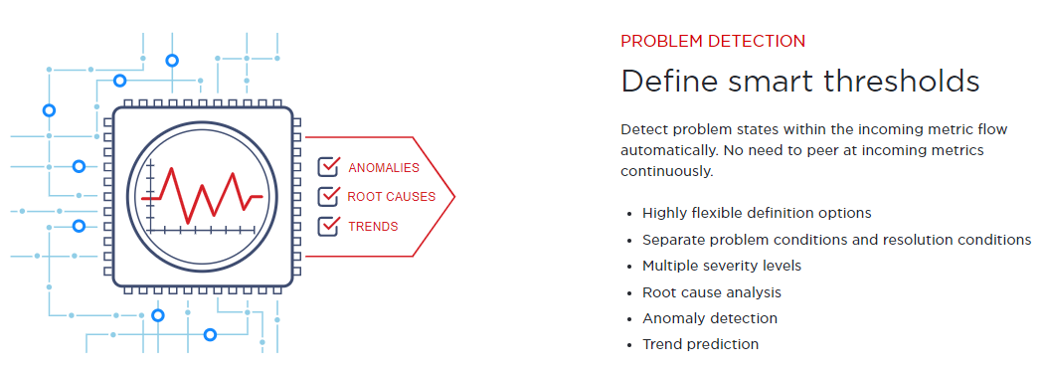
Zabbix Feature & Advantages
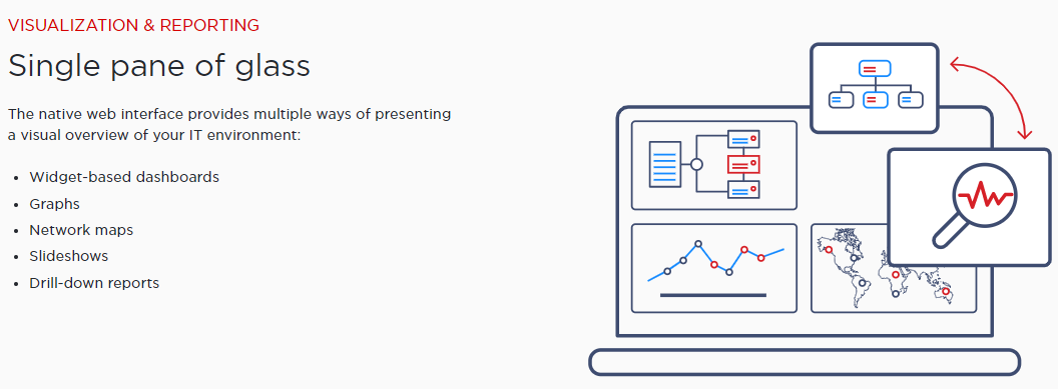
Zabbix Feature & Advantages
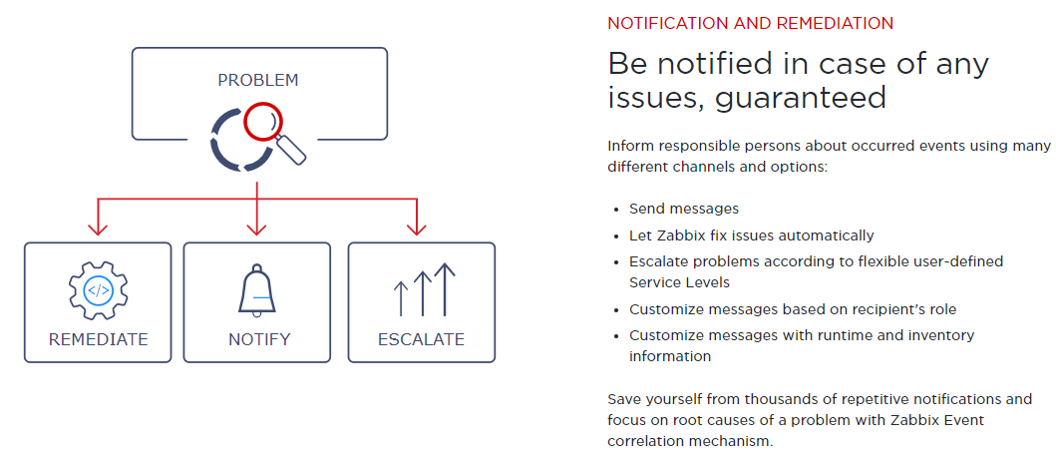
Zabbix Feature & Advantages
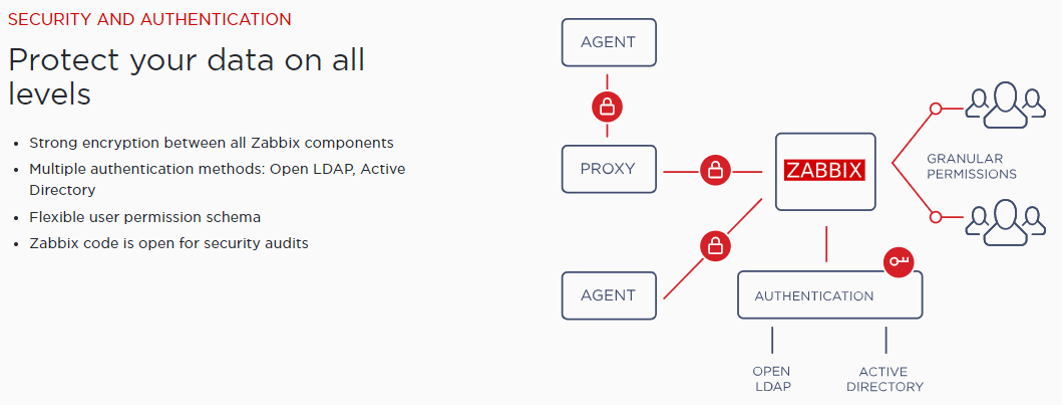
Zabbix Feature & Advantages
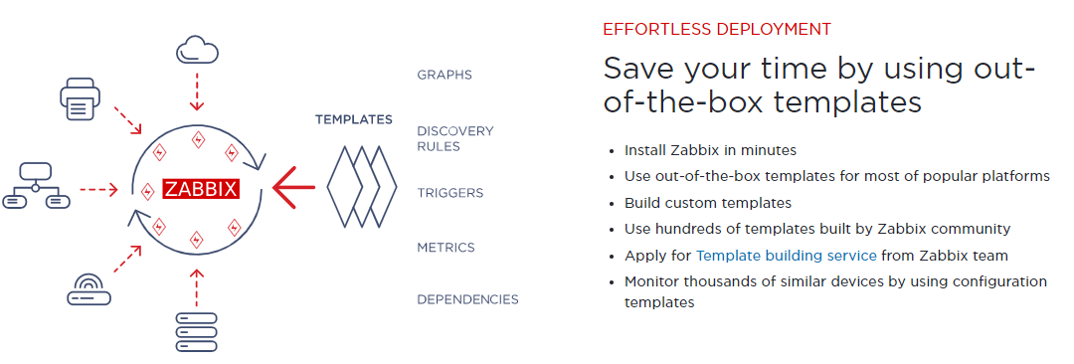
Zabbix Feature & Advantages
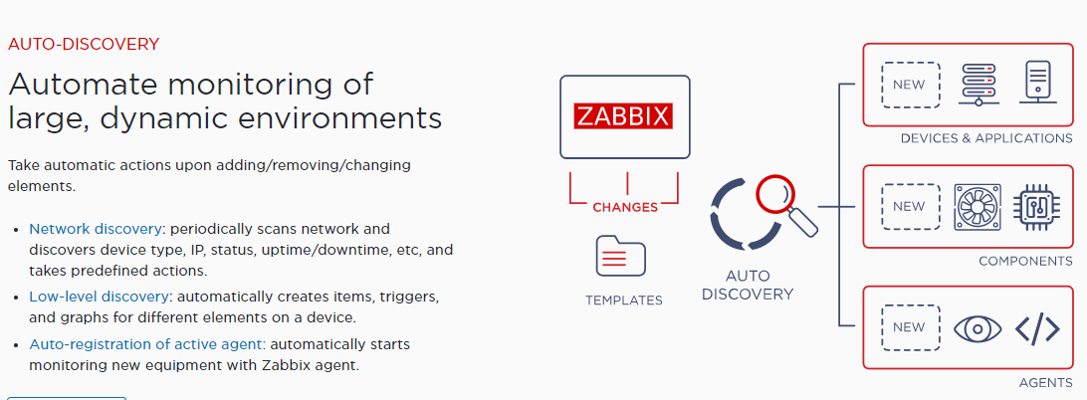
Zabbix Feature & Advantages
Zabbix Feature & Advantages
How Zabbix works & Architecture?
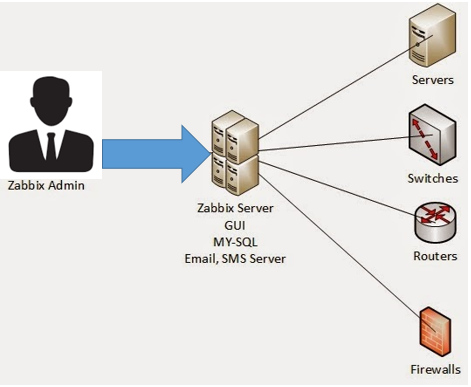
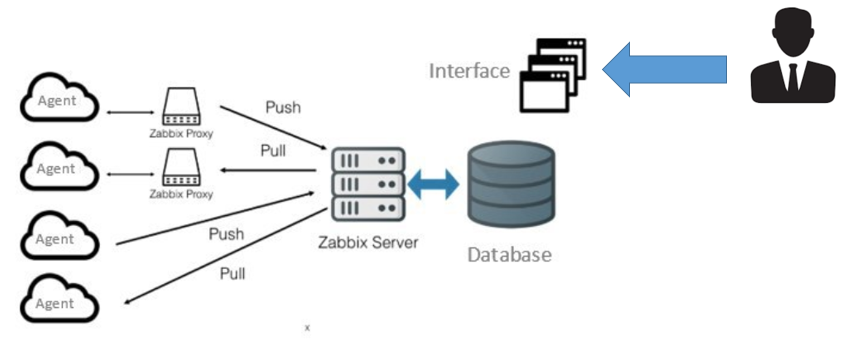
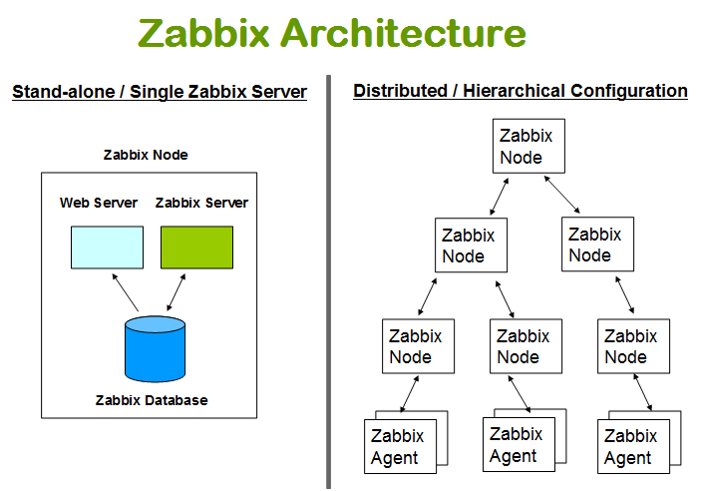
Zabbix Architecture
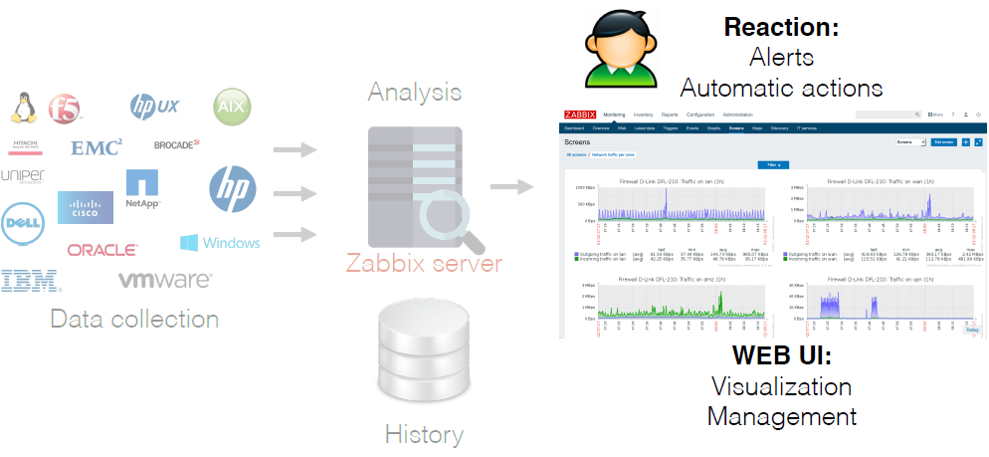
Zabbix consists of several major software components, the responsibilities of which are outlined below.
SERVER: Zabbix server is the central component to which agents report availability and integrity information and statistics. The server is the central repository in which all configuration, statistical and operational data are stored.
DATABASE STORAGE: DATABASE STORAGE: All configuration information as well as the data gathered by Zabbix is stored in a database.
WEB INTERFACE: For an easy access to Zabbix from anywhere and from any platform, the web-based interface is provided. The interface is part of Zabbix server, and usually (but not necessarily) runs on the same physical machine as the one running the server.
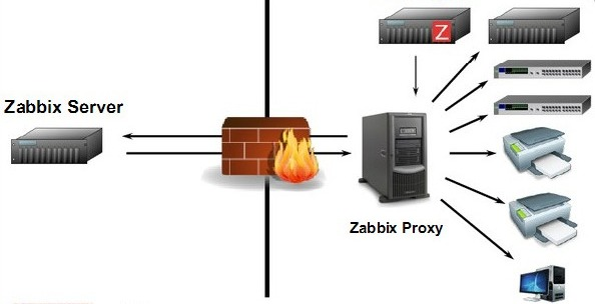
PROXY: Zabbix proxy can collect performance and availability data on behalf of Zabbix server. A proxy is an optional part of Zabbix deployment; however, it may be very beneficial to distribute the load of a single Zabbix server.
AGENT: Zabbix agents are deployed on monitoring targets to actively monitor local resources and applications and report the gathered data to Zabbix server. Since Zabbix 4.4, there are two types of agents available: the Zabbix agent (lightweight, supported on many platforms, written in C) and the Zabbix agent 2 (extra-flexible, easily extendable with plugins, written in Go).
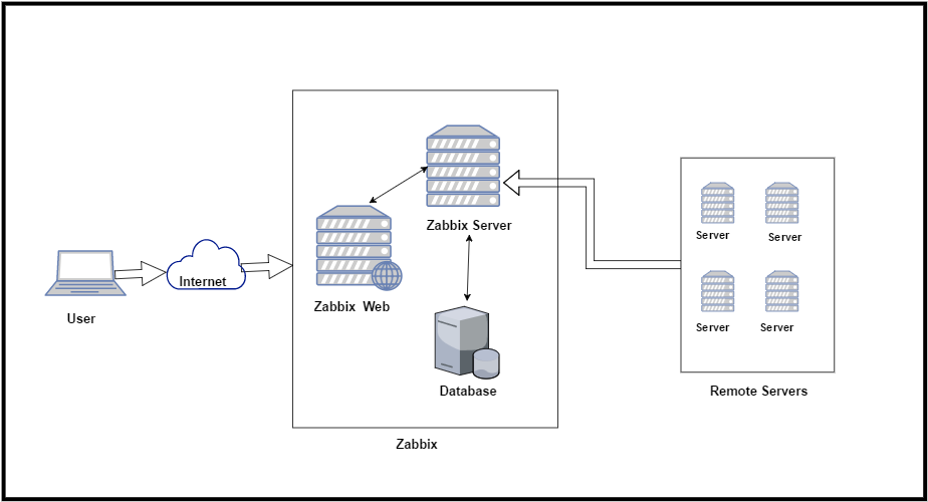
Zabbix Server
Zabbix server is the central process of Zabbix software.
The server performs the polling and trapping of data, it calculates triggers, sends notifications to users. It is the central component to which Zabbix agents and proxies report data on availability and integrity of systems. The server can itself remotely check networked services (such as web servers and mail servers) using simple service checks.
The server is the central repository in which all configuration, statistical and operational data is stored, and it is the entity in Zabbix that will actively alert administrators when problems arise in any of the monitored systems.
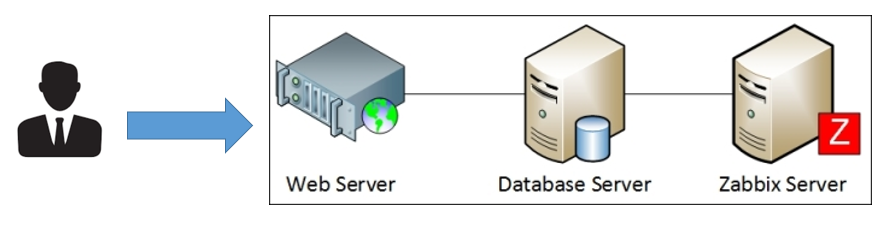
The functioning of a basic Zabbix server is broken into three distinct components; they are: Zabbix server, web frontend and database storage.
Zabbix Architecture
Zabbix Agent
Zabbix agent is deployed on a monitoring target to actively monitor local resources and applications (hard drives, memory, processor statistics etc).
The agent gathers operational information locally and reports data to Zabbix server for further processing. In case of failures (such as a hard disk running full or a crashed service process), Zabbix server can actively alert the administrators of the particular machine that reported the failure.
Zabbix Architecture
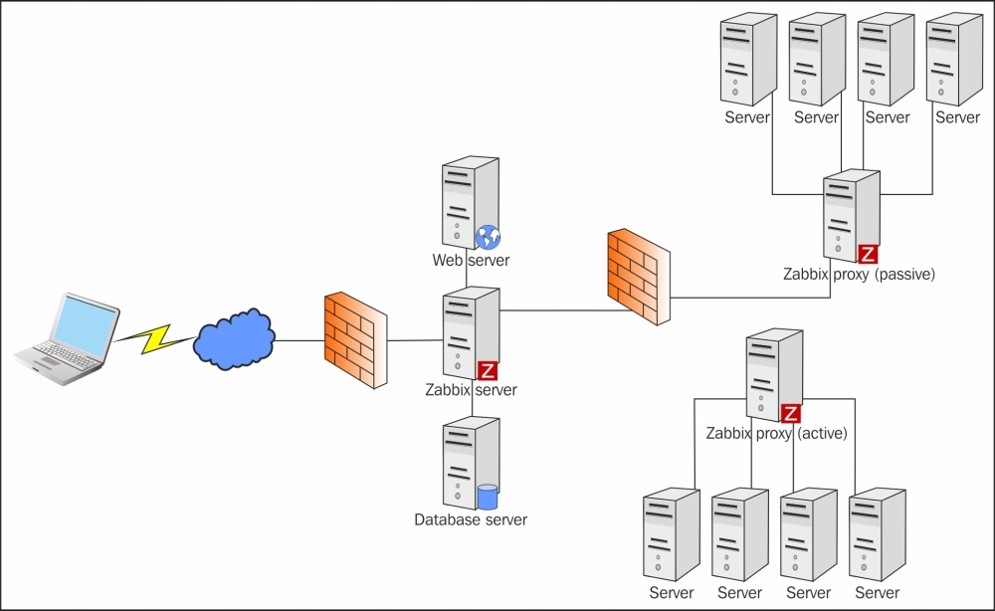
Zabbix Proxy
Zabbix proxy is a process that may collect monitoring data from one or more monitored devices and send the information to the Zabbix server, essentially working on behalf of the server. All collected data is buffered locally and then transferred to the Zabbix server the proxy belongs to.
Deploying a proxy is optional, but may be very beneficial to distribute the load of a single Zabbix server. If only proxies collect data, processing on the server becomes less CPU and disk I/O hungry.
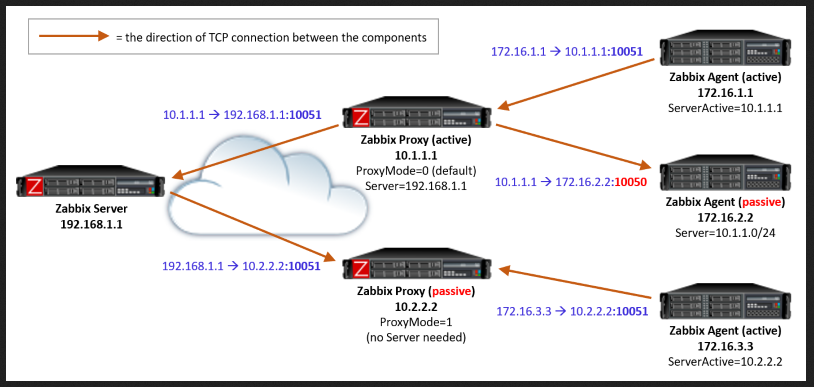
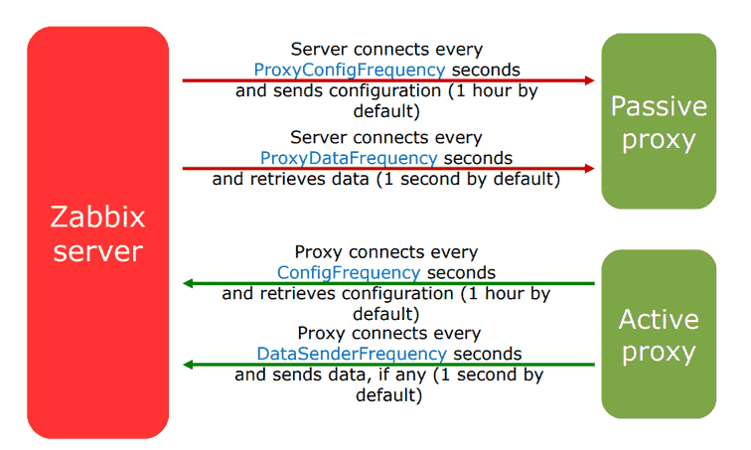
Active agent: The Zabbix agent periodically asks the Zabbix proxy (or Zabbix server, if configured to use the server directly) for the list of items that should be collected, and then the agent will keep collecting the item values using the configured intervals and sending the values to the proxy. The proxy does not need to poll all the clients for the values, so this is more efficient way of working.
Passive agent: The Zabbix agent passively waits for connections. When the Zabbix proxy requires the item values from a client, it connects to the client and gets the item values. This requires the proxy to schedule and initiate the connections to all agents, so it requires more work from the proxy.
Zabbix Protocol
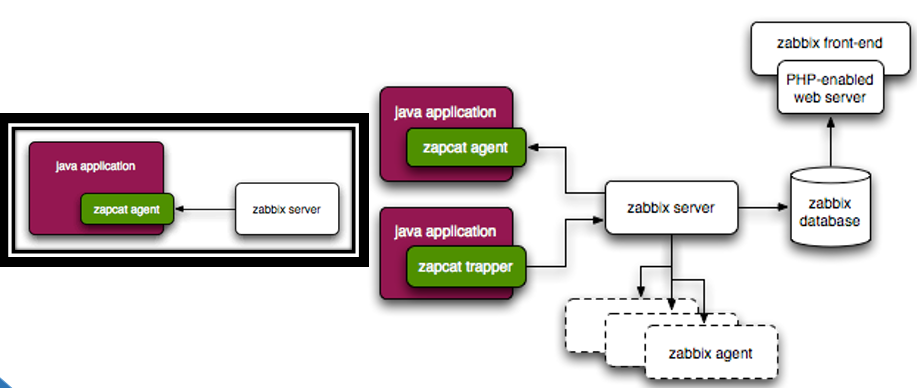
Zabbix Java Gateway
Native support for monitoring JMX applications exists in the form of a Zabbix daemon called “Zabbix Java gateway”, available since Zabbix 2.0. Zabbix Java gateway is a daemon written in Java. To find out the value of a particular JMX counter on a host, Zabbix server queries Zabbix Java gateway, which uses the JMX management API to query the application of interest remotely.
The application does not need any additional software installed, it just has to be started with -Dcom.sun.management.jmxremote option on the command line.
Java gateway accepts incoming connection from Zabbix server or proxy and can only be used as a “passive proxy”. As opposed to Zabbix proxy, it may also be used from Zabbix proxy (Zabbix proxies cannot be chained). Access to each Java gateway is configured directly in Zabbix server or proxy configuration file, thus only one Java gateway may be configured per Zabbix server or Zabbix proxy.Java gateway accepts incoming connection from Zabbix server or proxy and can only be used as a “passive proxy”. As opposed to Zabbix proxy, it may also be used from Zabbix proxy (Zabbix proxies cannot be chained). Access to each Java gateway is configured directly in Zabbix server or proxy configuration file, thus only one Java gateway may be configured per Zabbix server or Zabbix proxy.
Zabbix Architecture
Zabbix Sender
Zabbix sender is a command line utility that may be used to send performance data to Zabbix server for processing.
The utility is usually used in long running user scripts for periodical sending of availability and performance data.
For sending results directly to Zabbix server or proxy, a trapper item type must be configured.
Zabbix Get
Zabbix get is a command line utility which can be used to communicate with Zabbix agent and retrieve required information from the agent.
Zabbix Js
Zabbix_js is a command line utility that can be used for embedded script testing.
This utility will execute a user script with a string parameter and print the result. Scripts are executed using the embedded Zabbix scripting engine.
In case of compilation or execution errors zabbix_js will print the error in stderr and exit with code 1.
Zabbix Web service
Zabbix web service is a process that is used for communication with external web services. Currently, Zabbix web service is used for generating and sending scheduled reports with plans to add additional functionality in the future.
Zabbix server connects to the web service via HTTP(S). Zabbix web service requires Google Chrome to be installed on the same host; on some distributions the service may also work with Chromium (see known issues) .
DevOpsSchool Community Networks
These platforms provide you the opportunity to connect with peers and industry DevOps leaders, where you can share, discuss or get information on latest topics or happenings in DevOps culture and grow your DevOps professionals network.
 |
|---|
| DevOps |
| Build & Release |
 |
|---|
| DevOps |
| Build & Release |
 |
|---|
| DevOpsSchool |
| DevOps Group |
 |
|---|
| BestDevOps.com |

Any Questions?

Thank You!
DevOpsSchool — Lets Learn, Share & Practice DevOps
Connect with us on
contact@devopsschool.com | +91 7004 215 841 | 1800 889 7977Next up:

Zabbix
Session-2-Zabbix-Agent-JMX-IPMI