
Kubernetes Pod container monitoring
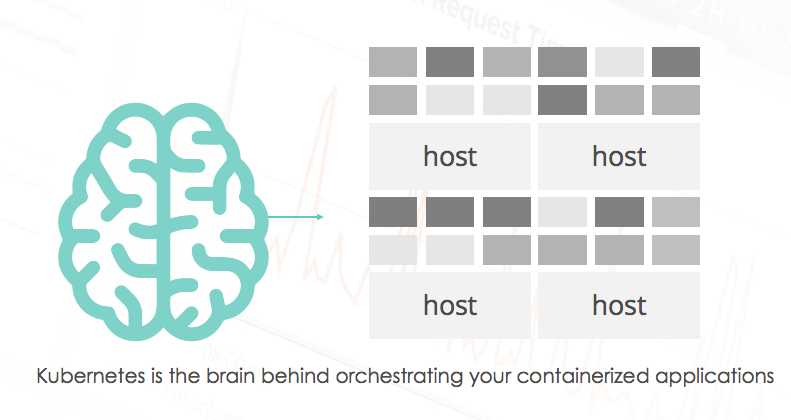
With over 21,000 stars on GitHub, over a thousand committers, and an ecosystem that includes Google, RedHat, Intel, and more, Kubernetes has taken the container ecosystem by storm. It’s with good reason too: Kubernetes acts as the brain for your distributed container deployment. It’s designed to manage service-oriented applications using containers distributed across clusters of hosts. Kubernetes provides mechanisms for application deployment, service discovery, scheduling, updating, maintenance, and scaling. But what about monitoring Kubernetes?
While Kubernetes has the potential to dramatically simplify the act of deploying your application in containers – and across clouds – it also adds a new set of complexities for your day-to-day tasks of managing application performance, gaining visibility into services, and your typical monitoring -> alerting -> troubleshooting workflow.
While Kubernetes has the potential to dramatically simplify the act of deploying your application in containers – and across clouds – it also adds a new set of complexities for your day-to-day tasks of managing application performance, gaining visibility into services, and your typical monitoring -> alerting -> troubleshooting workflow.
In addition to increased infrastructure complexity, now applications are being designed for microservices, where an order of magnitude more components are communicating with each other. Each service can be distributed across multiple instances; Docker containers move across your infrastructure as needed. While before we knew how many instances we had of each service component and we knew where they were located, that’s no longer the case. How does this affect Kubernetes monitoring methodology and tooling? As described on Site Reliability Engineering – How Google Runs Production Systems, “We need monitoring systems that allow us to alert for high-level service objectives, but retain the granularity to inspect individual components as needed.” With that in mind, this blog is the first in a series to help you better understand the act of operating Kubernetes in production. This four-part series covers:
- Part 1 (This post): The basics of monitoring Kubernetes with open source tools, and monitoring it with Sysdig
- Part 2: Best Practices for alerting in Kubernetes
- Part 3: Troubleshooting Kubernetes service discovery via system captures
- Part 4: Monitoring Kubernetes at WayBlazer (a use case)
Understanding Kubernetes and its complexities
From the physical/infrastructure point of view, a Kubernetes cluster is made up of a set of nodes overseen by a master. The master’s tasks include orchestrating containers across nodes, keeping track of state and exposing cluster control through a REST API and a UI.
On the other hand, from the logical/application point of view, Kubernetes clusters are arranged in the hierarchical fashion shown in this picture:
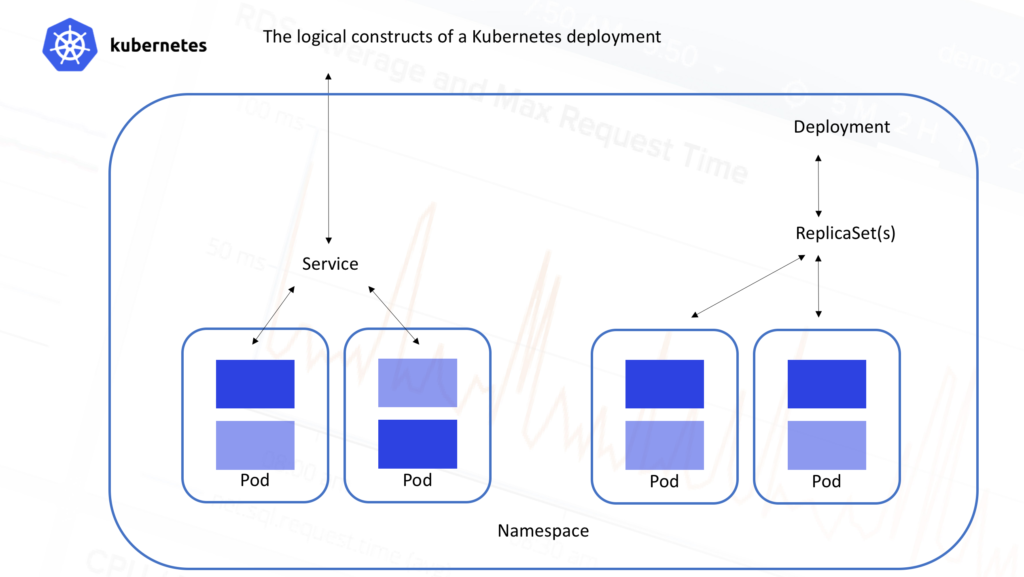
All containers run inside
pods. A pod is a set of containers that live together. They are always co-located and co-scheduled, and run in a shared context with shared storage. The containers in the pod are guaranteed to be co-located on the same machine and can share resources.
- Pods typically sit behind services, which take care of balancing the traffic, and also expose the set of pods as a single discoverable IP address/port.
- Services are scaled horizontally by replica sets (formerly replication controllers) which create/destroy pods for each service as needed.
- ReplicaSets are further controlled by ** deployments ** which allow you to declare state for a number of running replicasets and pods
- Namespaces are virtual clusters that can include one or more services.
- ** Metadata ** allows the use of labels and tags to mark containers based on their deployment characteristics.So just to be clear, multiple services and even multiple namespaces can be scattered across the same physical infrastructure. Each of those services are made up of pods, which in turn can consist of any number of containers. This can lead to some pretty impressive complexity in terms of monitoring even a modest Kubernetes deployment.
Let’s take a look at the options Kubernetes itself provides us to help deconstruct this challenge.
How to collect Kubernetes monitoring data: open source options
Like most platforms, Kubernetes has a set of rudimentary tools that allow you to monitor your servers, and in this case the Kubernetes constructs that ride on top of physical infrastructure. The term “built-in” may be a little bit of an overstatement. It’s more fair to say that, given the extensible nature of Kubernetes, it is possible for your inner tinkerer to add additional components to gain visibility into Kubernetes. Let’s run through a few of these options:
- Probes
- cAdvisor
- Heapster
- Kubernetes Dashboard
- Kube-state-metrics
After that we can compare these options to using Sysdig.
Liveness and Readiness Probes
Kubernetes Probes perform the important function of regularly monitoring the health of a container or service and, in the event of an unhealthy object, taking action. Kubernetes monitoring probes allows you to arbitrarily define “Liveness” through a particular command that should be successfully executed within the Pod. You can also define the frequency with which the liveness probe is executed. Below is a simple example of a liveness probe based on running a cat command.
#Example Liveness probe for the Sysdig Blog on "Monitoring Kubernetes"

apiVersion: v1
kind: Pod

metadata:
  labels:
    test: liveness
  name: liveness-exec
spec:
  containers:

  - name: liveness

    args:
    - /bin/sh
    - -c
    - touch /tmp/healthy; sleep 30; rm -rf /tmp/healthy; sleep 600

    image: gcr.io/google_containers/busybox

    livenessProbe:
      exec:
        command:
        - cat
        - /tmp/healthy
      initialDelaySeconds: 5
      periodSeconds: 5

      #source https://kubernetes.io/docs/tasks/configure-pod-container/configure-liveness-readiness-probes/
A readiness probe is a somewhat modified version of a liveness probe, which again executes a command to check if a Pod is prepared to handle traffic after (re)starting.
cAdvisor and Heapster
cAdvisor is an open source container resource usage collector. It is purpose built for containers and supports Docker containers natively. Unlike most elements within Kubernetes that operate at the Pod level, cAdvisor operates per node. It auto-discovers all containers in the given node and collects CPU, memory, filesystem, and network usage statistics. cAdvisor also provides the overall machine usage by analyzing the ‘root’ container on the machine. Note that cAdvisor is limited in a couple ways:
- It only collects basic resource utilization – cAdvisor cannot tell you how your applications are actually performing, only if a container has X% CPU utilization (for example).
- cAdvisor itself doesn’t offer any long term storage, trending, or analysis capabilities.
In order to go further with this data, we need to add Heapster. Heapster aggregates monitoring data across all nodes in your Kubernetes cluster. Heapster runs as a pod in the cluster, just like any application. The Heapster pod queries usage information from the nodes’ Kubelets, the on-machine Kubernetes agent, which in turn queries the data from cAdvisor. Heapster groups the information by pod along with including the relevant labels.
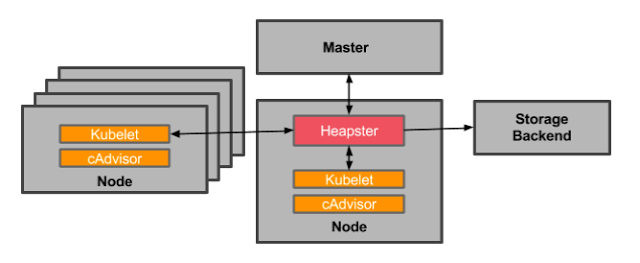
OK, now you’re set, right? Almost. Heapster * also * doesn’t allow you to store, trend, or alert on data. It merely makes it easier for you to collect cAdvisor data across your entire cluster. This data is then pushed to a configurable backend for storage and visualization. Currently supported backends include InfluxDB, Google Cloud Monitoring and a few others. You further must add a visualization layer like Grafana to see your data.
The Kubernetes Dashboard
A recently popular add-on to Kubernetes gives you a consistent way to visualize some of this basic data, as well as manage your environment. The Kubernetes Dashboard provides a simple way to see your environment according to Kubernetes metadata. It’s got a couple advantages: basic CPU / memory data is available, and you can also take action from this dashboard.
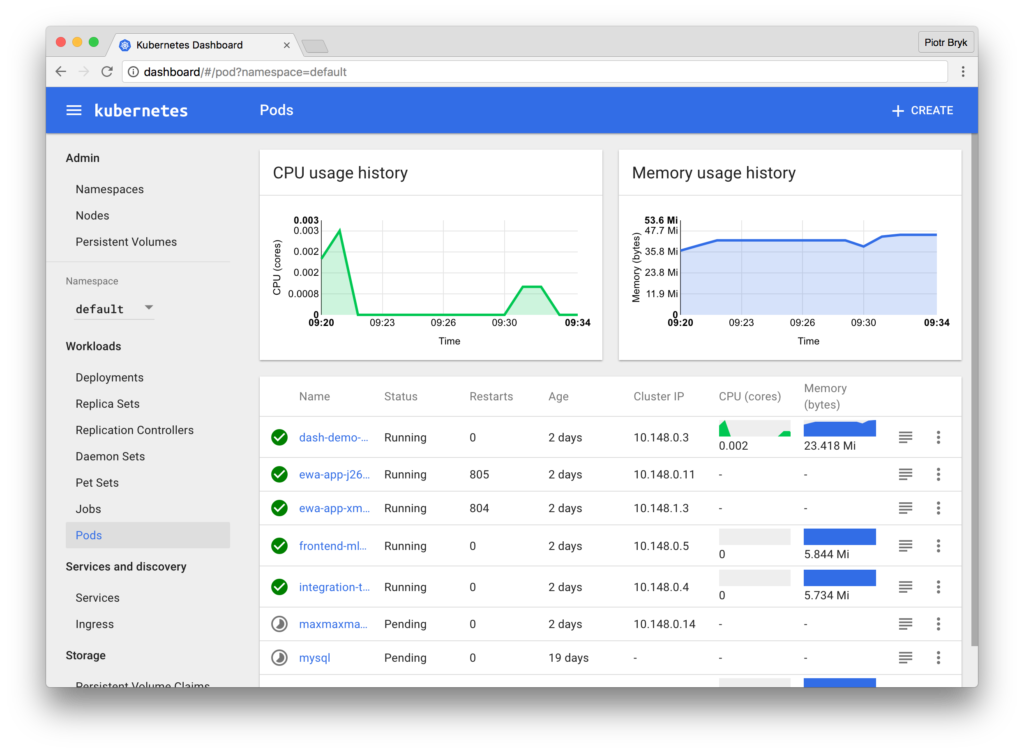
Simply install the dashboard from kubectl, the Kubernetes command line:
$ kubectl create -f https://rawgit.com/kubernetes/dashboard/master/src/deploy/kubernetes-dashboard.yamland then access the dashboard on localhost on the machine where you run it: http://localhost:8001/ui.
kube-state-metrics: A complement to your setup for monitoring setup
In addition to your cAdvisor/Heapster/Influx/Grafana setup, you may also consider deploying kube-state-metrics. It’s an add-on service that runs along side your Heapster setup that polls the Kubernetes API and translates characteristics about your Kubernetes constructs into metrics. Some questions kube-state-metrics would answer are:
- How many replicas did I schedule? And how many are currently available?
- How many pods are running / stopped / terminated?
- How many times has this pod restarted?
… and so on. In general, the model is to take Kubernetes events and convert them to metrics. It requires Kubernetes 1.2+, and unfortunately warns that metric names and tags are unstable and may change.
This at least gives you a sense of the steps you’d take to build reasonable monitoring for your Kubernetes environment. While we still wouldn’t have detailed application monitoring (“What’s the response time for my database service?”), we could at least see our underlying hosts, Kubernetes nodes, and some monitoring of the state of our Kubernetes abstractions.
Let’s now take a look at Sysdig’s approach to Kubernetes monitoring.
Monitoring Kubernetes With Sysdig
After talking to hundreds of Kubernetes users, it seems that the typical cluster administrator is often interested in looking at things from the physical point of view, while application developers in charge of building services tend to be more interested in seeing things from the logical point of view. Regardless of the view you’re looking for, all teams want to limit the amount of work they need to do in order to instrument their system or manage data collection.
With both these use cases in mind, Sysdig Monitor’s support for Kubernetes now works like this:
- By connecting to a Kubernetes’ cluster API Server and querying the API (both the regular and the watch API), we’re now able to infer both the physical and the logical structure of your microservice application.
- In addition, we transparently extract important metadata such as labels.
- This information is combined with our ContainerVision technology, which makes it possible to inspect applications running inside containers without requiring any instrumentation of the container or application. Instrumentation happens per node, and not per pod.
- So, with a single instrumentation point, you can monitor your hosts, networks, containers, and applications – all tagged with Kubernetes metadata. You can deploy Sysdig via a DaemonSet in Kubernetes so it’s a one-step install.
- You can then visualize and alert on this data either in Sysdig Monitor’s cloud service or our on-premise software based on your requirements.
Based on this, Sysdig Monitor can now provide rich visibility and context from both an infrastructure-centric and an application-centric point of view. Best of both worlds!
Let’s check out what this actually looks like…
Grouping by Kubernetes Metadata
One of the core features of Sysdig Monitor is grouping. You’re able to group and explore your containers based on their physical hierarchy (for example, AWS region > Host > pod > container) or based on their logical microservice hierarchy (for example, namespace > replicaset > pod > container).
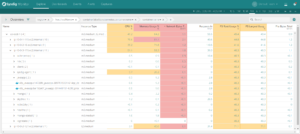
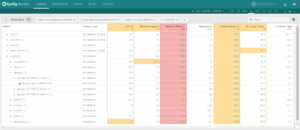
Click on each of these images and see the difference between a physical and a logical grouping to monitor your Docker containers with Kubernetes context.
If you’re interested in the utilization of your underlying physical resource – eg. identifying noisy neighbors – then the physical hierarchy is great. But if you’re looking to explore the performance of your applications and microservices, then the logical hierarchy is often the best place to start.
In general, the ability to regroup your infrastructure on the fly is a more powerful way to troubleshoot your environment as compared to the typical dashboard.
Analyzing the response time of a Kubernetes Service
For example: by clicking on the Prod->Wordpress row in the logical table above, we automatically get a dashboard that analyzes the performance of our aggregate HTTP service, across all containers, regardless of the host or data center they are running in. One powerful overview is the * Service Response Time *: automatically aggregating service latency across all relevant containers, and then correlating that with resource utilization:
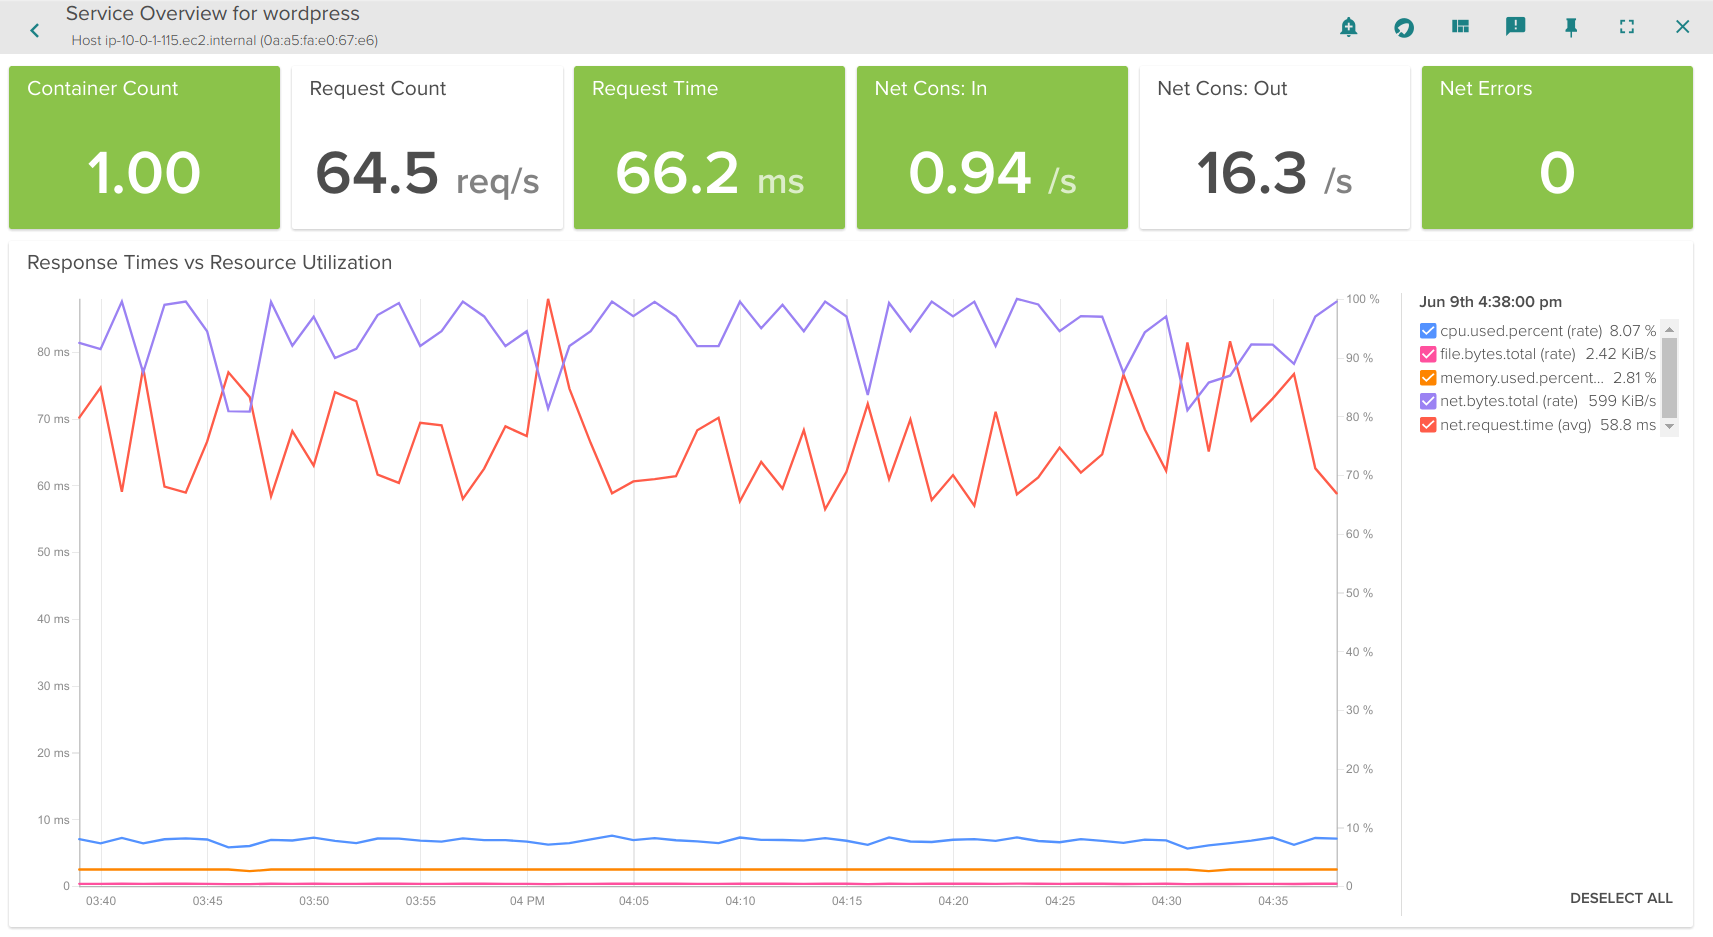
This gives us a quick analysis of if my service is performing as expected, in relation to underlying resource utilization. Now let’s go deeper into the service.
Analyzing the slowest endpoints of a Kubernetes HTTP Service
Next, let’s drill into specific metrics of the application itself – since this is a wordpress app acting as our HTTP service in this demo, let’s take a look at the HTTP overview.
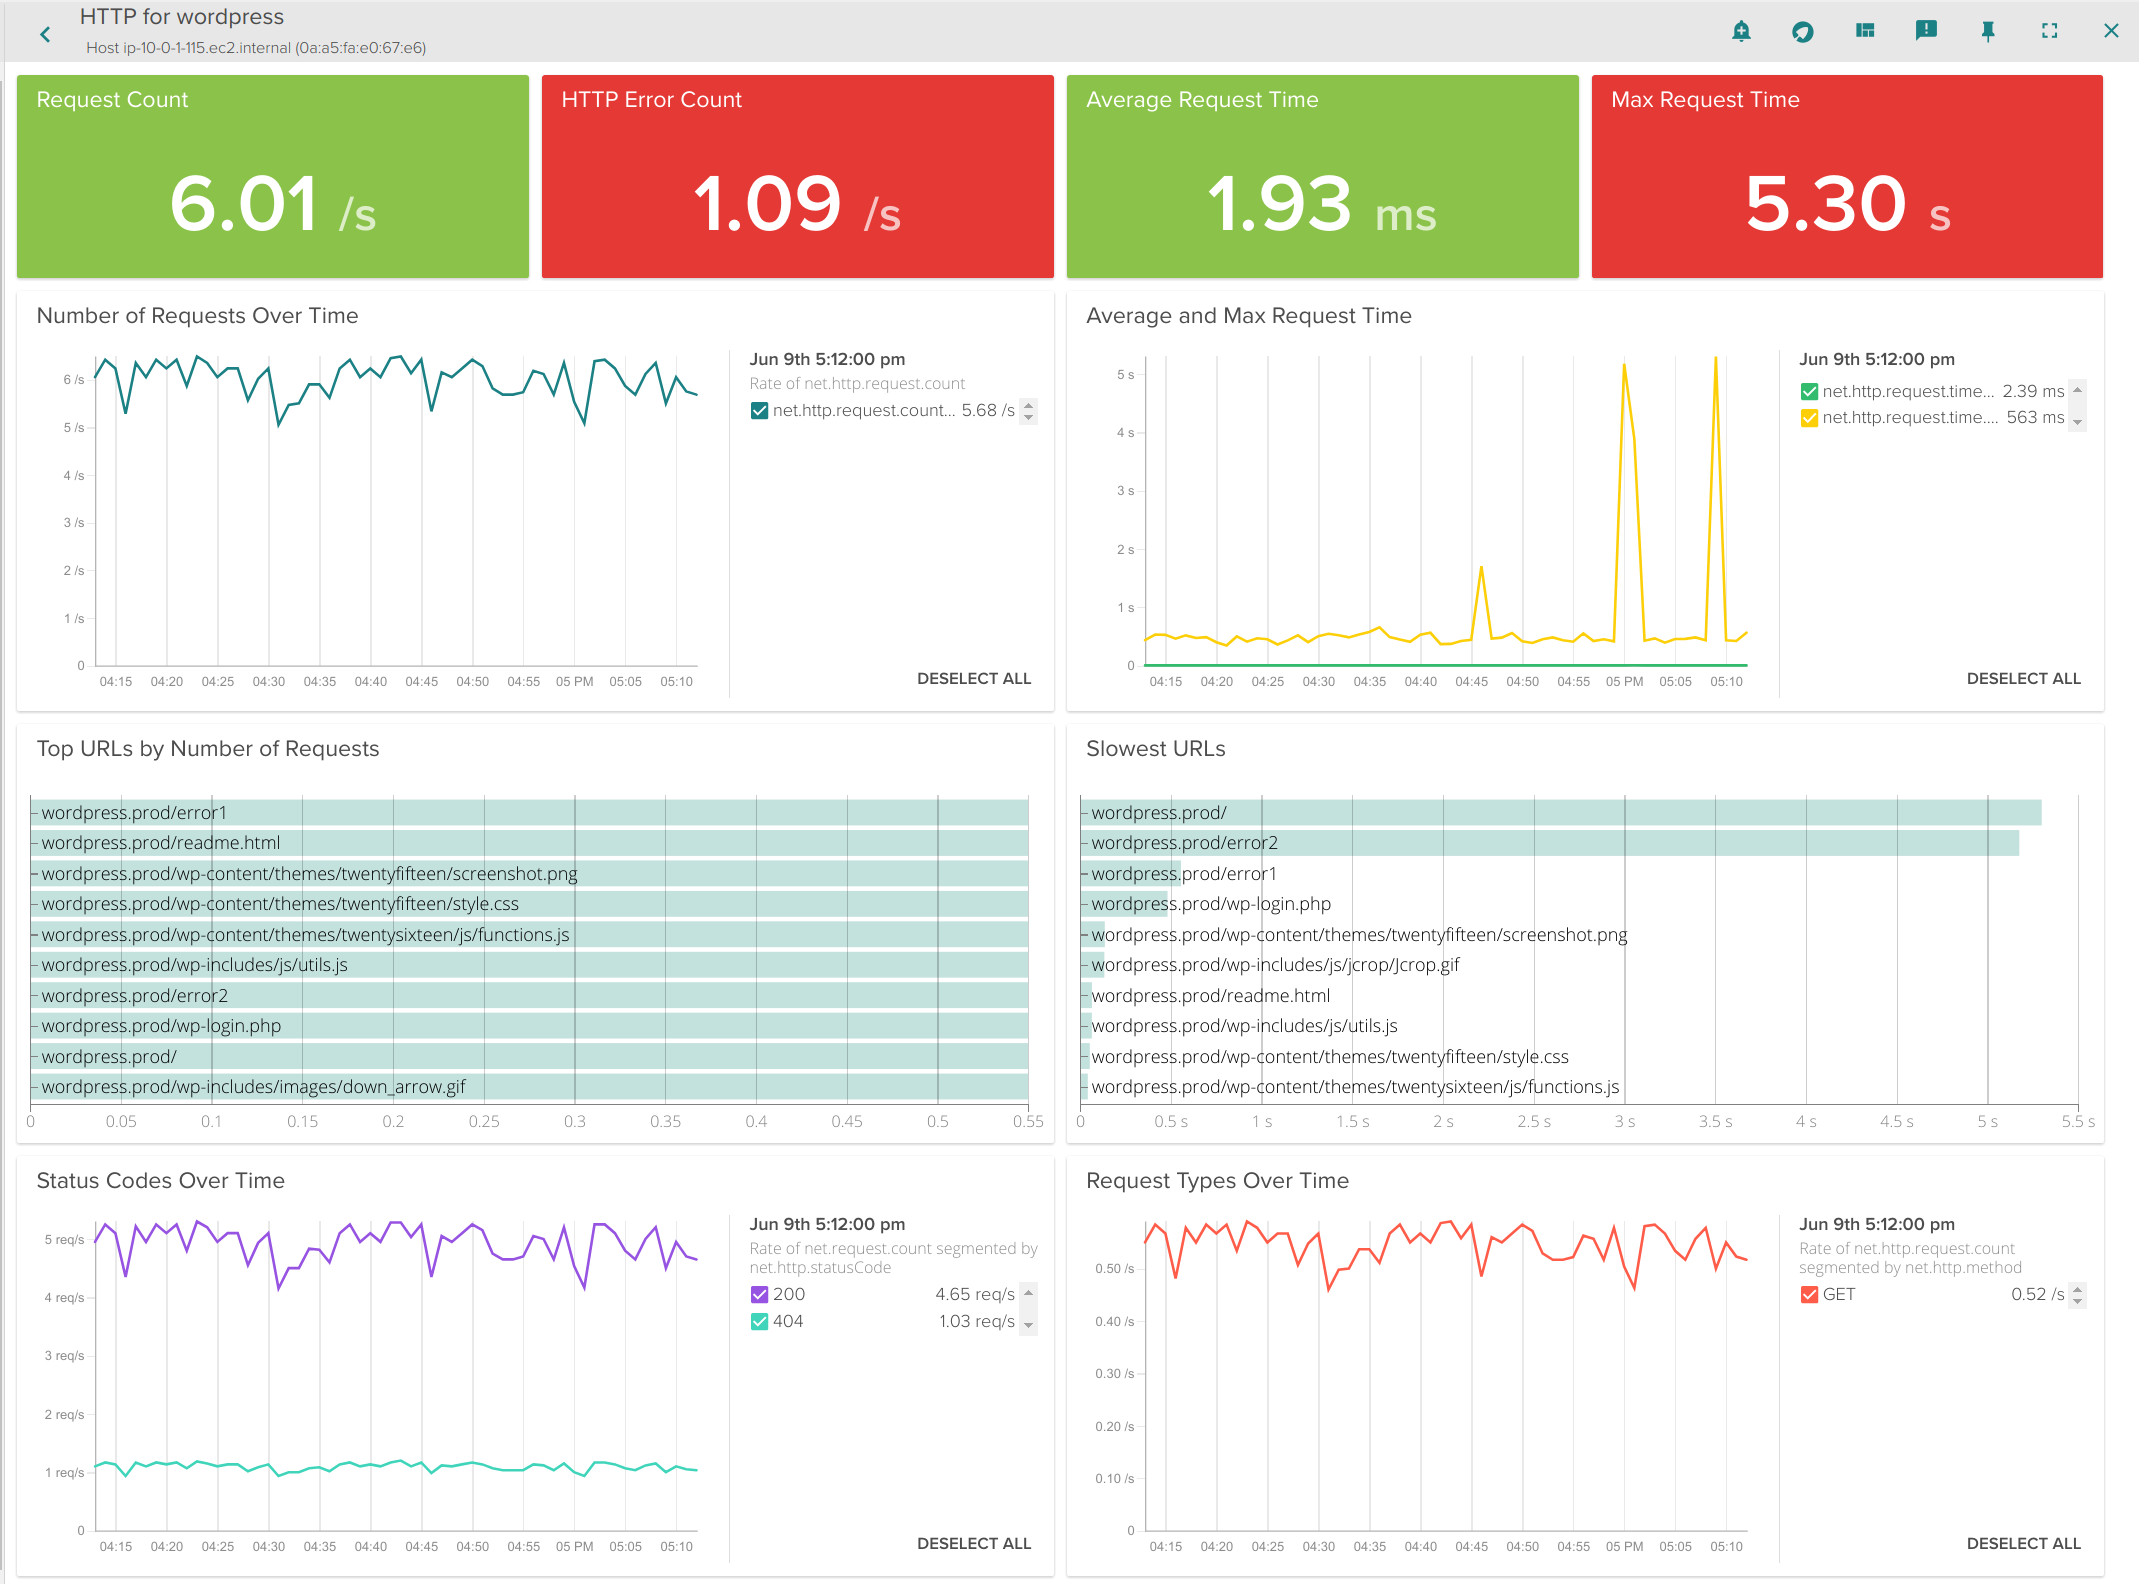
Here you see that we can now dig into:
- Most frequently used HTTP endpoints
- Slowest HTTP endpoints
- Average Connection time
- Errors
- Status Codes
Keep in mind that the pods implementing this service are scattered across multiple machines, but we can still total request counts, response times, and URLs statistics aggregated together for this service. And don’t forget: this doesn’t require any configuration or instrumentation of WordPress, Apache, or the underlying containers.
Similarly, if this were RabbitMQ, MySQL, Redis, Consul, Nginx or 50+ other components, we’ll perform in the same way (though the metrics would be different per application of course).
Correlating Kubernetes Events
Finally, with about any metric you’re examining, it might be useful to see what contextual events Kubernetes is reporting in order to see if they provide you with clues as to why your application is acting the way it is. Sysdig is automatically collecting Kubernetes events, so you can do this:
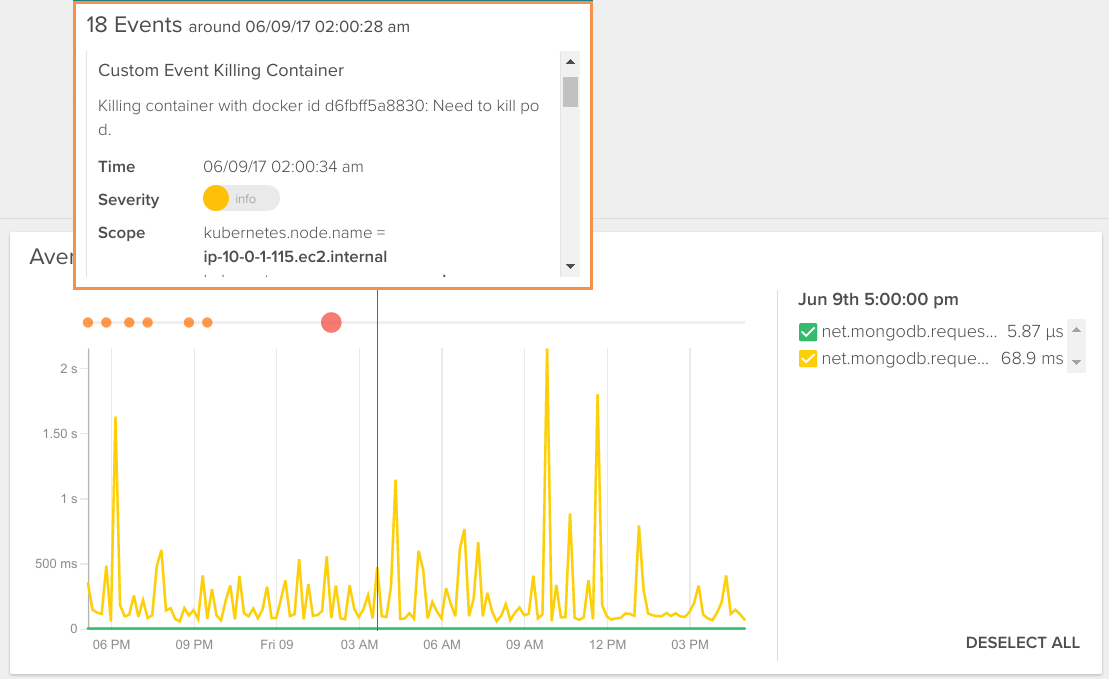
And from this view (or any other for that matter), you can easily create alerts for metrics aggregated across a Kubernetes service, as opposed to a container or node. But you can still dig down into any individual container for deep inspection – down to the process level.
Visualizing Your Kubernetes Services
The above example gives you a feel for how you’d monitor the performance of one Kubernetes service. But what if we wanted to see all our services, and more importantly how they are communicating to each other? Let’s accomplish this via a topology view.
The two pictures below show the exact same infrastructure and services. The first one depicts the physical hierarchy, with a master and three nodes:
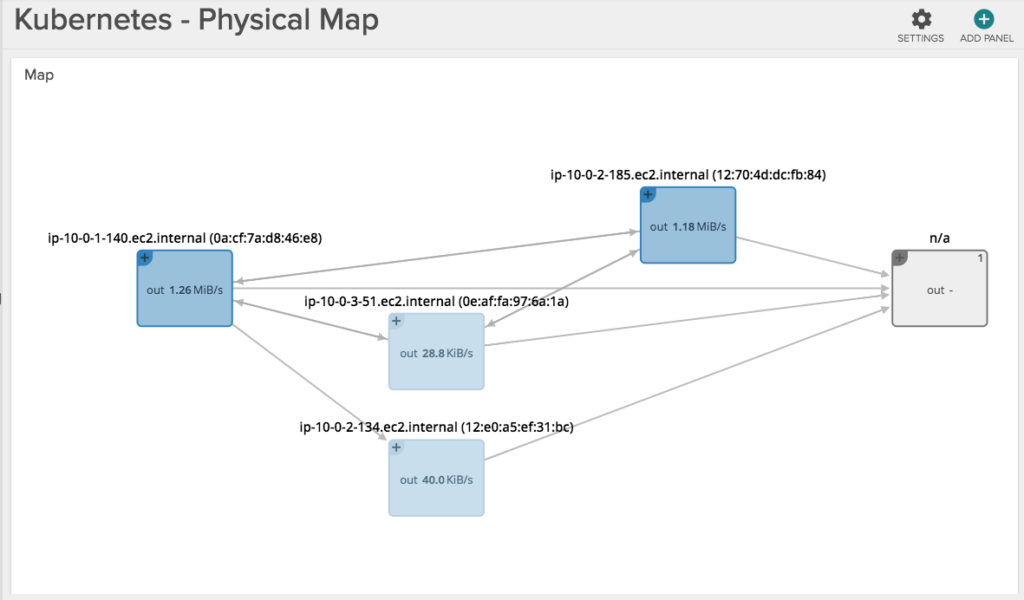
While this second one groups containers into namespaces, services and pods, while abstracting the physical location of the containers.
Hopefuly it’s self-evident how much more natural and intuitive the second (services-oriented) view is for monitoring Kubernetes applications. The structure of the application and the various dependencies are immediately clear. The interactions between various microservices become obvious, despite the fact that these microservices are intermingled across our machine cluster!
Conclusion
The main conclusion is: if you have a non-trivial deployment, you must start thinking about monitoring Kubernetes in a way that naturally fits in with your orchestrated environment.