Meaning of Prometheus
In Greek mythology, Prometheus, possibly meaning “forethought”), is a Titan god of fire. Prometheus is known for his intelligence and for being a champion of humankind, and is also seen as the author of the human arts and sciences generally.
What is Prometheus (software)?
Prometheus is a free software application used for event monitoring and alerting thus Prometheus is an open-source systems monitoring and alerting toolkit.
- Prometheus was developed at SoundCloud starting in 2012.
- Prometheus was introduced for production monitoring at SoundCloud By 2013.
- In May 2016, the Cloud Native Computing Foundation accepted Prometheus as its second incubated project, after Kubernetes.
- Prometheus 1.0 was released in July 2016
- Prometheus 2.0 in November 2017]
- The project is written in Go and licensed under the Apache 2 License
- Source code available on GitHub
- A multi-dimensional data model
- Operational simplicity
- Scalable data collection
- Powerful query language
Features of Prometheus
Prometheus’s main features are:
- A multi-dimensional data model with time series data identified by metric name and key/value pairs
- PromQL, a flexible query language to leverage this dimensionality
- No reliance on distributed storage; single server nodes are autonomous
- Time series collection happens via a pull model over HTTP
- Pushing time series is supported via an intermediary gateway
- Targets are discovered via service discovery or static configuration
- Multiple modes of graphing and dashboarding support
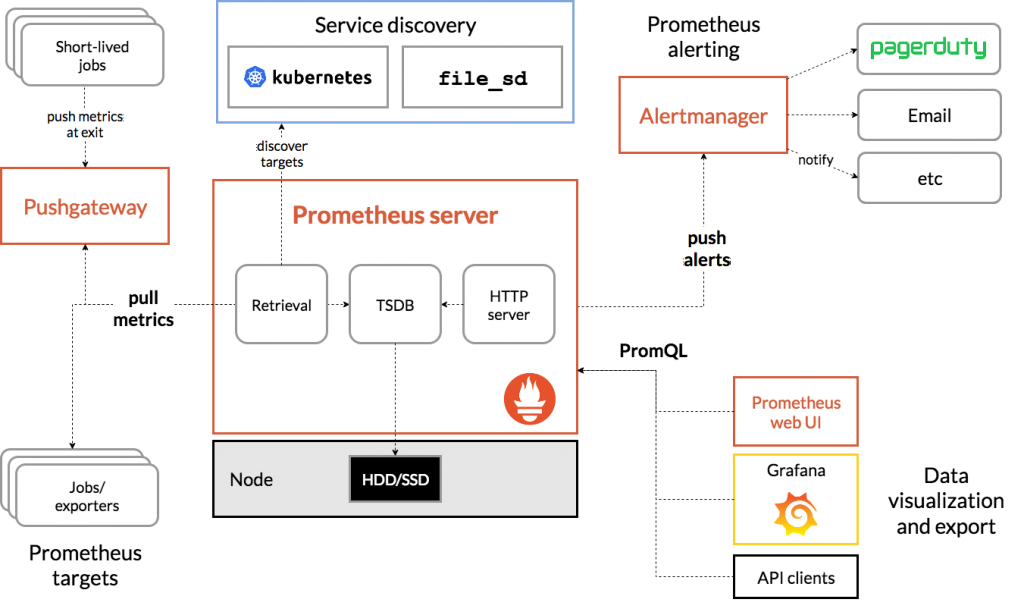
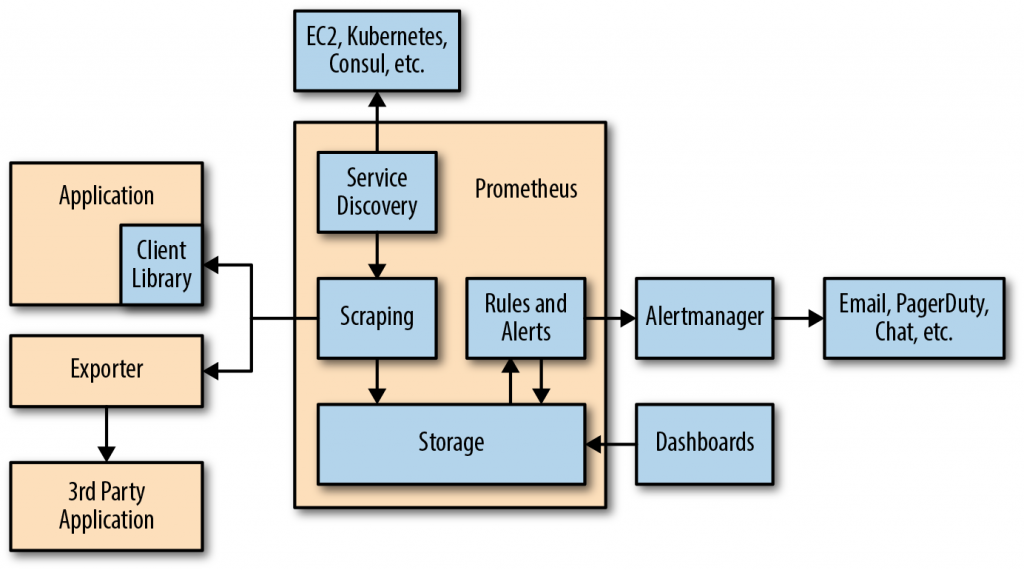
What are the Prometheus Components?
A typical monitoring platform with Prometheus is composed of multiple tools:
- Prometheus server: the main Prometheus server which scrapes and stores time series data
- Client libraries: client libraries for instrumenting application code
- Push gateway: a push gateway for supporting short-lived jobs
- Exporters: special-purpose exporters for services like HAProxy, StatsD, Graphite, etc.
- Alertmanager: an alertmanager to handle alerts
What is PromQL?
Prometheus provides its own query language PromQL (Prometheus Query Language) that lets users select and aggregate data. PromQL is specifically adjusted to work in convention with a Time-Series Database and therefore provides time-related query functionalities. Examples include the rate() function, the instant vector and the range vector which can provide many samples for each queried time series. Prometheus has four clearly defined metric types around which the PromQL components revolve. The four types are
- Gauge
- Counter
- Histogram
- Summary
Prometheus Client libraries
Before you can monitor your application services, you need to add instrumentation to their code via one of the Prometheus client libraries. Client libraries lets you define and expose internal metrics via an HTTP endpoint on your application’s instance. Prometheus Client libraries support multiple programming languages
- Go
- Java or Scala
- Python
- Ruby
- Bash
- C
- C++
- Common Lisp
- Dart
- Elixir
- Erlang
- Haskell
- Lua for Nginx
- Lua for Tarantool
- .NET / C#
- Node.js
- Perl
- PHP
- R
- Rust
Prometheus Push gateway
Occasionally you will need to monitor components which cannot be scraped. The Prometheus Pushgateway allows you to push time series from short-lived service-level batch jobs to an intermediary job which Prometheus can scrape.
The Prometheus Pushgateway exists to allow ephemeral and batch jobs to expose their metrics to Prometheus. Since these kinds of jobs may not exist long enough to be scraped, they can instead push their metrics to a Pushgateway. The Pushgateway then exposes these metrics to Prometheus.
What is Alertmanager?
Configuration for alerts can be specified in Prometheus that specifies a condition that needs to be maintained for a specific duration in order for an alert to trigger. When alerts trigger, they are forwarded to Alertmanager service. Alertmanager can include logic to silence alerts and also to forward them to email, Slack, or notification services such as PagerDuty. Some other messaging systems like Microsoft Teams[29] could be configured using the Alertmanager Webhook Receiver as mechanism for external integrations.
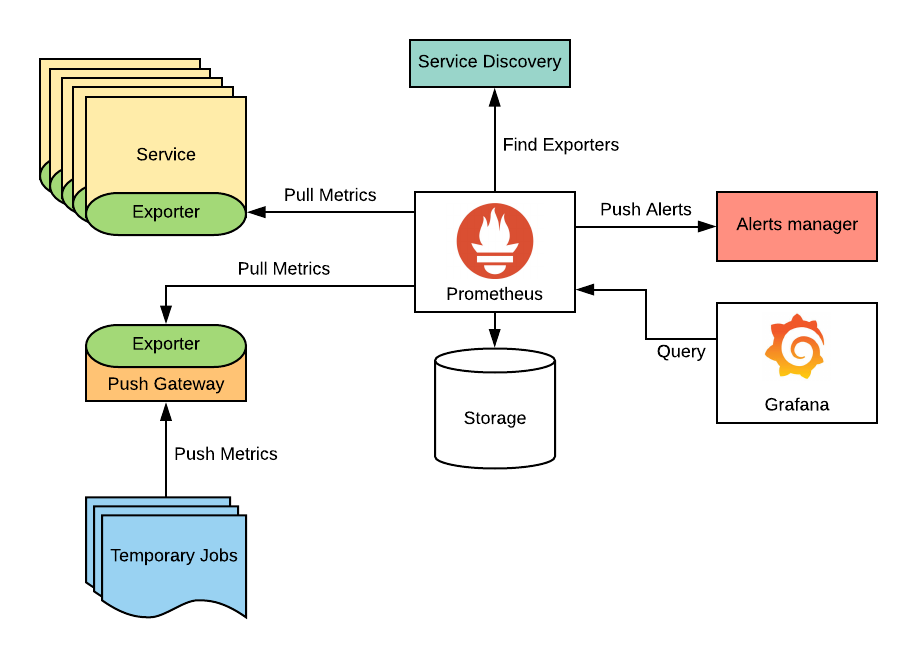
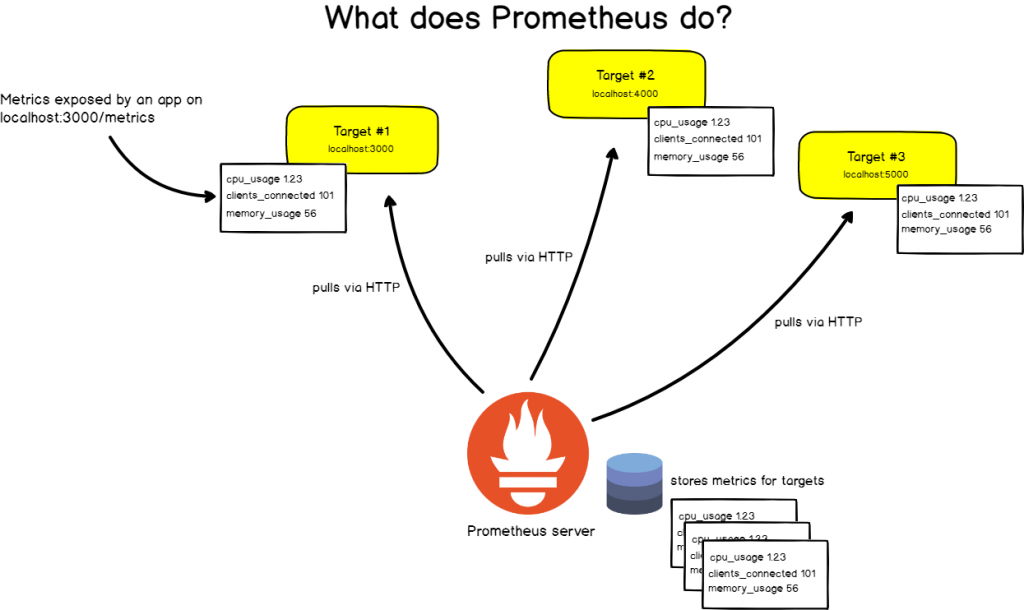
How Prometheus Works?
- Prometheus collects data in the form of time series. The time series are built through a pull model:
- The Prometheus server queries(scrape) a list of data sources (sometimes called exporters) at a specific polling frequency
- Prometheus data is stored in the form of metrics, with each metric having a name that is used for referencing and querying it
- Prometheus stores data locally on disk, which helps for fast data storage and fast querying but ability to store metrics in remote storage.
- Each Prometheus server is standalone, not depending on network storage or other remote services.
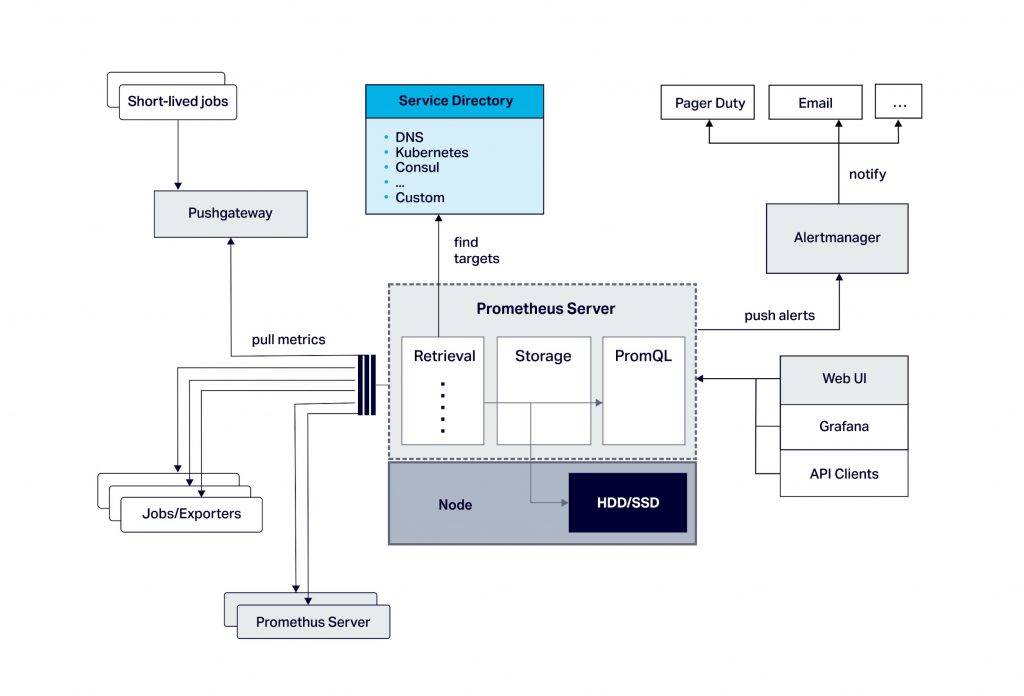
Prometheus Architecutre
FAQ
How does Prometheus collect data?
Prometheus collects metrics from targets by scraping metrics HTTP endpoints. Since Prometheus exposes data in the same manner about itself, it can also scrape and monitor its own health.
What can Prometheus do?
Using Prometheus, you can monitor application metrics like throughput (TPS) and response times of the Kafka load generator (Kafka producer), Kafka consumer, and Cassandra client. Node exporter can be used for monitoring of host hardware and kernel metrics.
Who uses Prometheus?
Who uses Prometheus? 580 companies reportedly use Prometheus in their tech stacks, including Uber, Slack, and Robinhood. Digital Ocean, Ericsson, CoreOS, Weaveworks, Red Hat, and Google.
What is the difference between Grafana and Prometheus?
Grafana is only a visualization solution. Time series storage is not part of its core functionality. … The way Prometheus stores time series is the best by far (thanks to its dimensional model, which uses key-value tagging along the time series to better organize the data and offer strong query capabilities)
Where is Prometheus data stored?
Prometheus stores its on-disk time series data under the directory specified by the flag storage. local. path . The default path is ./data (relative to the working directory), which is good to try something out quickly but most likely not what you want for actual operations.

- DevOps Certified Professionals (DCP)
- Site Reliability Engineering Certified Professionals (SRECP)
- Master in DevOps Engineering (MDE)
- DevSecOps Certified Professionals (DSOCP)
URL - https://www.devopsschool.com/certification/
My Linkedin - https://www.linkedin.com/in/rajeshkumarin
- Apache Lucene Query Example - April 8, 2024
- Google Cloud: Step by Step Tutorials for setting up Multi-cluster Ingress (MCI) - April 7, 2024
- What is Multi-cluster Ingress (MCI) - April 7, 2024