
The expression browser is available at /graph on the Prometheus server, allowing you to enter any expression and see its result either in a table or graphed over time.
This is primarily useful for ad-hoc queries and debugging. For graphs, use Grafana or Console templates.
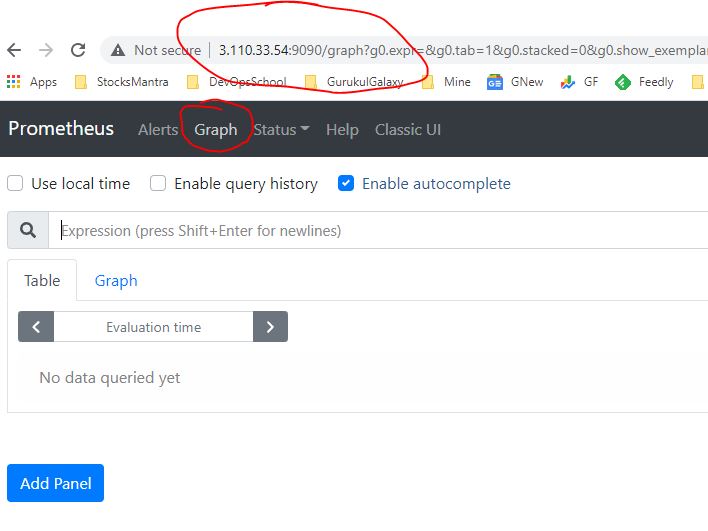
Using the expression browser
As you can gather from localhost:9090/metrics, one metric that Prometheus exports about itself is named prometheus_target_interval_length_seconds (the actual amount of time between target scrapes). Enter the below into the expression console and then click "Execute":

-------------------------------------------
prometheus_target_interval_length_seconds
-------------------------------------------

This should return a number of different time series (along with the latest value recorded for each), each with the metric name prometheus_target_interval_length_seconds, but with different labels. These labels designate different latency percentiles and target group intervals.

If we are interested only in 99th percentile latencies, we could use this query:

-------------------------------------------
prometheus_target_interval_length_seconds{quantile="0.99"}
-------------------------------------------

To count the number of returned time series, you could write:

-------------------------------------------
count(prometheus_target_interval_length_seconds)
-------------------------------------------

Code language: JavaScript (javascript)
Using the graphing interface
To graph expressions, navigate to http://localhost:9090/graph and use the "Graph" tab.

For example, enter the following expression to graph the per-second rate of chunks being created in the self-scraped Prometheus:

-------------------------------------------
rate(prometheus_tsdb_head_chunks_created_total[1m])
-------------------------------------------


Experiment with the graph range parameters and other settings.Code language: JavaScript (javascript)
Configure Prometheus to monitor the sample targets such as Node Exporter
Example queries that aggregate over thousands
Though not a problem in our example, queries that aggregate over thousands of time series can get slow when computed ad-hoc. To make this more efficient, Prometheus can prerecord expressions into new persisted time series via configured recording rules. Let's say we are interested in recording the per-second rate of cpu time (node_cpu_seconds_total) averaged over all cpus per instance (but preserving the job, instance and mode dimensions) as measured over a window of 5 minutes. We could write this as:

-------------------------------------------
avg by (job, instance, mode) (rate(node_cpu_seconds_total[5m]))
-------------------------------------------

Code language: JavaScript (javascript)
I’m Rajesh Kumar, a DevOps, SRE, DevSecOps, Cloud, and Platform Engineering expert passionate about sharing practical knowledge, real-world experiences, and industry best practices. I have worked at Cotocus and regularly write about technology, travel, investing, health, product reviews, and digital marketing through my various platforms.
I publish technical articles at DevOps School, travel stories at Holiday Landmark, stock market insights at Stocks Mantra, health and fitness guidance at My Medic Plus, product reviews at TrueReviewNow, and SEO and digital marketing strategies at Wizbrand.
Find Trusted Cardiac Hospitals
Compare heart hospitals by city and services — all in one place.
Explore Hospitals