There are 3 importants components to make sure Prometheus is up and running. We need to install and configure
- Prometheus Server,
- Node Exporter, and
- Dashborad which can be PromDash or Grafana.
Prerequisite
Prometheus Errors & Solution
https://www.scmgalaxy.com/tutorials/prometheus-errors-solution
Install and configure Prometheus Server 3.11.2 in Ubuntu
cd /opt
wget https://github.com/prometheus/prometheus/releases/download/v3.11.2/prometheus-3.11.2.linux-amd64.tar.gz
tar -zxvf prometheus-3.11.2.linux-amd64.tar.gz
mv prometheus-3.11.2.linux-amd64 prometheus
cd prometheus
nohup ./prometheus > prometheus.log 2>&1 &
ps -eaf | grep prometheusCode language: JavaScript (javascript)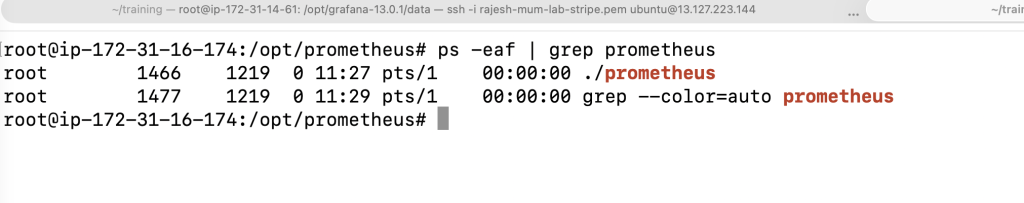
How to setup Node Exporter for collecting Linux metrics?
cd /opt/
wget https://github.com/prometheus/node_exporter/releases/download/v1.11.1/node_exporter-1.11.1.linux-amd64.tar.gz
tar -zxvf node_exporter-1.11.1.linux-amd64.tar.gz
mv node_exporter-1.11.1.linux-amd64 node_exporter
cd node_exporter
nohup ./node_exporter > node_exporter.log 2>&1 &
ps -eaf | grep node_exporterCode language: JavaScript (javascript)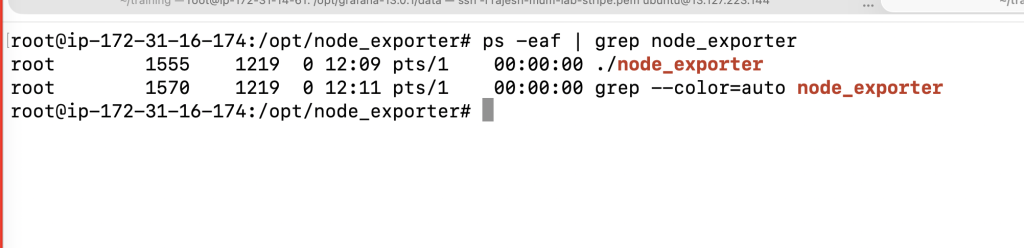
Install and configure Prometheus Server in RHEL 7
Download Prometheus Server Package
Download Prometheus from https://prometheus.io/download/. You can find 3 Prometheus package which is supported for darwin/linux and windows.

$ sudo -s
$ yum install wget -y
$ cd /opt/
$ wget https://github.com/prometheus/prometheus/releases/download/v2.28.1/prometheus-2.28.1.linux-amd64.tar.gz
$ tar -zxvf prometheus-2.28.1.linux-amd64.tar.gz
$ cd prometheus-2.28.1.linux-amd64

If you find following files....

$ ls -1
LICENSE
NOTICE
console_libraries
consoles
prometheus
prometheus.yml
promtool

# Verify the installation by typing in the following command:

$ ./prometheus --version
prometheus, version 2.3.2 (branch: HEAD, revision: 71af5e29e815795e9dd14742ee7725682fa14b7b)
build user: root@5258e0bd9cc1
build date: 20180712-14:02:52
go version: go1.10.3Code language: PHP (php)
Starting Prometheus Server
Enter the directory where you installed the Prometheus server:

$ cd prometheus-2.28.1.linux-amd64

# Before you start Prometheus, you must first understand a configuration file for it called prometheus.yml.

$ more prometheus.ymlCode language: PHP (php)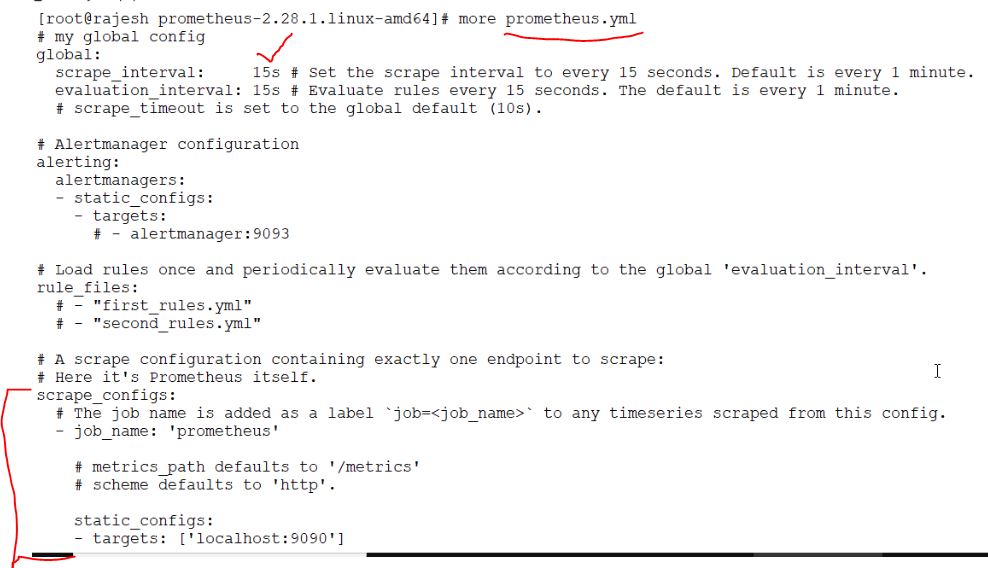
Whereas, This creates a scrape_configs section and defines a job called node. It includes the URL of your Node Exporter’s web interface in its array of targets. The scrape_interval is set to 15 seconds so that Prometheus scrapes the metrics once every fifteen seconds.
You could name your job anything you want, but calling it “node” allows you to use the default console templates of Node Exporter. Save the file and exit.
Start the Prometheus server as a background process.
# Start the Prometheus server as a background process.
$ nohup ./prometheus > prometheus.log 2>&1 &
# You can view the last few lines of the file using the tail command:
$ tail prometheus.log
Once the server is ready, you will see the following messages in the file:
level=info ts=2018-08-21T11:47:38.56459183Z caller=web.go:415 component=web msg=”Start listening for connections” address=0.0.0.0:9090
level=info ts=2018-08-21T11:47:38.569742672Z caller=main.go:543 msg=”TSDB started”
level=info ts=2018-08-21T11:47:38.569767659Z caller=main.go:603 msg=”Loading configuration file” filename=prometheus.yml
level=info ts=2018-08-21T11:47:38.57069388Z caller=main.go:629 msg=”Completed loading of configuration file” filename=prometheus.yml
level=info ts=2018-08-21T11:47:38.570724527Z caller=main.go:502 msg=”Server is ready to receive web requests.
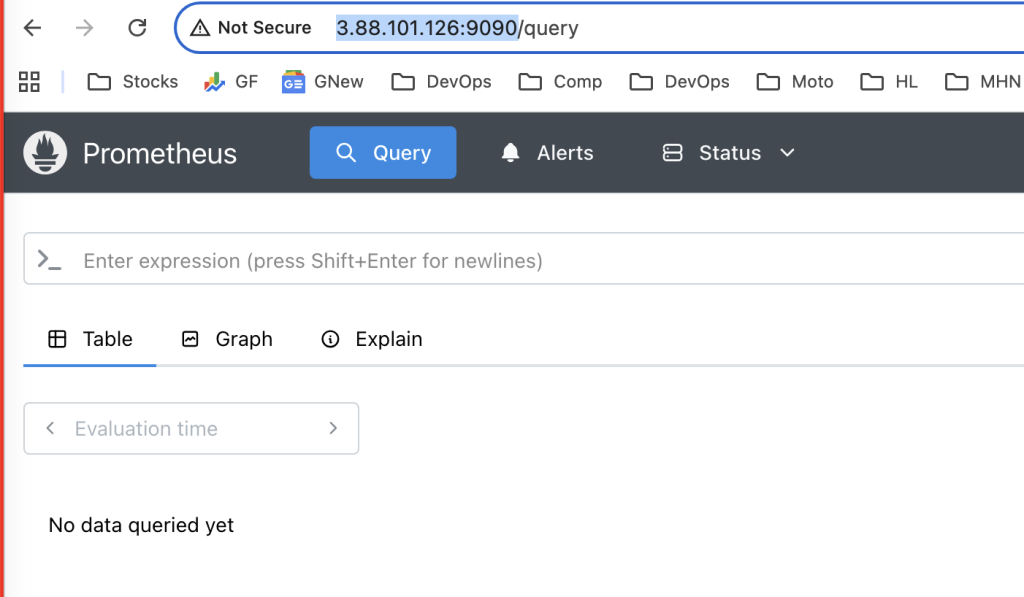
Use a browser to visit Prometheus’s homepage available at http://your_server_ip:9090. You’ll see the following homepage.Code language: PHP (php)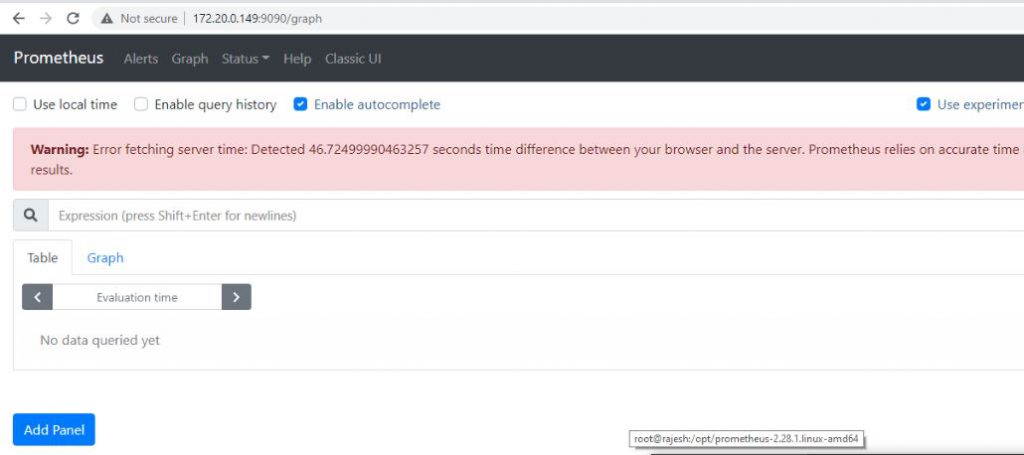
Verify Prometheus Server
To make sure that Prometheus server is scraping data from Node Exporter, click on the Graph tab at the top of the page. On the page that opens, type in the name of a metric (like up, for example) in the text field that says Expression. Then, press the blue Execute button. Click Graph (next to Console) just below, and you should see a graph for that metric:
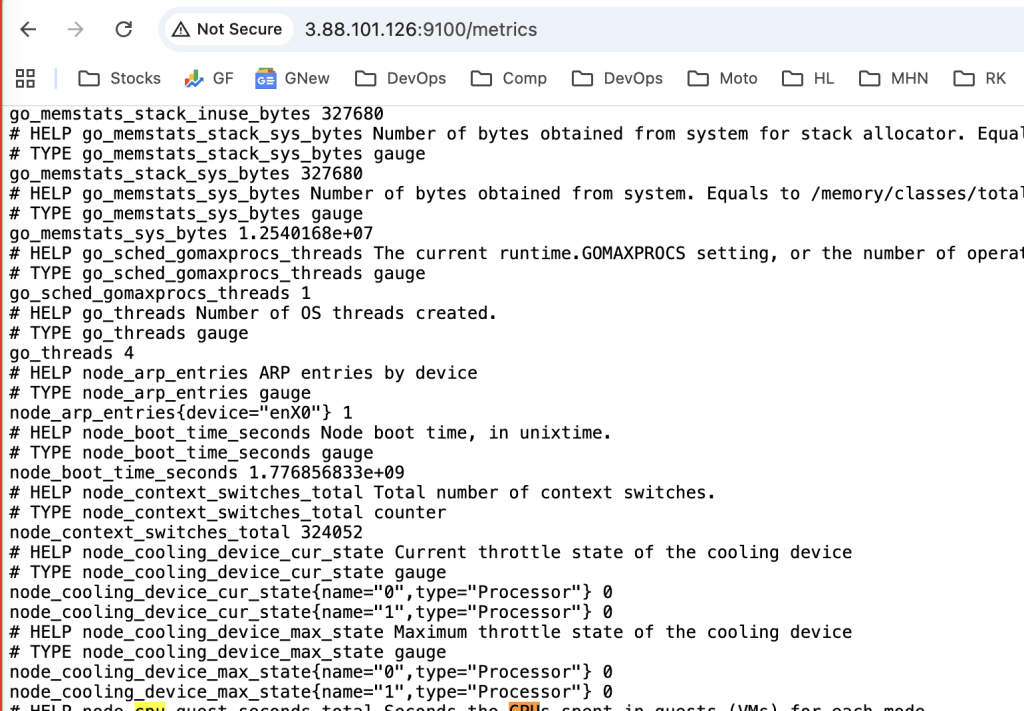
More metric can be found from the Node Exporter host such as
http://X.X.X.X:9100/metrics
Prometheus has console templates that let you view graphs of a few commonly used metrics. These console template are accessible only if you set the value of job_name to "prometheus" in Prometheus's configuration.
Visit http://your_server_ip:9090/consoles/prometheus.html to access the Node Console and click on your server, localhost:9100, to view its metrics.Code language: JavaScript (javascript)Prometheus Reload Configuration without command line restart
# Option 1
$ curl -i -XPOST localhost:9090/-/reload #  (when the --web.enable-lifecycle flag is enabled).

# Option 2
$ killall -HUP prometheus

# Option 3
$ sudo systemctl daemon-reload	#  (when the --web.enable-lifecycle flag is enabled).

# Option 4
$ sudo systemctl restart prometheus

Code language: PHP (php)
How to Run Prometheus server as a Service?
Install and configure Prometheus Node Exporter in All Linux
In order to monitor the metrics of your RHEL server, you should install a tool called Node Exporter. Node Exporter, as its name suggests, exports lots of metrics (such as disk I/O statistics, CPU load, memory usage, network statistics, and more) in a format Prometheus understands.
$ cd /opt/
$ wget https://github.com/prometheus/node_exporter/releases/download/v1.1.2/node_exporter-1.1.2.linux-amd64.tar.gz
$ tar -zxvf node_exporter-1.1.2.linux-amd64.tar.gz
$ cd node_exporter-1.1.2.linux-amd64
$ nohup ./node_exporter &

# Verify node_exporter
$ curl http://localhost:9100/metrics
$ curl http://localhost:9100/metrics | grep "node_"Code language: PHP (php)
Running Node Exporter as a Service (Optional)
If you want to Running Node Exporter as a Service
$ sudo vi /etc/systemd/system/node_exporter.service

[Unit]
Description=Node Exporter
Wants=network-online.target
After=network-online.target

[Service]
User=root
Group=root
Type=simple
ExecStart=/root/prometheus/node_exporter/node_exporter

[Install]
WantedBy=multi-user.target

# Save the file and exit the text editor.

# Reload systemd so that it reads the configuration file you just created.

$ sudo systemctl daemon-reload

# Enable it so that it starts automatically at boot time.

$ sudo systemctl enable node_exporter.service

You can now either reboot your server, or use the following command to start the service manually:

$ sudo systemctl start node_exporter.service
Code language: PHP (php)
Once it starts, use a browser to view Node Exporter’s web interface, which is available at http://your_server_ip:9100/metrics. You should see a page with a lot of text:
Configuring Node Exporter with Prometheus instances
vi prometheus.yml

# Add following Job spec in prometheus.yml under scrape_configs
scrape_configs:
- job_name: node
  static_configs:
  - targets: ['localhost:9100']

Metrics specific to the Node Exporter are prefixed with node_ and include metrics like node_cpu_seconds_total and node_exporter_build_info.Code language: CSS (css)Block port 9100 externally, but leave it open internally for localhost.
$ iptables -A INPUT -p tcp -s localhost --dport 9100 -j ACCEPT
$ iptables -A INPUT -p tcp --dport 9100 -j DROP
$ iptables -LI’m Rajesh Kumar, a DevOps, SRE, DevSecOps, Cloud, and Platform Engineering expert passionate about sharing practical knowledge, real-world experiences, and industry best practices. I have worked at Cotocus and regularly write about technology, travel, investing, health, product reviews, and digital marketing through my various platforms.
I publish technical articles at DevOps School, travel stories at Holiday Landmark, stock market insights at Stocks Mantra, health and fitness guidance at My Medic Plus, product reviews at TrueReviewNow, and SEO and digital marketing strategies at Wizbrand.
Find Trusted Cardiac Hospitals
Compare heart hospitals by city and services — all in one place.
Explore Hospitals
Helpful and well-structured guide for setting up Prometheus and Node Exporter on RHEL. The steps are clear, practical, and great for beginners starting with monitoring.