Download & Install Grafana 13.x using TAR
# How to download?
$ cd /opt/
$ wget https://dl.grafana.com/grafana-enterprise/release/13.0.1/grafana-enterprise_13.0.1_24542347077_linux_amd64.tar.gz
$ tar -zxvf grafana-enterprise_13.0.1_24542347077_linux_amd64.tar.gz

# How to start a Grafana?
$ cd /opt/grafana-13.0.1/bin
$ nohup ./grafana server > grafana.log 2>&1 &
$ ps -eaf | grep grafana

Code language: PHP (php)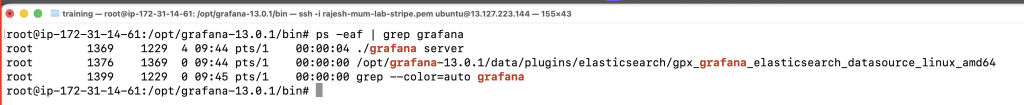
# Understanding default.ini
$ cd /opt/grafana-13.0.1/conf
$ more defaults.iniCode language: PHP (php)
How to access grafana?
http://13.127.223.144:3000/

admin/adminCode language: JavaScript (javascript)
Download & Install Grafana 11.x using TAR
$ cd /opt/
$ wget https://dl.grafana.com/enterprise/release/grafana-enterprise-11.0.0.linux-amd64.tar.gz
$ ls
$ tar -zxvf grafana-enterprise-11.0.0.linux-amd64.tar.gz
$ cd grafana-v11.0.0/
$ cd bin/
$ cd ..
$ ls
$ cd conf/
$ ls
$ more defaults.ini [ its config file for grafana ]
$ ls
$ cd ..
$ cd bin/
$ ls
$ nohup ./grafana-server &
$ tail -f nohup.outCode language: JavaScript (javascript)
Download & Install Grafana 8.x using TAR and RPM
Standalone Linux Binaries(64 Bit)SHA256:
$ cd /opt/
$ wget https://dl.grafana.com/oss/release/grafana-8.1.5.linux-amd64.tar.gz
$ tar -zxvf grafana-8.1.5.linux-amd64.tar.gz
$ cd grafana-8.1.5
$ cd bin
$ nohup ./grafana-server &
$ ps -eaf | grep gra

Red Hat, CentOS, RHEL, and Fedora(64 Bit)SHA256:
$ wget https://dl.grafana.com/oss/release/grafana-8.0.5-1.x86_64.rpm
$ sudo yum install grafana-8.0.5-1.x86_64.rpmCode language: JavaScript (javascript)
Ubuntu and Debian
sudo apt-get install -y adduser libfontconfig1
wget https://dl.grafana.com/oss/release/grafana_8.1.5_amd64.deb
sudo dpkg -i grafana_8.1.5_amd64.debCode language: JavaScript (javascript)
Standalone Linux Binaries(64 Bit)
wget https://dl.grafana.com/oss/release/grafana-8.1.5.linux-amd64.tar.gz
tar -zxvf grafana-8.1.5.linux-amd64.tar.gzCode language: JavaScript (javascript)
Red Hat, CentOS, RHEL, and Fedora(64 Bit)
wget https://dl.grafana.com/oss/release/grafana-8.1.5-1.x86_64.rpm
sudo yum install grafana-8.1.5-1.x86_64.rpmCode language: JavaScript (javascript)
OpenSUSE and SUSE
wget https://dl.grafana.com/oss/release/grafana-8.1.5-1.x86_64.rpm
sudo rpm -i --nodeps grafana-8.1.5-1.x86_64.rpmCode language: JavaScript (javascript)
Download & Install Grafana using YUM Repo (Optional)
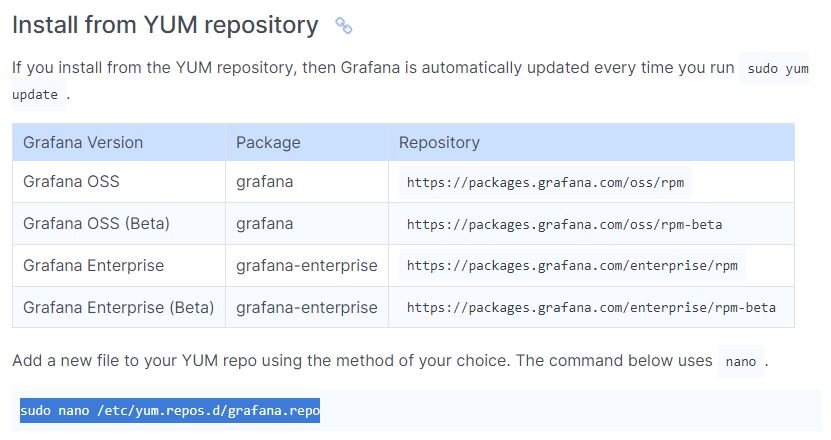
Grafana Version	Package	Repository
Grafana OSS			grafana	https://packages.grafana.com/oss/rpm
Grafana OSS (Beta)		grafana	https://packages.grafana.com/oss/rpm-beta
Grafana Enterprise		grafana-enterprise	https://packages.grafana.com/enterprise/rpm
Grafana Enterprise (Beta)	grafana-enterprise	https://packages.grafana.com/enterprise/rpm-beta

Add a new file to your YUM repo using the method of your choice. The command below uses nano.

sudo nano /etc/yum.repos.d/grafana.repo

For Enterprise releases:

[grafana]
name=grafana
baseurl=https://packages.grafana.com/enterprise/rpm
repo_gpgcheck=1
enabled=1
gpgcheck=1
gpgkey=https://packages.grafana.com/gpg.key
sslverify=1
sslcacert=/etc/pki/tls/certs/ca-bundle.crt

For OSS releases:

[grafana]
name=grafana
baseurl=https://packages.grafana.com/oss/rpm
repo_gpgcheck=1
enabled=1
gpgcheck=1
gpgkey=https://packages.grafana.com/gpg.key
sslverify=1
sslcacert=/etc/pki/tls/certs/ca-bundle.crt


Install Grafana with one of the following commands:

$ sudo yum install grafana

# or

$ sudo yum install grafana-enterpriseCode language: PHP (php)
Step 2 – Understand Grafana Installation details in RHEL/CENTOS
Installs binary to /usr/sbin/grafana-server
Copies init.d script to /etc/init.d/grafana-server
Installs binary to /usr/sbin/grafana-server
Copies init.d script to /etc/init.d/grafana-server
Installs default file (environment vars) to /etc/sysconfig/grafana-server
Copies configuration file to /etc/grafana/grafana.ini
Installs systemd service (if systemd is available) name grafana-server.service
The default configuration uses a log file at /var/log/grafana/grafana.log
The default configuration specifies an sqlite3 database at /var/lib/grafana/grafana.dbCode language: JavaScript (javascript)
Step 3 – Start the server (init.d service)
# Start the server with systemd - To start the service and verify that the service has started:

$ sudo systemctl daemon-reload
$ sudo systemctl start grafana-server
$ sudo systemctl status grafana-server

# Configure the Grafana server to start at boot:
$ sudo systemctl enable grafana-server

# Start the server with init.d - To start the service and verify that the service has started:

$ sudo service grafana-server start
$ sudo service grafana-server status

# Configure the Grafana server to start at boot:
$ sudo /sbin/chkconfig --add grafana-serverCode language: PHP (php)
This will start the grafana-server process as the grafana user, which is created during package installation. The default HTTP port is 3000, and default user and group is admin.
Step 4 – Configure the Grafana server to start at boot time
$ sudo /sbin/chkconfig --add grafana-server
$ sudo systemctl enable grafana-server.service
$ systemctl daemon-reload
$ systemctl start grafana-server
$ systemctl status grafana-server
Step 5 – Grafana server Environment file
The systemd service file and init.d script both use the file located at /etc/sysconfig/grafana-server for environment variables used when starting the back-end. Here you can override log directory, data directory and other variables.
Step 6 – Grafana server Log
By default Grafana will log to /var/log/grafana
Step 7 – Grafana Database
The default configuration specifies a sqlite3 database located at /var/lib/grafana/grafana.db. Please backup this database before upgrades.
You can also use MySQL or Postgres as the Grafana database, as detailed on
http://docs.grafana.org/installation/configuration/#database
Step 8 – Grafana configuration
The configuration file is located at /etc/grafana/grafana.ini. Go the Configuration page for details on all those options. You can add following data sources
- Graphite
- InfluxDB
- OpenTSDB
- Prometheus
Step 9 – Server side image rendering
Server side image (png) rendering is a feature that is optional but very useful when sharing visualizations, for example in alert notifications.

$ sudo yum install fontconfig -y
$ sudo yum install freetype* -y
$ sudo yum install urw-fonts -y
Step 10 – Browse the dashboard
http://X.X.X.X.:3000/
Username - admin
Password - adminCode language: JavaScript (javascript)I’m Rajesh Kumar, a DevOps, SRE, DevSecOps, Cloud, and Platform Engineering expert passionate about sharing practical knowledge, real-world experiences, and industry best practices. I have worked at Cotocus and regularly write about technology, travel, investing, health, product reviews, and digital marketing through my various platforms.
I publish technical articles at DevOps School, travel stories at Holiday Landmark, stock market insights at Stocks Mantra, health and fitness guidance at My Medic Plus, product reviews at TrueReviewNow, and SEO and digital marketing strategies at Wizbrand.
Find Trusted Cardiac Hospitals
Compare heart hospitals by city and services — all in one place.
Explore Hospitals
Helpful and well-structured guide for installing and configuring Grafana on RHEL 7. The steps are clear and practical, making it easier for beginners to set up monitoring smoothly.