In the ever-evolving realm of software development, CPU profiling tools remain crucial for pinpointing performance bottlenecks, optimizing code, and ensuring smooth user experiences. Here’s an updated overview of some top contenders in 2024, categorized by their strengths and target audiences:
General-Purpose CPU Profilers:
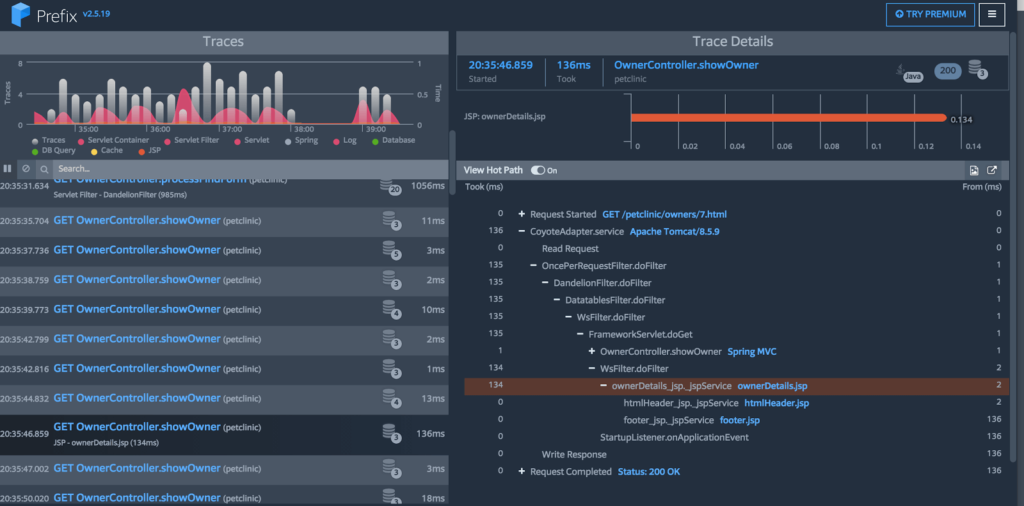
- JProfiler: This mature Java profiler provides comprehensive CPU profiling alongside memory and thread profiling. Its detailed insights and flexible analysis options make it a popular choice for diverse development needs.
- YourKit Java Profiler: Renowned for its deep profiling capabilities and cross-platform support (Java, .NET, and JVM languages), YourKit excels in pinpointing performance issues in complex applications. Its CPU profiling tools offer detailed insights into function execution times and hot paths.
- Scalene: This open-source tool shines in efficient CPU profiling for Python. Its detailed profiling data and clear visualizations help developers identify performance bottlenecks and optimize critical code sections.
Language-Specific CPU Profilers:
- Pyinstrument: This Python profiler offers extensive CPU profiling features, including function execution time analysis, hot path identification, and call stack visualization. Its detailed insights help developers understand the relationship between code execution and CPU usage.
- FlameGraph: This open-source profiling tool visualizes profiling data in a flame graph format, offering a clear overview of function call stacks and CPU consumption hotspots. It supports various languages and integrates with different platforms, making it suitable for diverse environments.
- Allocation Insights: This memory profiler for Ruby also offers CPU profiling capabilities, allowing developers to analyze function execution times and identify performance bottlenecks related to memory allocation and object creation.
Continuous CPU Profiling Tools:
- Pyroscope: This dynamic tool offers real-time CPU profiling for Python applications, allowing developers to monitor CPU usage trends and identify anomalies. Its continuous profiling capabilities make it ideal for proactive performance management and optimization.
- Datadog APM: This comprehensive application performance management platform offers detailed CPU profiling alongside other monitoring features. Its integration with various languages and frameworks makes it a powerful tool for identifying and resolving performance issues across applications.
- jProfiler Continuous Profiling: This extension to JProfiler offers continuous profiling capabilities for Java applications, enabling developers to monitor CPU usage and identify performance trends over time.
Emerging and Specialized Tools:
- DrMemory: This open-source memory profiler for various languages can also be used for CPU profiling, offering detailed insights into function execution times and identifying performance bottlenecks related to memory access patterns.
- Perf: This command-line profiling tool for Linux offers advanced profiling capabilities for various metrics, including CPU usage. While requiring more technical expertise, it provides in-depth insights for performance analysis in specific scenarios.
The best CPU profiling tool for you depends on your specific needs and preferences. Understand these factors when making your choice:
- Programming language(s) used: Choose a tool that supports your development languages.
- Profiling needs: Do you need basic CPU usage snapshots, performance analysis of specific functions, or continuous monitoring?
- Target environment: Are you developing for desktop, web, cloud, or mobile? Choose a tool suitable for your environment.
- Budget: Are you looking for an open-source or paid tool?
- Ease of use: How important is a user-friendly interface and learning curve?
By carefully assessing your needs and exploring the available options, you can select the CPU profiling tool that empowers you to optimize code performance, identify bottlenecks, and deliver a seamless user experience.

Find Trusted Cardiac Hospitals
Compare heart hospitals by city and services — all in one place.
Explore Hospitals