The world of diagramming and visualization tools is booming in 2024, offering a diverse array of options to cater to various needs and skillsets. Here’s a breakdown of some popular categories and their leading contenders:
General-Purpose Diagramming:
- Lucidchart: A versatile and intuitive platform for creating a wide range of diagrams, from flowcharts and wireframes to mind maps and UML diagrams. Offers real-time collaboration, extensive shape libraries, and integrations with popular applications.
- Miro: A virtual whiteboard platform that excels in brainstorming and collaborative diagramming. Offers flexible drawing tools, sticky notes, and pre-built templates for various diagram types.
- Creately: A user-friendly tool with a vast library of shapes and templates for various diagrams. Offers free and paid plans, with features like real-time collaboration and data import/export.
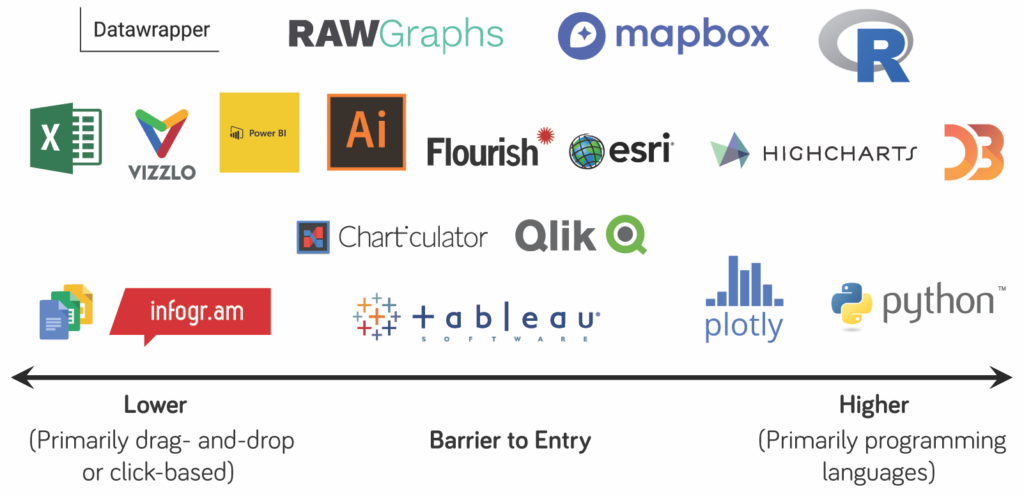
Data Visualization:
- Tableau: A popular choice for interactive data visualization, offering drag-and-drop functionality and a wide range of chart types. Strong data analysis capabilities and integrations with various databases.
- Power BI: Microsoft’s data visualization tool with excellent integration with other Microsoft products. Offers rich visuals, intuitive interface, and strong reporting capabilities.
- Qlik Sense: A self-service BI tool with intuitive data exploration and visualization capabilities. Offers associative search, advanced analytics, and collaboration features.
Specific Diagramming Needs:
- PlantUML: Text-based tool for generating UML diagrams, ideal for developers who prefer a coding approach. Easy to integrate with version control systems and generates clean, professional-looking diagrams.
- Draw.io: A free and open-source tool for creating a wide range of diagrams, with offline functionality and extensive community support. Offers various shapes, connectors, and customization options.
- Figma: Primarily a design platform, but offers collaborative diagramming features for UI/UX design and prototyping. Ideal for design teams and those working on visual interfaces.
Choosing the Right Tool:
- Complexity of diagrams: Consider the level of detail and features needed for your diagrams.
- Data sources and integration: Choose a tool that can connect and visualize data from your specific sources.
- Collaboration needs: Ensure the tool facilitates real-time collaboration if teamwork is essential.
- Technical skills: Evaluate your comfort level with user interfaces and any coding requirements.
- Budget: Free and open-source options exist, while paid plans offer more features and scalability.
The best diagramming and visualization tool empowers you to communicate your ideas clearly and effectively. Explore different options and consider factors like ease of use, feature set, and budget to find the perfect match for your needs.

Find Trusted Cardiac Hospitals
Compare heart hospitals by city and services — all in one place.
Explore Hospitals