Collecting metrics from a Java application using Java Management Extensions (JMX) and Datadog involves several steps, which include setting up JMX in your Java application, configuring Datadog to collect JMX metrics, and finally visualizing and monitoring these metrics within Datadog. Here’s a general guide on how to achieve this:
1. Enable JMX in Your Java Application
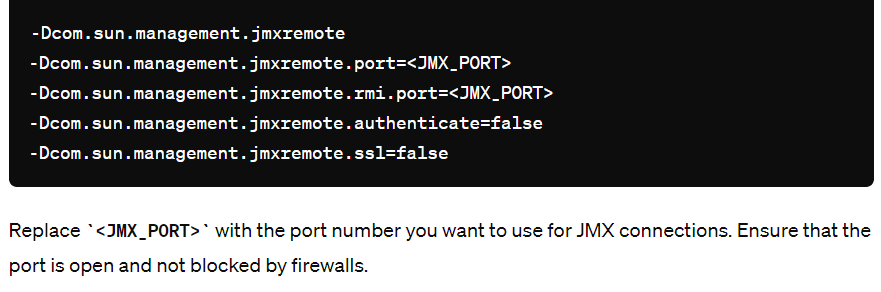
To start collecting JMX metrics, you first need to enable JMX in your Java application. This can usually be done by passing certain system properties to the JVM. For a typical Java application, you can enable JMX by adding the following options to your application startup command:
2. Install and Configure the Datadog Agent
Next, you need to install the Datadog Agent on the host running your Java application. The Datadog Agent is responsible for collecting metrics and sending them to Datadog. If you haven’t already installed the Datadog Agent, you can find the installation instructions on the Datadog official documentation site.
After installing the Datadog Agent, you’ll need to configure it to collect JMX metrics:
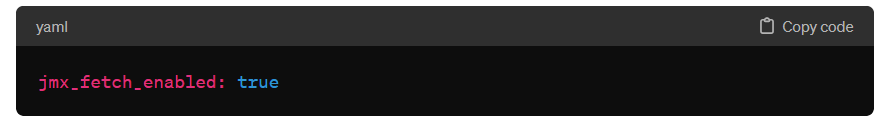
- Enable JMX Fetch: The Datadog Agent uses JMX Fetch to collect metrics from JMX. To enable it, edit the
datadog.yamlconfiguration file (usually located in the/etc/datadog-agentdirectory on Linux) and ensure that JMX Fetch is enabled:
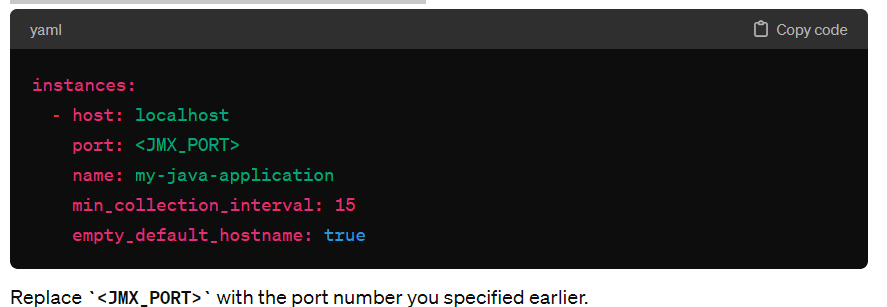
Configure JMX Checks: Create a JMX check configuration file for your Java application. This file specifies which JMX metrics to collect and how often. The configuration file should be placed in the /etc/datadog-agent/conf.d/jmx.d directory (or the equivalent directory based on your installation) and might look something like this:
- Restart the Datadog Agent to apply the changes.
3. Monitor and Visualize Metrics in Datadog
After configuring the Datadog Agent to collect metrics from your Java application, you should start seeing these metrics in Datadog:
- Access the Datadog Dashboard: Log into your Datadog account and navigate to the Dashboard section.
- Create a New Dashboard or Use an Existing One: You can create a custom dashboard to visualize the metrics collected from your Java application. Use the metrics explorer to search for metrics collected via JMX and add them to your dashboard.
- Set Up Alerts: Datadog also allows you to set up alerts based on metric thresholds. This can be useful for monitoring the health and performance of your Java application.
I’m Rajesh Kumar, a DevOps, SRE, DevSecOps, Cloud, and Platform Engineering expert passionate about sharing practical knowledge, real-world experiences, and industry best practices. I have worked at Cotocus and regularly write about technology, travel, investing, health, product reviews, and digital marketing through my various platforms.
I publish technical articles at DevOps School, travel stories at Holiday Landmark, stock market insights at Stocks Mantra, health and fitness guidance at My Medic Plus, product reviews at TrueReviewNow, and SEO and digital marketing strategies at Wizbrand.
Find Trusted Cardiac Hospitals
Compare heart hospitals by city and services — all in one place.
Explore Hospitals