Prometheus Stack
The Prometheus stack typically includes several components that work together to provide comprehensive monitoring and alerting capabilities for your infrastructure and applications. Here’s a table outlining the core components of the Prometheus stack:
| Component | Description |
|---|---|
| Prometheus | Time-series database and monitoring tool that collects and stores metrics from various sources. It serves as the core of the stack. |
| Alertmanager | Handles alerts generated by Prometheus and manages their routing, deduplication, and notification to various alerting channels (e.g., email, Slack). |
| Node Exporter | A Prometheus exporter for collecting hardware and OS-level metrics from individual nodes in your cluster (e.g., CPU, memory, disk usage). |
| Exporters (e.g., Prometheus Blackbox Exporter, SNMP Exporter) | Exporters are small applications that expose metrics in a format Prometheus can scrape. They are used to collect specialized metrics from various services and systems. |
| Grafana | A popular open-source dashboard and visualization platform that integrates with Prometheus to create and display custom dashboards and graphs. |
| Pushgateway | Allows for the collection of metrics from batch jobs or other short-lived processes that cannot be scraped directly by Prometheus. It acts as an intermediary between these jobs and Prometheus. |
| Prometheus Operator | An operator that simplifies the management and operation of Prometheus, Alertmanager, and related resources in Kubernetes clusters. |
| Thanos (Optional) | An extension to Prometheus that provides long-term storage, global query view, and horizontal scalability for Prometheus. It’s often used for large-scale or federated deployments. |
Methods of Prometheus Deployment in Kubernetes
1. Prometheus Operator
The Prometheus Operator uses Kubernetes custom resources to simplify the deployment and configuration of Prometheus, Alertmanager, and related monitoring components.
URL – https://github.com/prometheus-operator/prometheus-operator
2. kube-prometheus
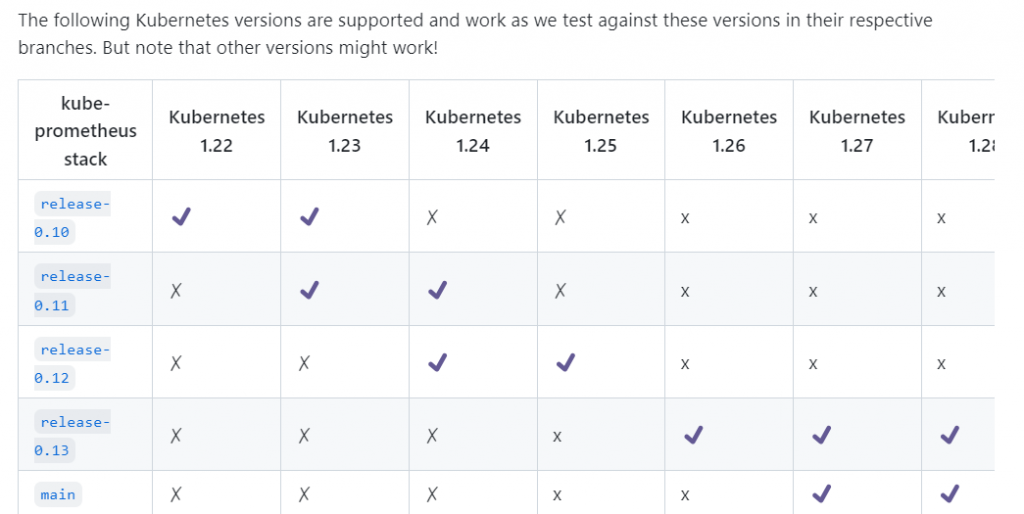
kube-prometheus provides example configurations for a complete cluster monitoring stack based on Prometheus and the Prometheus Operator. This includes deployment of multiple Prometheus and Alertmanager instances, metrics exporters such as the node_exporter for gathering node metrics, scrape target configuration linking Prometheus to various metrics endpoints, and example alerting rules for notification of potential issues in the cluster.
URL – https://github.com/prometheus-operator/kube-prometheus
3. helm chart
The prometheus-community/kube-prometheus-stack helm chart provides a similar feature set to kube-prometheus. This chart is maintained by the Prometheus community. For more information, please see the chart’s readme
URL – https://github.com/prometheus-community/helm-charts/tree/main/charts/kube-prometheus-stack
4. kube-prometheus
If you want the whole stack, you must try kube-prometheus. This Components included in this package:
- The Prometheus Operator
- Highly available Prometheus
- Highly available Alertmanager
- Prometheus node-exporter
- Prometheus Adapter for Kubernetes Metrics APIs
- kube-state-metrics
- Grafana
URL – https://github.com/prometheus-operator/kube-prometheus
$ git clone https://github.com/prometheus-operator/kube-prometheus
$ cd kube-prometheus
$ ls manifests/setup/
$ kubectl apply --server-side -f manifests/setup
$ kubectl wait --for condition=Established --all CustomResourceDefinition --namespace=monitoring
$ kubectl apply -f manifests/
$ kubectl get ns
$ kubectl get all -n monitoring
$ kubectl patch svc grafana --type='json' -p '[{"op":"replace","path":"/spec/type","value":"NodePort"}]' -nmonitoring
$ kubectl get all -n monitoring
$ kubectl --namespace monitoring port-forward  --address 0.0.0.0 svc/grafana 3000

http://34.207.57.210:3000/
admin
admin
Prometheus STACK Deployment Using Kube Prometheus

Prometheus & Grafana Deployment Using Helm Chart
Configure Data Sources and Dashboards in Grafana
- Log in to Grafana using the default credentials (admin/admin).
- Add Prometheus as a data source:
- Click on the gear icon (⚙️) in the left sidebar.
- Select “Data Sources.”
- Click on “Add data source.”
- Choose “Prometheus.”
- Configure the Prometheus URL (http://prometheus-server.monitoring.svc.cluster.local) and save.
- Import or create dashboards in Grafana to visualize your Kubernetes cluster’s metrics. You can find pre-built dashboards for Kubernetes and Prometheus in the Grafana dashboard marketplace.
Reference
- https://prometheus-operator.dev/
- https://grafana.com/docs/grafana-cloud/monitor-infrastructure/kubernetes-monitoring/configuration/configure-infrastructure-manually/prometheus/prometheus-operator/
I’m a DevOps/SRE/DevSecOps/Cloud Expert passionate about sharing knowledge and experiences. I have worked at Cotocus. I share tech blog at DevOps School, travel stories at Holiday Landmark, stock market tips at Stocks Mantra, health and fitness guidance at My Medic Plus, product reviews at TrueReviewNow , and SEO strategies at Wizbrand.
Do you want to learn Quantum Computing?
Please find my social handles as below;
Rajesh Kumar Personal Website
Rajesh Kumar at YOUTUBE
Rajesh Kumar at INSTAGRAM
Rajesh Kumar at X
Rajesh Kumar at FACEBOOK
Rajesh Kumar at LINKEDIN
Rajesh Kumar at WIZBRAND
Find Trusted Cardiac Hospitals
Compare heart hospitals by city and services — all in one place.
Explore Hospitals