How to install Install Docker
Configure docker for exposing a Metrices at end point
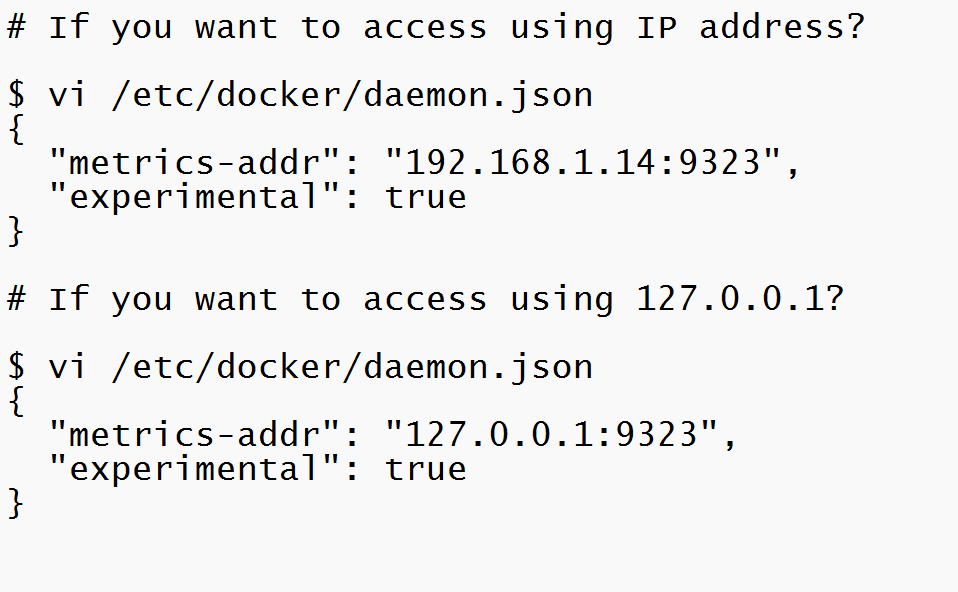
To configure the Docker daemon as a Prometheus target, you need to specify the metrics-address. The best way to do this is via the daemon.json, which is located at one of the following locations by default. If the file does not exist, create it.
Linux: /etc/docker/daemon.json
Windows Server: C:\ProgramData\docker\config\daemon.json
Docker Desktop for Mac / Docker Desktop for Windows: Click the Docker icon in the toolbar, select Preferences, then select Daemon. Click Advanced.
Code language: JavaScript (javascript)
If the file is currently empty, paste the following:
{
"metrics-addr" : "127.0.0.1:9323",
"experimental" : true
}Code language: PHP (php)Save the file, or in the case of Docker Desktop for Mac or Docker Desktop for Windows, save the configuration. Restart Docker.
$ sudo systemctl restart docker
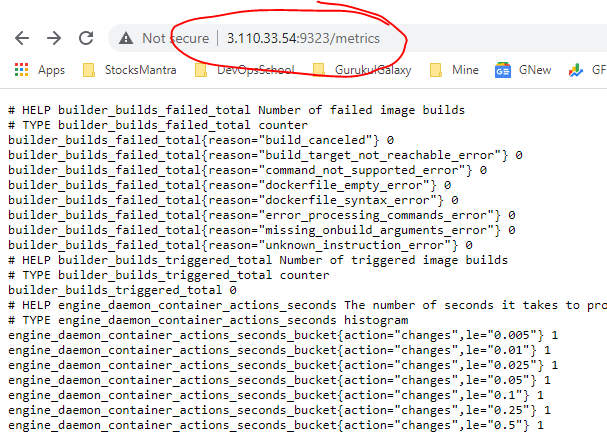
Docker now exposes Prometheus-compatible metrics on port 9323.
Configure and run Prometheus
# my global config
global:
  scrape_interval:     15s # Set the scrape interval to every 15 seconds. Default is every 1 minute.
  evaluation_interval: 15s # Evaluate rules every 15 seconds. The default is every 1 minute.
  # scrape_timeout is set to the global default (10s).

  # Attach these labels to any time series or alerts when communicating with
  # external systems (federation, remote storage, Alertmanager).
  external_labels:
      monitor: 'codelab-monitor'

# Load rules once and periodically evaluate them according to the global 'evaluation_interval'.
rule_files:
  # - "first.rules"
  # - "second.rules"

# A scrape configuration containing exactly one endpoint to scrape:
# Here it's Prometheus itself.
scrape_configs:
  # The job name is added as a label `job=<job_name>` to any timeseries scraped from this config.
  - job_name: 'prometheus'

    # metrics_path defaults to '/metrics'
    # scheme defaults to 'http'.

    static_configs:
      - targets: ['localhost:9090']

  - job_name: 'docker'
         # metrics_path defaults to '/metrics'
         # scheme defaults to 'http'.

    static_configs:
      - targets: ['localhost:9323']Code language: PHP (php)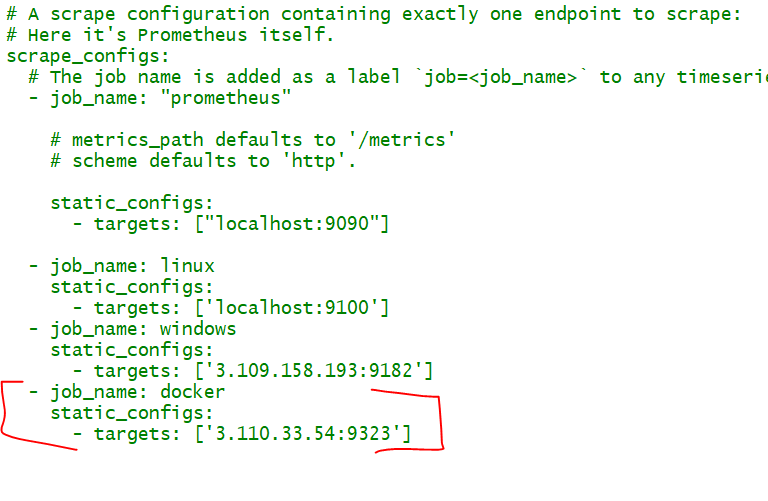
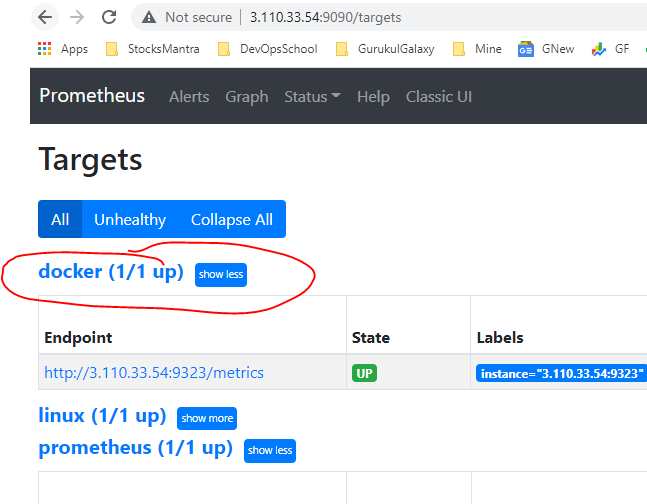
Verify that the Docker target is listed at http://localhost:9090/targets/.
Use Prometheus for Swarm only
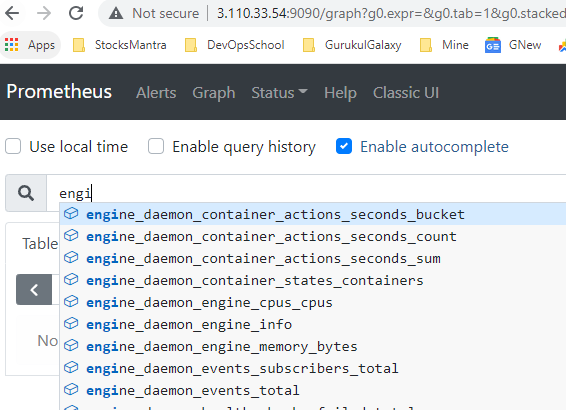
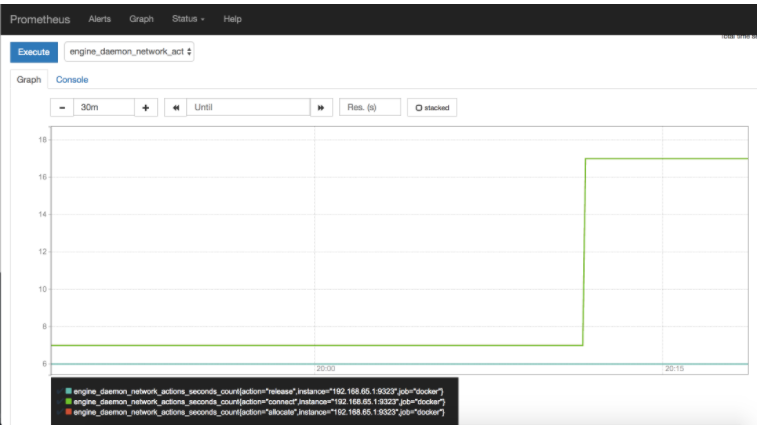
Create a graph. Click the Graphs link in the Prometheus UI. Choose a metric from the combo box to the right of the Execute button, and click Execute. The screenshot below shows the graph for
engine_daemon_network_actions_seconds_count.
The above graph shows a pretty idle Docker instance. Your graph might look different if you are running active workloads.
To make the graph more interesting, create some network actions by starting a service with 10 tasks that just ping Docker non-stop (you can change the ping target to anything you like):
$ docker service create –replicas 10 –name ping_service alpine ping docker.com
Wait a few minutes (the default scrape interval is 15 seconds) and reload your graph.
When you are ready, stop and remove the ping_service service, so that you are not flooding a host with pings for no reason.
docker service remove ping_service
Wait a few minutes and you should see that the graph falls back to the idle level.
How to secure Prometheus Docker Endpoint after enabling through metrics-addr in daemon.json
[Experiment – NOT Tested]
If you need to access the Docker daemon remotely, you need to enable the tcp Socket. Beware that the default setup provides un-encrypted and un-authenticated direct access to the Docker daemon – and should be secured either
- Using the built in HTTPS encrypted socket, or
- By putting a secure web proxy in front of it.
If you need to access the Docker daemon remotely, you need to enable the tcp Socket. Beware that the default setup provides un-encrypted and un-authenticated direct access to the Docker daemon – and should be secured either using the built in HTTPS encrypted socket, or by putting a secure web proxy in front of it.
Note: If you’re using an HTTPS encrypted socket, keep in mind that only TLS1.0 and greater are supported. Protocols SSLv3 and under are not supported anymore for security reasons.
Method 1 – Protect or Secure the Docker daemon socket
https://docs.docker.com/engine/security/https/
https://docs.docker.com/config/daemon/
https://docs.docker.com/engine/security/https/
https://gist.github.com/kekru/b9e4da822514df93e6fdf2f7d3d90d8a
Method 2 – secure web proxy
One option to help secure our Prometheus server is to put it behind a reverse proxy so that we can later add SSL and an Authentication layer over the default unrestricted Prometheus web interface.
Example of daemon.json
{
  "metrics-addr" : "127.0.0.1:9323",
  "experimental" : true
}
Code language: JSON / JSON with Comments (json)
We will use Nginx.
$ sudo apt install nginx
# CD to the Nginx sites-enabled folder
cd /etc/nginx/sites-enabled
# Create a new Nginx configuration from Prometheus
$ sudo nano prometheus
And copy/paste the example below
server {
    listen       443;

    location / {
        proxy_pass           http://localhost:9323/;
    }
}
# Save and restart Nginx
$ sudo service nginx restart
$ sudo service nginx status
Code language: PHP (php)I’m Rajesh Kumar, a DevOps, SRE, DevSecOps, Cloud, and Platform Engineering expert passionate about sharing practical knowledge, real-world experiences, and industry best practices. I have worked at Cotocus and regularly write about technology, travel, investing, health, product reviews, and digital marketing through my various platforms.
I publish technical articles at DevOps School, travel stories at Holiday Landmark, stock market insights at Stocks Mantra, health and fitness guidance at My Medic Plus, product reviews at TrueReviewNow, and SEO and digital marketing strategies at Wizbrand.
Find Trusted Cardiac Hospitals
Compare heart hospitals by city and services — all in one place.
Explore Hospitals