In 2024, the performance monitoring landscape is rich with diverse options, each catering to specific needs and offering unique advantages. Here’s a glimpse into some popular categories and notable tools:
Application Performance Monitoring (APM):
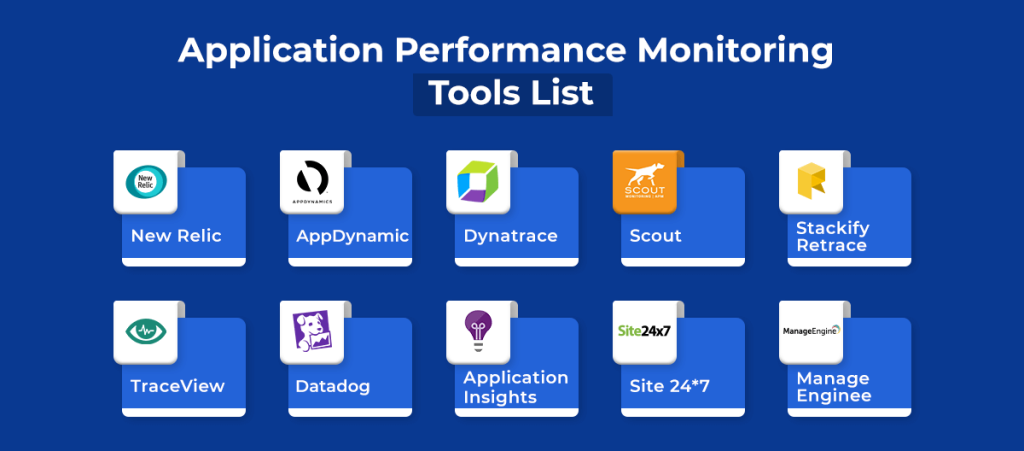
- Datadog: A versatile platform for monitoring application performance, infrastructure metrics, and user experience. Offers real-time dashboards, AI-powered insights, and customizable alerts.
- Dynatrace: Provides AI-driven application monitoring across various environments, including cloud, hybrid, and microservices. Focuses on automatic root cause analysis and proactive issue detection.
- New Relic: A comprehensive web-based tool for monitoring full-stack applications, infrastructure, and user experience. Offers real-time insights, code-level analysis, and integrations with popular development tools.
Infrastructure Monitoring:
- Prometheus: A popular open-source tool for monitoring system metrics and events. Offers flexible querying and alerting capabilities, integrates well with Grafana for visualization.
- Nagios: A mature platform for monitoring infrastructure health and performance. Features extensive alerting options, plugins for various services, and strong community support.
- Datadog Infrastructure Agent: A lightweight agent for collecting metrics and logs from infrastructure components. Integrates seamlessly with the Datadog platform for unified monitoring.
Synthetic Monitoring:
- Pingdom: Simulates user journeys from various locations to monitor website performance and availability. Offers real-time alerts, waterfall charts, and historical performance data.
- Catchpoint: Provides synthetic monitoring with advanced features like multi-step transactions, mobile device emulation, and global monitoring locations.
- Keynote Systems: Offers comprehensive synthetic monitoring for websites, APIs, and mobile apps. Includes real-time dashboards, visual scripting, and advanced performance analysis.
Logging & Analytics:
- ELK Stack (Elasticsearch, Logstash, Kibana): A popular open-source combination for collecting, storing, and analyzing logs. Offers powerful search capabilities and visualization tools.
- Graylog: Another open-source option for log management, featuring customizable dashboards, alerting, and integrations with various systems.
- Splunk: A commercial platform for log management and analytics, offering advanced features like real-time search, anomaly detection, and machine learning insights.
Choosing the right tools depends on your specific needs:
- Consider the scope of your monitoring needs: Are you monitoring applications, infrastructure, or both?
- Evaluate your budget and technical expertise: Some tools are open-source and require technical setup, while others are commercial with managed services.
- Think about your desired features: Do you need real-time monitoring, AI-powered insights, or advanced analytics?
- Look for integrations and compatibility: Ensure the tools work well with your existing systems and tools.
The best approach often involves combining different tools and platforms for comprehensive performance monitoring.

Find Trusted Cardiac Hospitals
Compare heart hospitals by city and services — all in one place.
Explore Hospitals