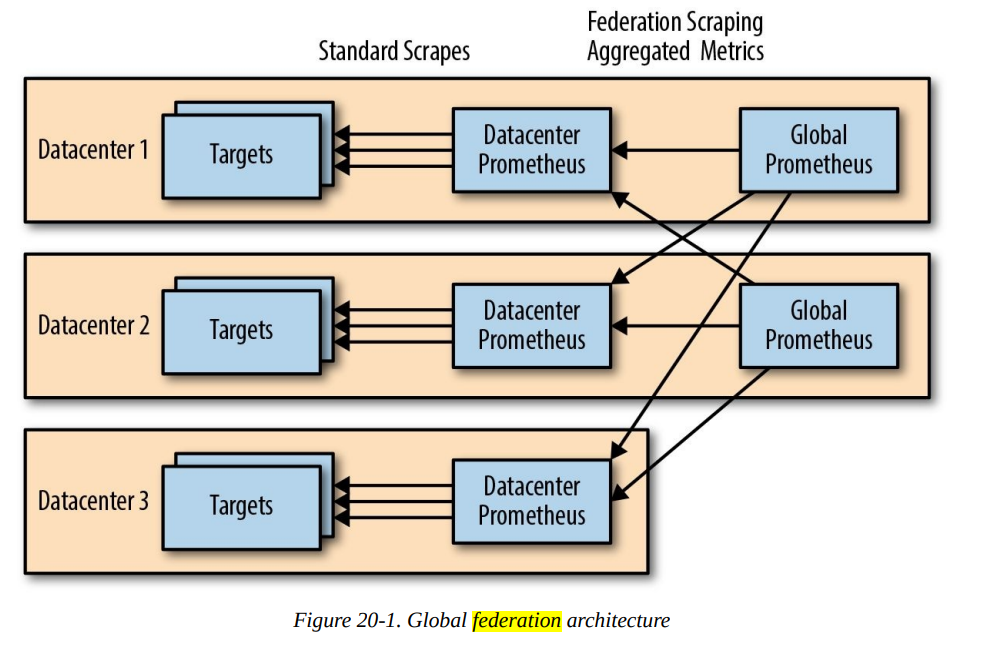
With a Prometheus per datacenter, how do you perform global aggregations? Reliability is a key property of a good monitoring system, and a core value of Prometheus. When it comes to graphing and alerting, you want as few moving parts as possible because a simple system is a reliable system. When you want a graph of application latency in a datacenter you have Grafana talk to the Prometheus in that datacenter that is scraping that application, and similarly for alerting on per-datacenter application latency.
This doesn’t quite work for global latency, since each of your datacenter Prometheus servers only has a part of the data. This is where federation comes in. Federation allows you to have a global Prometheus that pulls aggregated metrics from your datacenter Prometheus servers.
For example, to pull in all metrics aggregated to the job level you could have a
prometheus.yml like:
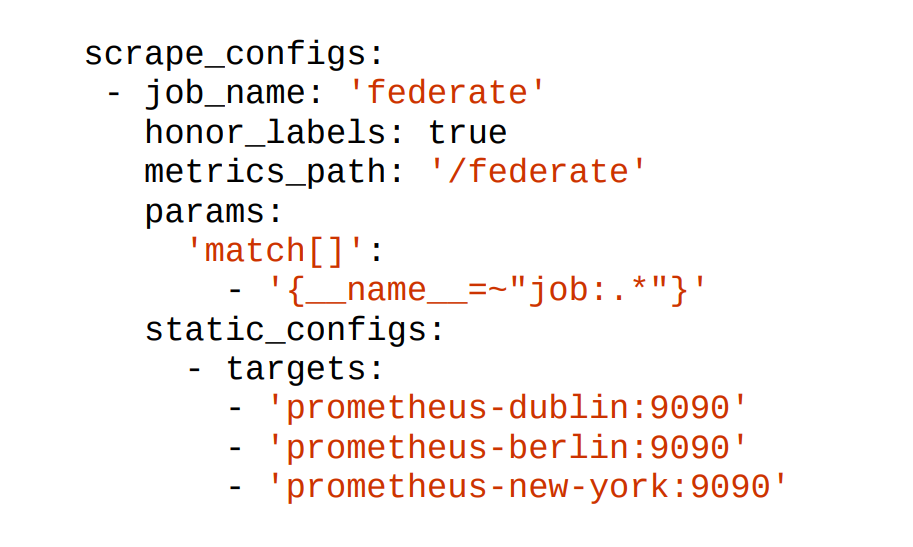
The /federate HTTP endpoint on Prometheus takes a list of selectors (covered in “Selectors”) in match[] URL parameters. It will return all matching time series following instant vector selector semantics, including staleness, as discussed in “Instant Vector”. If you supply multiple match[] parameters, a sample will be returned if it matches any of them. To avoid the aggregated metrics having the instance label of the Prometheus target, honor_labels (which was discussed in “Label Clashes and honor_labels”) is used here.
5 The external labels of the Prometheus (as discussed in “External Labels”) are also added to the federated metrics, so you can tell where each time series came from.
Unfortunately some users use federation for purposes other than pulling in aggregated metrics. To avoid falling into this trap, you should understand the following:
Let me explain why you should not use federation beyond its intended use case. First, for reliability you want to have as few moving parts as is practical, pulling all your metrics over the internet to a global Prometheus from where you can then graph and alert on them means that internet connectivity to another datacenter is now a hard dependency on your per-datacenter monitoring working.
In general, you want to align your failure domains, so that graphing and alerting for a datacenter does not depend on another datacenter being operational. That is, as far as is practical you want the Prometheus that is scraping a set of targets to also be the one sending alerts for that target. This is particularly important if there is a network outage or partition. The second issue is scaling. For reliability, each Prometheus is standalone and running on one machine and thus limited by machine size in terms of how much it can handle. Prometheus is quite efficient, so even limited to a single machine, it is quite plausible for you to have a single Prometheus server monitor an entire datacenter. As you add datacenters you just need to turn up a Prometheus in each of them.
A global Prometheus pulling in only aggregated metrics will have greatly reduced cardinality data to deal with compared with the datacenter Prometheus servers, 6 and thus will prevent bottlenecks. Conversely, if the global Prometheus was pulling in all metrics from each datacenter Prometheus, the global Prometheus would become the bottleneck and greatly limit your ability to scale. Put another way, for federation to scale you need to use the same approach discussed in “Reducing Cardinality” for dashboards.
Thirdly, Prometheus is designed to scrape many thousands of small to medium size targets.7 By spreading the scrapes over the scrape interval, Prometheus can keep up with the data volumes with even load. If you instead have it scrape a handful of targets with massive numbers of time series, such as massive federation endpoints, this can cause load spikes and it may not even be possible
for Prometheus to complete processing of one massive scrape worth of data in time to start the next scrape.
The fourth issue is semantics. By passing all the data through an extra Prometheus, additional race conditions will be introduced. You would see increased artifacts in your graphs, and you would not get the benefit of the staleness handling the semantics. One objection to this architecture is if all your metrics don’t end up in one Prometheus, how will you know which Prometheus contains a given metric?
This turns out not to be an issue in practice. As your Prometheus servers will tend to follow your general architecture, it is usually quite obvious which Prometheus monitors which targets and thus which has a specific metric. For example, Node exporter metrics for Dublin are going to be in the Dublin infrastructure Prometheus. Grafana supports both data source templating and having graphs with metrics from different data sources on them, so this is not an issue for dashboards either. Usually you will only have a two-level federation hierarchy with datacenter Prometheus servers and globals. The global Prometheus will perform calculations with PromQL that you cannot do in a lower-level Prometheus, such as how much traffic you are receiving globally.
It is also possible that you will end up with an additional level. For example, it’s normal to run a Prometheus inside each Kubernetes cluster you have. If you had multiple Kubernetes clusters in a datacenter you might federate their aggregated metrics to a per-datacenter Prometheus before then federating them from there to your global Prometheus. Another use for federation is to pull limited aggregated metrics from another team’s Prometheus. It is polite to ask first, and if this becomes a common or more formal thing, the considerations in “Rules for APIs” may apply. There is no need to do this just for dashboards though, as Grafana supports using multiple data sources in a dashboard and in a panel.
Reference
- Implementing Hierarchical Federation With Prometheus
- Getting started with Prometheus Federation in Docker
- How to Build a Scalable Prometheus Architecture
- Federating Prometheus Effectively
- Prometheus server clustoring using Federation
I’m Rajesh Kumar, a DevOps, SRE, DevSecOps, Cloud, and Platform Engineering expert passionate about sharing practical knowledge, real-world experiences, and industry best practices. I have worked at Cotocus and regularly write about technology, travel, investing, health, product reviews, and digital marketing through my various platforms.
I publish technical articles at DevOps School, travel stories at Holiday Landmark, stock market insights at Stocks Mantra, health and fitness guidance at My Medic Plus, product reviews at TrueReviewNow, and SEO and digital marketing strategies at Wizbrand.
Find Trusted Cardiac Hospitals
Compare heart hospitals by city and services — all in one place.
Explore Hospitals