- What is Grafana?
Grafana is used in allowing visualizing, alerting and exploring metrics where they are stored.It also provides us with the tools used in turning our time series database data in graphs and visualizations.Grafana is an open source analutic and interactive web application and also connects all the supported data.Grafana is written in TypeScript and Go and is divided into Front End and Back End.
2. How do I create a report in Grafana?
Step-by-Step Instruction
- Enter the name of the report in the Report Name field.
- Select the type as a Dashboard to schedule the report. …
- Select the required dashboard from the Select Dashboard drop-down to generate reports.
- Load Time for Dashboard is the time taken for Skedler to evaluate the Grafana Dashboard.
3. What are the features provided by Grafana?
- Visualization – Grafana helps us in viewing and understanding our data easily.
- Alerting – Grafana is used in supporting numerous number of notification channels such as Slack, Pagerduty, etc.
- Annotations – Grafana is used in helping us in annotate or in leaving notes on graphs.
- Open Source – Grafana is used in backing an active vibrant community.
4. What is Grafana Cloud?
Grafana Cloud is used in observing platform, integrating metrics, tracing and logging with the help of Grafana.It is the best open source observability software that consists of Prometheus, Loki and Tempo without installing, maintaining and in scaling our observability stack.
5. How do we edit the link in a slack notification from Grafana?
We can edit notification by adding it to our ini File and use Grafana in building self referential:
_____________________________________-
[server]
# Protocol (http or https)
protocol = http

# The http port  to use
https_port = 3000

# Domain is used in accessing grafana from a browser
domain = localhost

# The full public facing url
root_url = %(protocol)s://%(domain)s:%(http_port)s/
_____________________________Code language: PHP (php)
6. What are Grafana Alerts?
Grafana Alerts helps in allows in attching rules in our dashboard panels, we can save the dashboard as it extracts the alert rules in a separate alert rule storage and schedules it for the evaluation.
Dashboard Alerts consists of 4 components as follows:
- Alerting Rule used in creating an alert.
- Contact Point used in sending notification when conditions of alerts rule are met.
- Notification Policy used in grouping, matching and determining where, how to send notifications.
- Silences used in matching and silencing notifications.
7. What are Cloud Logs?
Cloud Loggings helps in storing, searching, analyzing, monitoring and alerting on logging data and events from AWS Web Service and Google Cloud.
8. What is Grafana Dashboard Templates?
Grafana Dashboard Templates are used in making our dashboards interactive, we can create dashboard template variables which can be used anywhere in the Grafana Dashboard.These variables helps in allowing us in making dynamic changes to the dashboard.
9. What are Cloud Metrics?
Cloud Metrics helps in providing insights in our Cloud Computing and also predictive analysis of our system, and in determining when our servers are under load and requires provisioning.Cloud Metrics are also used in setting up thresholds through policies which will react in conditions during the cloud operations.It also allows the cloud in self healing with auto fixing in the event of any operational failures.
10. How should we use the selected period of time in a query?
We can use the following variable for selecting the period of time in a query:
increase(http_requests_total[$__interval])
11. How should we import custom dashboards to grafana using helm?
We can import Custom Dashboard by using the following command:
________________________________________
<!-- wp:paragraph -->
<p>apiVersion: v1<br>kind: ConfigMap<br>metadata:<br>name: example-dashboard<br>data:<br>{{ (.Files.Glob "custom-dashboards/*.json").AsConfig | indent 2 }}</p>
<!-- /wp:paragraph -->

<!-- wp:paragraph -->
<p>Or</p>
<!-- /wp:paragraph -->

<!-- wp:paragraph -->
<p>#</p>
<!-- /wp:paragraph -->

<!-- wp:paragraph -->
<p>data:</p>
<!-- /wp:paragraph -->

<!-- wp:paragraph -->
<p>custom-dashboard.json: |-</p>
<!-- /wp:paragraph -->

<!-- wp:paragraph -->
<p>{{ (.Files.Get "customJSON") | indent 4 }}</p>
<!-- /wp:paragraph -->

<!-- wp:paragraph -->
<p>#<br>#</p>
<!-- /wp:paragraph -->

<!-- wp:paragraph -->
<p>pick up.</p>
<!-- /wp:paragraph -->
____________________________Code language: HTML, XML (xml)
12. How do you check if the Grafana service is running or not?
You can validate that Grafana is running by checking the service’s status command as given below:
$ sudo systemctl status grafana-server
13. How to configure Grafana, so that dashboards can be viewed without requiring a password?
Make the following small configuration modifications to the default.ini/grafana.ini file to enable anonymous login (Grafana\conf).
If you wish to hide the login page, make the following changes:
[auth]
Set to true to disable (hide) the login form, useful if you use OAuth
disable_login_form = false
disable_login_form = true
Update disable_login_form to true.
[auth.anonymous]
enable anonymous access
enabled = true
Specify the organization:
specify organization name that should be used for unauthenticated users
org_name = YOUR_ORG_NAME_HERE
You should be able to see the Grafana dashboard after restarting Grafana. If this isn’t the case, simply change your org role from Viewer to Editor:
specify role for unauthenticated users
org_role = Editor
14. What Is Graphite Grafana?
Graphite is a monitoring tool yet again. It makes time series data storage and viewing easier. In a data monitoring setup, Graphite is best used as a data source for Grafana dashboard.
Grafana provides an advanced Graphite query editor that allows us to interact with data using expressions and functions.
15. How do I add alerts to Grafana?
Create an alert rule by following below steps.
- Hold your mouse over the Grafana Cloud Alerting icon in Grafana and then click Alerts and rules.
- If you have more than one Prometheus or Loki data source, you can select one from a choice at the top when creating or editing rules.
- Select Edit rules from the drop-down menu.
- Select Add rule from the drop-down menu.
16. What is Loki Grafana?
Loki is a Prometheus-inspired horizontally scalable, highly available, multi-tenant log aggregation system. It is intended to be both cost-effective and simple to use. It uses a set of labels for each log stream rather than indexing the contents of the logs.
17. What Alert Notification Channels does Grafana Support?
Majorly it supports below Alert Notification Channels
- Slack
- Kafka
- Google Hangouts Chat
- Microsoft Teams
18. What is difference between Grafana and Kibana?
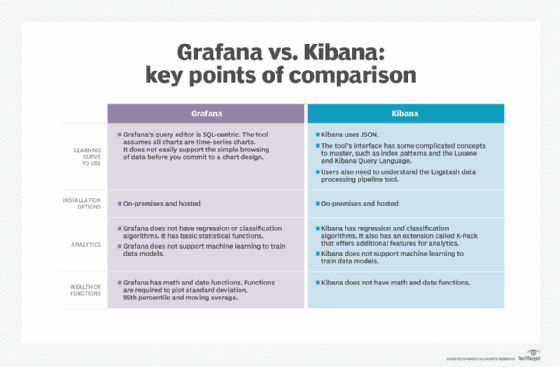
- Kibana’s main purpose was to analyze and monitor logs. In the ELK stack, K stands for Kibana. The ElasticSearch team developed Kibana with the goal of having a useful tool for monitoring logs. Instead of running Linux commands on the console to identify exceptions in production, simply navigate around and track the context from the Kibana.
- Grafana, on the other hand, is developed as a generic monitoring solution that can be used to monitor and analyze pretty much anything. This is a very high-level overview of the differences between the two tools.
19. How do I create a drop down menu in Grafana dashboard based on a Sysdig metrics label?
To do that you need to go in your dashboard, then :
Settings > Variables > New
In the General block, you have to select Query as the variable type.
In the Query Options block, you can select your datasource in the dropdown
Then, in the same block, you’ll have a Query textfield. Here you have to use the grafana function called label_values You can refer the documentation for this function.
So basically, for our case, to retrieve the label value for the region label, will have to do something like this :
label_values(cloud_storage_request_count,region)________________________________________
20. What is Grafana used for?
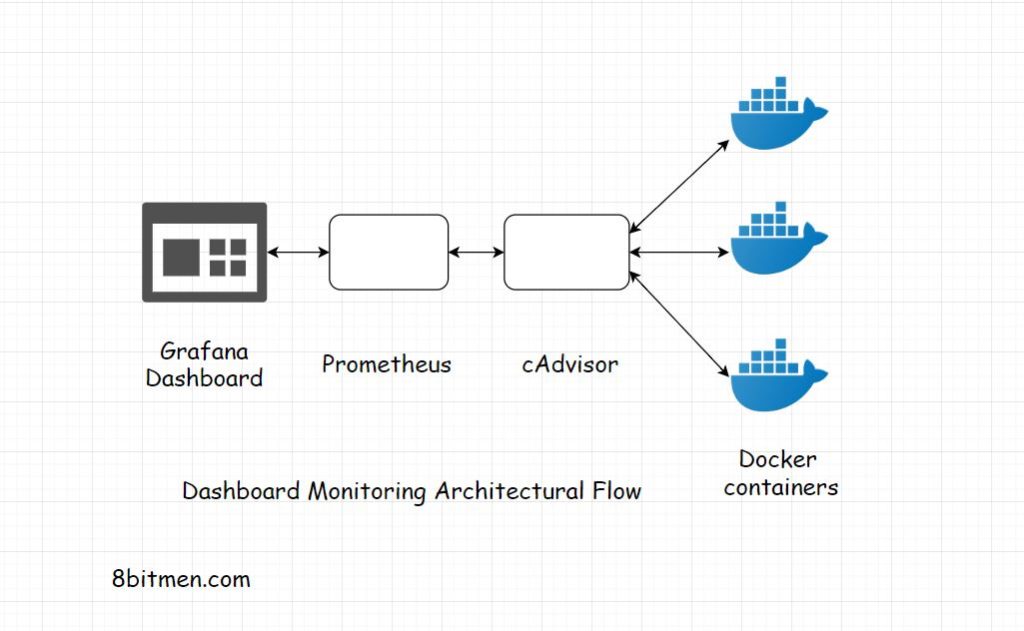
Grafana is used for a variety of data visualisation use cases including but not limited to server monitoring, performance testing, windows host monitoring and Docker monitoring as well as for building metrics reporting dashboards in general.
21. How do you create a Grafana dashboard?
To create a Grafana dashboard you will want to navigate to the Grafana application after you have installed the platform and select the + icon from the top right-hand side menu. You should now see the option to select “Add an empty panel”.
Selecting this option will take you to the main dashboard configuration screen where you can start experimenting with different settings to create your first dashboard.
22. Where does Grafana save dashboards?
The folder /var/lib/grafana is the default location where all Grafana dashboards are saved.
23. How do you export a Grafana dashboard?
To export a Grafana dashboard make sure that you have selected the dashboard that you wish to share. From here you can open the dashboard menu. To export this dashboard you will now want to select “Share” from the menu you have just opened in order to choose “export”.
24. How do you backup Grafana dashboards?
In order to backup your Grafana dashboard you may wish to consider using an open-source tool such as the Grafana backup tool.
This tool uses a Python application to backup not only Grafana dashboards but also backups your settings, folder permissions and alert channel configurations. There is also the option to use a managed service such as the platform offered by Logit.io, which offers this service by default as part of our commitment to our users.
25. How do you change the panel title in Grafana?
To change the panel title of a chart/table in Grafana click the title of the panel and from the drop-down menu select “edit”.
From here you will notice a right-hand menu where you can directly change the panel title to a different name of your choice. Once you have typed a new name select “apply” to save your changes.
26. How do you send data to Grafana?
To forward data to Grafana from different data sources you will need to navigate to “Data Sources” from the configuration menu.
On this page, you will be able to view both previously configured sources as well as the option to add a new data source. When adding a new data source to Grafana you will be able to see detailed instructions for sending your specific data type within the platform.
27. How do you use Grafana to plot string data?
To get started with plotting string data in Grafana you will need to select the table panel format when you create a new panel in order to display this data accurately, you may also need to change the setting to not aggregate data (no GROUP by).
28. Where do you find the time filter in Grafana?
The $timeFilter variable is used to drill down on insights captured between certain times. It can be found being used for log analysis and SQL querying.
Unfortunately, some users have issues using this filter and so may need to use a workaround to distil the relevant information they are looking to display.
29. How do you use the cURL command in Grafana?
One example of a cURL command for Grafana looks like this; curl http://admin:admin@localhost:3000/api/search. This command performs a fetch of the dashboard for local installations of Grafana running with basic authentication enabled
To find out more on how to use the cURL command in regards on how to perform calls to the Grafana API please read this article.
30. How do you use variables in Grafana?
To use variables in Grafana you will want to familiarise yourself with some of the most popular uses of variables in these example dashboards.
31. How do you delete a Grafana dashboard?
Deleting a dashboard in Grafana is simple. To do this yourself all you have to do is navigate to the dashboard that you wish to delete and select “dashboard settings” from the top right-hand corner.
Scroll down to the bottom and you will see a button that says “Delete dashboard”. You will then be asked to confirm your decision to delete your dashboard.
32. What is InfluxDB?

InfluxDB is a time-series database written in the Go programming language.
33. What is InfluxDB used for?
InfluxDB is used for both the storage and retrieval of time series data and is commonly used by those who wish to perform operations monitoring as well as logs and metrics analysis.
34. What is Graphite DB?
Graphite DB is an open-source time-series database. This means that it is able to store time-series data and render graphs based upon this data.
35. How do you restart Grafana?
If you are running your Grafana deployment on Windows you will need to locate the services app, right-click on Grafana and then within the context menu select “restart”.
36. How do you upgrade Grafana?
If you have installed Grafana from the APT repository then every time you run the apt-get upgrade command it will automatically update your software to the latest version.
If you installed Grafana in another way then you may wish to review other methods of upgrading here.
37. Is Grafana a monitoring tool?
As a visualization tool, Grafana is a popular component in monitoring stacks, often used in combination with time series databases such as InfluxDB, Prometheus and Graphite; monitoring platforms such as Sensu, Icinga, Checkmk, Zabbix, Netdata, and PRTG; SIEMs such as Elasticsearch and Splunk; and other data sources.
38. What can I monitor with Grafana?
Grafana supports graph, singlestat, table, heatmap, and freetext panels, as well as integration with official and community-built plugins (like world map or clock) and apps that could be visualized, too.
39. What is the purpose of Grafana?
The purpose of Grafana dashboards is to bring data together in a way that is both efficient and organized. It allows users to better understand the metrics of their data through queries, informative visualizations and alerts.
40. How good is Grafana?
Grafana Ratings
“It’s a great tool that will help you to put your data into perspective in a nice and organized way.” “This software can connect with a lot of things, like mysql, postgres, zabbix. This made a powerfull tool for develop a nice dashboard to show any type of graphs.”
41. Is Grafana an APM?
Grafana is a great open source solution for combining data from multiple data sources. The new Instana APM plugin for Grafana is another example of our commitment to working with the open source community to foster solutions that meet the needs of all customers.
42. What is metrics in Grafana?
Metrics tell you how much of something exists, such as how much memory a computer system has available or how many centimeters long a desktop is. In the case of Grafana, metrics are most useful when they are recorded repeatedly over time.
43. What is the difference between Splunk and Grafana?
Grafana is your tool if you need a product only for data visualization without spending a fortune on it. … Splunk is your product if you need a more versatile solution that can ingest any kind of data or logs and give you the capabilities to query and search through the data quickly.
44. Is Grafana easy to learn?
Grafana is an open source database analysis and monitoring tool that is easy to install on any operating system. It’s accessed through a browser, so it can be deployed to your favorite hosting company and can then be accessed by your whole team.
45. What companies use Grafana?
- 1639 companies reportedly use Grafana in their tech stacks, including Uber, Robinhood, andLaunchDarkly.
- Uber.
- Robinhood.
- LaunchDarkly.
- Nubank.
- KAVAK.
- Bitpanda.
- HENNGE K.K.
- medium.com.
46. What are the disadvantages of Grafana?
Cons to Grafana include:
- Limitations on dashboard organization and design. Visualization panels are limited to those made available by Grafana Labs and its community. …
- No data collection and storage. …
- Limited data type visualizations.
47. What is Grafana tempo?
Grafana Tempo is an open source, easy-to-use and high-volume distributed tracing backend. Tempo is cost-efficient, requiring only object storage to operate, and is deeply integrated with Grafana, Prometheus, and Loki.
48. How do I monitor logs in Grafana?
After login into the Grafana, click on the Explore tab. Select data source as Loki and enter the {app=”nginx”} in Log labels. Note that metadata of Nginx deployment contains the label app=nginx which is the same that filters out logs in Loki. Alerts enter into the Pending state as soon as its condition satisfies.
49. How do I push logs into Grafana?
Configure Grafana Cloud to receive the logs.
Open Grafana Cloud. In the side menu, from Settings (looks like a gear) select Data Sources. On the Configuration page that opens, in the Data Sources tab (which you should already be in), click Add data source. From the list of options, select Loki.
50. Is Grafana better than tableau?
The concept of Grafana is very broad, while Tableau is more focused on business intelligence. Grafana is well suited for working with time-series, application monitoring, and server monitoring. Working with servers can be a bit less comfortable with Tableau. However, Tableau has more specific business analytics tools.
I’m Rajesh Kumar, a DevOps, SRE, DevSecOps, Cloud, and Platform Engineering expert passionate about sharing practical knowledge, real-world experiences, and industry best practices. I have worked at Cotocus and regularly write about technology, travel, investing, health, product reviews, and digital marketing through my various platforms.
I publish technical articles at DevOps School, travel stories at Holiday Landmark, stock market insights at Stocks Mantra, health and fitness guidance at My Medic Plus, product reviews at TrueReviewNow, and SEO and digital marketing strategies at Wizbrand.
Find Trusted Cardiac Hospitals
Compare heart hospitals by city and services — all in one place.
Explore Hospitals