In this Blog I am going to cover Top 50 questions and Answers that are more important to know for the interview preparations.
Let’s start –
- What is Logstash?
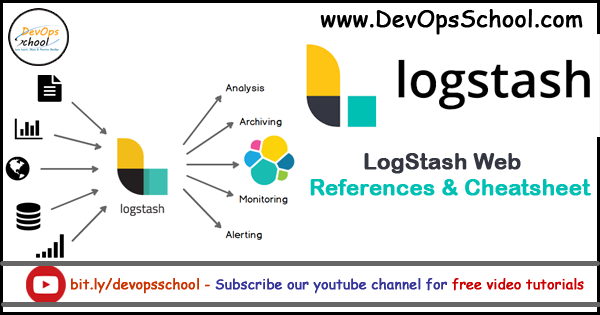
Logstash is an open source data collection engine with real-time pipelining capabilities. Logstash can dynamically unify data from disparate sources and normalize the data into destinations of your choice. Cleanse and democratize all your data for diverse advanced downstream analytics and visualization use cases.
2. What does Logstash forwarder do?
Filebeat is based on the Logstash Forwarder source code and replaces Logstash Forwarder as the method to use for tailing log files and forwarding them to Logstash. The registry file, which stores the state of the currently read files, was changed.
3. What is Logstash used for?
Logstash is an open source tool for collecting, parsing, and storing logs for future use. Kibana 3 is a web interface that can be used to search and view the logs that Logstash has indexed. Both of these tools are based on Elasticsearch.
4. What is the Power of Logstash?
- The ingestion workhorse for Elasticsearch and more – Horizontally scalable data processing pipeline with strong Elasticsearch and Kibana synergy
- Pluggable pipeline architecture – Mix, match, and orchestrate different inputs, filters, and outputs to play in pipeline harmony
- Community-extensible and developer-friendly plugin ecosystem – Over 200 plugins available, plus the flexibility of creating and contributing your own
5. How does Logstash work with the web?
Transform HTTP requests into events
- Consume from web service firehoses like Twitter for social sentiment analysis
- Webhook support for GitHub, HipChat, JIRA, and countless other applications
- Enables many Watcher alerting use cases
- Create events by polling HTTP endpoints on demand
- Universally capture health, performance, metrics, and other types of data from web application interfaces
- Perfect for scenarios where the control of polling is preferred over receiving
6. What are Logs and Metrics in Logstash?
Logs and Metrics – Logstash handle all types of logging data.
Easily ingest a multitude of web logs like Apache, and application logs like log4j for Java
Capture many other log formats like syslog, networking and firewall logs, and more
Enjoy complimentary secure log forwarding capabilities with Filebeat
Collect metrics from Ganglia, collectd, NetFlow, JMX, and many other infrastructure and application platforms over TCP and UDP.
7. Which Java version is required to install Logstash?
Logstash requires Java 8. Java 9 is not supported.
8. What are the two required elements in Logstash pipeline?
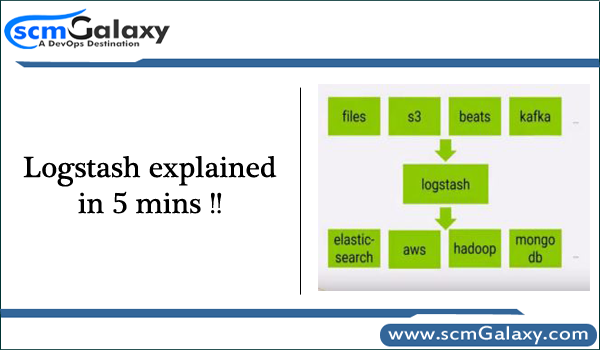
A Logstash pipeline has two required elements, input and output, and one optional element, filter. The input plugins consume data from a source, the filter plugins modify the data as you specify, and the output plugins write the data to a destination.
9. Can you explain how Logstash Works?
The Logstash event processing pipeline has three stages: inputs -> filters -> outputs. Inputs generate events, filters modify them, and outputs ship them elsewhere. Inputs and outputs support codecs that enable you to encode or decode the data as it enters or exits the pipeline without having to use a separate filter.
10. What are Inputs in Logstash?
You use inputs to get data into Logstash.
Some of the more commonly-used inputs are: file, syslog, redis, and beats.
- file: reads from a file on the filesystem, much like the UNIX command tail -0F
- syslog: listens on the well-known port 514 for syslog messages and parses according to the RFC3164 format
- redis: reads from a redis server, using both redis channels and redis lists. Redis is often used as a “broker” in a centralized Logstash installation, which queues Logstash events from remote Logstash “shippers”.
- beats: processes events sent by Filebeat.
11. What Are filters in Logstash?
Filters are intermediary processing devices in the Logstash pipeline. You can combine filters with conditionals to perform an action on an event if it meets certain criteria. Some useful filters include:
- grok: parse and structure arbitrary text. Grok is currently the best way in Logstash to parse unstructured log data into something structured and queryable. With 120 patterns built-in to Logstash, it’s more than likely you’ll find one that meets your needs!
- mutate: perform general transformations on event fields. You can rename, remove, replace, and modify fields in your events.
- drop: drop an event completely, for example, debug events.
- clone: make a copy of an event, possibly adding or removing fields.
- geoip: add information about geographical location of IP addresses (also displays amazing charts in Kibana!)
12. What are Outputs in Logstash?
Outputs are the final phase of the Logstash pipeline. An event can pass through multiple outputs, but once all output processing is complete, the event has finished its execution. Some commonly used outputs include:
- elasticsearch: send event data to Elasticsearch. If you’re planning to save your data in an efficient, convenient, and easily queryable format.
- file: write event data to a file on disk.
- graphite: send event data to graphite, a popular open source tool for storing and graphing metrics.
- statsd: send event data to statsd, a service that “listens for statistics, like counters and timers, sent over UDP and sends aggregates to one or more pluggable backend services”. If you’re already using statsd, this could be useful for you!
13. What are Codecs in Logstash?
Codecs are basically streamed filters that can operate as part of an input or output. Codecs enable you to easily separate the transport of your messages from the serialization process. Popular codecs include json, msgpack, and plain (text).
- json: encode or decode data in the JSON format.
- multiline: merge multiple-line text events such as java exception and stacktrace messages into a single event.
14. How many types of Logstash Configuration Files are there?
Logstash has two types of configuration files: pipeline configuration files, which define the Logstash processing pipeline, and settings files, which specify options that control Logstash startup and execution.
15. Explain the Execution Model of Logstash?
The Logstash event processing pipeline coordinates the execution of inputs, filters, and outputs.
Each input stage in the Logstash pipeline runs in its own thread. Inputs write events to a central queue that is either in memory (default) or on disk.
Each pipeline worker thread takes a batch of events off this queue, runs the batch of events through the configured filters, and then runs the filtered events through any outputs.
16. What Is File Beat?
The File beat consumer is a lightweight, useful resource-friendly device that collects logs from documents on the server and forwards those logs on your Logstash example for processing. File beat is designed for reliability and low latency. File beat has a light aid footprint at the host machine, and the Beats enter plugin minimizes the aid demands on the Logstash instance. Testing Tools Tutorial.
17. What Is GeoIP Plugin?
GeoIP plugin appears up IP addresses, derives geographic area records from the addresses, and adds that region statistics to the logs.
18. What Does Logstash Forwarder Do?
File beat is based totally on the Logstash Forwarder supply code and replaces Logstash Forwarder as the method to apply for tailing log files and forwarding them to Logstash. The registry report, which shops the nation of the present study files, changed into modified.
19. What are Logs and Metrics in Logstash?
Logs and Metrics – Logstash handles all types of logging data.
Easily ingest a multitude of weblogs like Apache and application logs like log4j for Java
Capture many other log formats like Syslog, networking and firewall logs, and more
Enjoy complimentary secure log forwarding capabilities with Filebeat
Collect metrics from Ganglia, collected, NetFlow, JMX, and many other infrastructure and application platforms over TCP and UDP.
20. How does Logstash work with the web?
Transform HTTP requests into events
- Consume from web service firehoses like Twitter for social sentiment analysis
- Webhook support for GitHub, HipChat, JIRA, and countless other applications
- Enables many Watcher alerting use cases
- Create events by polling HTTP endpoints on demand
- Universally capture health, performance, metrics, and other types of data from web application interfaces
- Perfect for scenarios where the control of polling is preferred over receiving.
21. What is Elasticsearch REST API?
Elasticsearch provides extensive REST APIs to integrate, query, and manage the data. We can do many things using Elasticsearch REST APIs like:
Check our cluster, node, and index health, status, statistics, etc.
Administer our cluster, node, and index data and metadata.
Perform CRUD (Create, Read, Update, and Delete) and search operations against our indexes.
Execute advanced search operations such as paging, sorting, filtering, scripting, aggregations, etc.
22. How can we delete an index in Elasticsearch?
To delete the index, we can execute the following command:
DELETE /blogs?pretty
23. How can we search for any data in Elasticsearch?
We have basically two types of search APIs in Elasticsearch: ‘request URI based’ and ‘request body based. In REST request URI we use to pass the search criteria in the URL itself like:
GET /blogs/technical/_search?q=topic:kibana
In the REST request body, we use to construct the search block and write the search query inside the query block of Elasticsearch like:
___________________________
GET /blogs/technical/_search
{
“query”: {
“term”: {
“topic”:”kibana”
}
}
}
___________________
So the URI-based search is quite a basic search where we just want to search a keyword whereas in the request body we can construct the complex queries. So we have the query language to work with request body-based searches.
24. What are the advantages of using Logstash?
The key features that users of Logstash find beneficial include:
- Over 200 plugins are available
- Process unstructured data
- Pre-built and custom filters
- Built custom data processing pipelines
- Works as an extract, transform & load (ETL) tool
25. How can you test Logstash performance?
You can use the node stats API to retrieve runtime statistics from Logstash.
26. What is a Logstash pipeline?
A Logstash pipeline consists of these elements as listed in the following order: Input (the source of data), filter (processing, parsing & enrichment of data) & output (write the data for use within Elasticsearch & Kibana).
27. What is ELK?
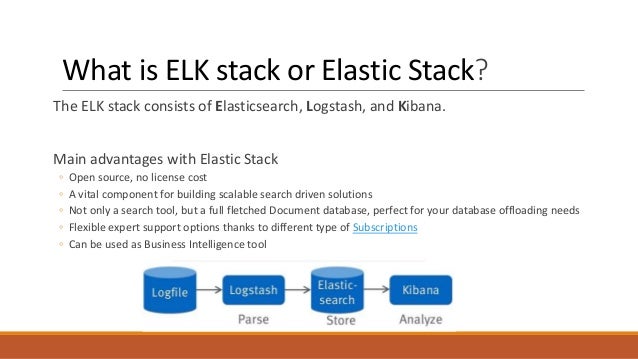
ELK (also known as the Elastic Stack) stands for the formally open-source tools Elasticsearch, Logstash, and Kibana.
28. What is Kibana?

Kibana is an open-source visualisation and reporting user interface developed in 2013 by Rashid Khan of the Elastic Company.
Kibana allows users to produce visualisations from a variety of data inputs & can create pie charts, heat maps, line graphs, scatter plots and so much more to reflect data in an easily digestible format.
29. What are the advantages of using Kibana?
A few of the main benefits of using Kibana are as follows:
- Real-time observability
- Integration with Elasticsearch
- Browser-based visualisation tool
- Many graphs and charts to select from
30. What are the advantages of using the ELK Stack?
The ELK Stack can be used for a wide variety of use cases including but not limited to;
- APM
- SIEM
- Log analysis
- Server monitoring
- Container monitoring
- Metrics management
- Vulnerability scanning
- Compliance & auditing
- Infrastructure monitoring
- Monitoring website uptime
- Measuring sales performance
- Understanding user behaviour
31. How can you forward logs from Kubernetes to Logstash?
By using a log shipper such as Filebeat, as illustrated on our integration page for sending Kubernetes logs to Logstash.
For additional resources on tools suited to K8s then check out our guide on Kubernetes management tools.
32. What Is Grok Filter Plugin?
The grok filter plugin allows you to parse the unstructured log statistics into something based and question in a position.Because the grok filter plugin appears for patterns within the incoming log facts, configuring the plugin calls for you to make choices approximately how to discover the patterns that are of hobby on your use case.
33. Why is Logstash needed?
Logstash was one of the original components of the Elastic Stack, and has long been the tool to use when needing to parse, enrich or process data. … They allow simple architectures with minimum components, where applications send data directly to Elasticsearch for processing and indexing.
34. Who uses Logstash?
Who uses Logstash? 1102 companies reportedly use Logstash in their tech stacks, including Airbnb, Udemy, and Robinhood.
35. How do you implement Logstash?
Installing Logstash. Stashing Your First Event. Parsing Logs with Logstash. Stitching Together Multiple Input and Output Plugins.
…
Logstash requires one of these versions:
Java 8.
Java 11.
Java 15 (see Using JDK 15 for settings info)
36. What is Logstash port?
By default, Logstash will use port 9600.
37. What is Logstash message?
The message field is like a default field. It’s where most input plugins place the payload that they receive from the network, read from a file, or whatever.
38. What is a Logstash agent?
Logstash is a free and open server-side data processing pipeline that ingests data from a multitude of sources, transforms it, and then sends it to your favorite “stash.” Download.
39. What is Logstash format?
Logstash is a plugin-based data collection and processing engine. It comes with a wide range of plugins that makes it possible to easily configre it to collect, process and forward data in many different architectures. Processing is organized into one or more pipelines.
40. Is Logstash a ETL?
At its core, Logstash is a form of Extract-Transform-Load (ETL) pipeline. Unstructured log data is extracted, filters transform it, and the results are loaded into some form of data store.
41. Does Logstash use Log4j?
Logstash’s logging framework is based on Log4j 2 framework, and much of its functionality is exposed directly to users. You can configure logging for a particular subsystem, module, or plugin. … You can configure logging using the log4j2. properties file or the Logstash API.
42. Can Logstash have multiple inputs?
The information you need to manage often comes from several disparate sources, and use cases can require multiple destinations for your data. Your Logstash pipeline can use multiple input and output plugins to handle these requirements.
43. Does Logstash have a UI?
Monitoring UIedit
A Logstash node is considered unique based on its persistent UUID, which is written to the path. … Before you can use the monitoring UI, configure Logstash monitoring.
44. How do you write Logstash pipeline?
Step 1: Install and configure apache webserver. The access log of this webserver will serve our input to Logstash pipeline. Shell. …
Step 2: Create the pipeline configuration file. Shell. …
Step 3: Stash apache access logs to Elasticsearch using Logstash Pipeline. Shell.
45. What is Logstash yml?
Tip: Port 5000 is a default port number for Logstash. If you want to use a different port number, you must change the port number in both the Logstash and Filebeat configuration files.
46. What is mutate in Logstash?
The mutate filter allows you to perform general mutations on fields. You can rename, replace, and modify fields in your events.
47. What is type in Logstash?
The type option sets the value of the field with the same name. If you only ingest a single kind of log (and never will do anything else) you don’t have to worry about it, but in all likelihood you’ll eventually want to process different kinds of logs and then the type field will be a good way of distinguishing them.
48. Which language is used in Logstash?
JRuby programming language
Logstash is written on JRuby programming language that runs on the JVM, hence you can run Logstash on different platforms. It collects different types of data like Logs, Packets, Events, Transactions, Timestamp Data, etc., from almost every type of source.
49. Where is Logstash data stored?
conf file is stored. For example, if the logstash-simple. conf file is stored in /root/logstash-7.1. 1/, go to the directory before running the command.
50. What is the difference between Kafka and Logstash?
Kafka is much more powerful than Logstash. For syncing data from such as PostgreSQL to ElasticSearch, Kafka connectors could do the similar work with Logstash. One key difference is: Kafka is a cluster, while Logstash is basically single instance. You could run multiple Logstash instances.
I’m a DevOps/SRE/DevSecOps/Cloud Expert passionate about sharing knowledge and experiences. I have worked at Cotocus. I share tech blog at DevOps School, travel stories at Holiday Landmark, stock market tips at Stocks Mantra, health and fitness guidance at My Medic Plus, product reviews at TrueReviewNow , and SEO strategies at Wizbrand.
Do you want to learn Quantum Computing?
Please find my social handles as below;
Rajesh Kumar Personal Website
Rajesh Kumar at YOUTUBE
Rajesh Kumar at INSTAGRAM
Rajesh Kumar at X
Rajesh Kumar at FACEBOOK
Rajesh Kumar at LINKEDIN
Rajesh Kumar at WIZBRAND
Find Trusted Cardiac Hospitals
Compare heart hospitals by city and services — all in one place.
Explore Hospitals
