1. what is Nagios?
Nagios is a monitoring tool that is used for continuous monitoring of system services, applications, and business processes. Even in case of any failure, Nagios tool can alert the technical staff about the problem. As a result, DevOps professionals or technical team members can begin the required remediation processes before the negative impact of any business processes, customers, and end-users. Here, in such cases, the team does not have to explain anyone that why an unseen infrastructure outage affects the bottom line of the organization.
2. Mention the things that can be achieved by the Nagios DevOps tool?
- Automatic problem fixing as and when they occur.
- Infrastructure upgrades planning even before any failure due to an outdated system.
- Technical team response coordination.
- To ensure that SLA of your organization will be met.
- To monitor the business process and the entire infrastructure.
- To respond to issues even as and when they arise.
3. Explain the working of Nagios, how does it work?
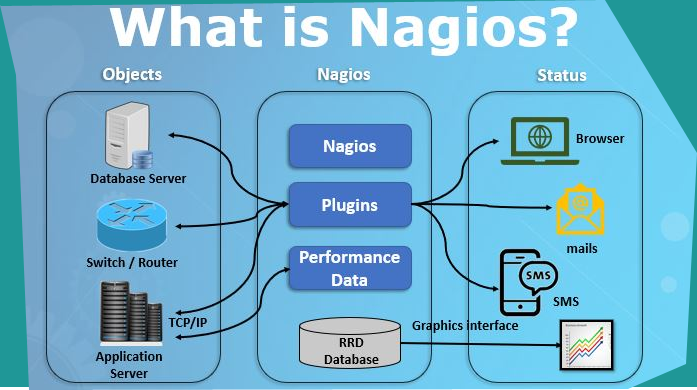
- On a server, Nagios either runs as a service or daemon. Plugins that reside on the same server are being run by the Nagios; basically, they contact the hosts or servers of your network or on the internet. We can check the status by web interface; even notifications can also be received by email or SMS when something happens.
- Nagios service runs certain scripts after a fixed time interval, so it acts as a scheduler. It can store the script result and run other scripts when it is changed.
4. Explain Nagios plugins?
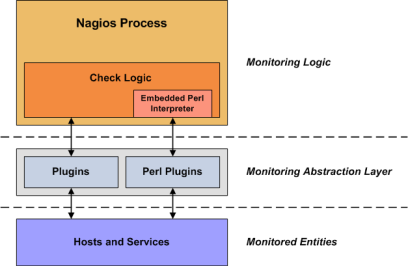
- Plugins are basically scripts of Perl and Shell that can be run through the command line to check the service status of the host. Nagios can also use the result of the plugins that determine the present status of host or services of the network.
- Now an answer to the questions that why we need plugins, you can also add here that, plugins is executed by Nagios to check the status of any service or host. A check is performed by the plugin and the result is returned to Nagios. The result is processed by Nagios to take the necessary actions.
5. What do you understand by NRPE or Nagios Remote Plugin Executor of Nagios?
NRPE or Nagios remote plugin executor is designed to allow execution of plugins on remote Linux or UNIX based machines. These plugins are executed to monitor the usage of CPU load and memory usage like a local resource of remote machines. It is required as this information is not usually exposed publicly to an external machine and for this purpose, NRPE agent is installed on remote machines.
NRPE add-on or plugin has two components that work together to perform the task:
- A ‘check_nrpe’ plugin that resides on the local machine and it is used for monitoring.
- The NRPE daemon that can run on remote machines.
6. What are port numbers used by Nagios for monitoring purpose?
Usually, the port number 5666, 5667 and 5668 are used for monitoring in Nagios DevOps tool.
7. Explain main configuration file and its location?
Following is the description of the main configuration file:
- Resource File: To store sensitive information like user details that may include username and passwords it is used. The information is not made available to CGI.
- Object Definition File: In this file, you can find and enlist the details of resources that you want to monitor and how you want the monitoring to be performed? Host services, host groups, contacts, contact groups, commands, etc. are defined in this file.
- CGI Configuration File: Several directives are contained and stored in CGI file that can affect the CGI o. A reference to the main configuration file is also stored in this file, so that CGI can know the details of Nagios configuration as and when required and the location of object definition storage.
8. What are state types of Nagios?
Following are the state types of Nagios:
- Service or host state type
- Some states like OK, WARNING, UP, or DOWN state host or service
- Two state types that are SOFT state or HARD state
9. What are SOFT and HARD states?
We can define soft and hard states as:
- In case of the SOFT state, the service or host check results are not OK or not up to the mark, even in case if service check has not been rechecked the number of times that are specified for it moreover the times that is being specified by the max_check_attempts directive. Recovery of the component from such Soft error is called Soft Recovery.
- When a host or service check result is not ‘OK’ and it has been checked for the number of times, specified by the max_check_attempts directive in the host definition, then this error is known as Hard Error. Recovery of any service from this error is known as Hard Recovery.
10. What is state stalking in Nagios?
- State stalking is used for logging purpose in Nagios. When stalking is enabled for any service or host then Nagios watch it very carefully and store any changes that if found in the check result of that resource.
- Stalking can be helpful in later stages of log file analysis. Here in such scenario, any host or service check can be performed only if it has been updated for the last time.
11. Why is it being said that Nagios is object oriented?
Nagios has object configuration format where you can create object definitions, that can inherit the properties from other hostnames or object definitions. In this way, you can specify the component relationships easily. The components are considered as objects by the Nagios.
12. Which three Nagios variables can affect recursion and inheritance in Nagios?
The three variables that affect recursion and inheritance are:
- Name
- Use
- Register
Here, Name is just a placeholder that can be used by the other objects. Use variable can be used to define parent object, whose properties are to be used. Registers are also used for storing values that can be either 0 or 1. Register values cannot be inherited.
13. How Does Flap detection work in Nagios?
When a service or host changes their state frequently, then it is called flapping that may cause lots of problems and generate too many recovery notifications. Flapping is detected in the following manner:
- Store the results of last 21 checks and then analyze this historical check result to know the number of transitions that are being taken place by the host or service.
- Know the percent state change value with the help of state transition
- Compare the value of this state change against low and high flapping thresholds
- When this value exceeds then the highest specified threshold then it is called flapping
- When this percent state value goes down the specified value then it is said that flapping has been stopped.
14. Explain main configuration file of Nagios?
- Several directives are contained in the main configuration file that can affect Nagios daemon. This file is read by both CGIs and Nagios daemons.
- A Nagios file is usually created in the base Nagios directory, at the time when you run configuration script. The name of this file that is the main configuration file is ‘nagios.cfg’ and is usually placed in etc/subdirectory.
15. Differentiate between active and passive check?
The major difference between active and passive check is that Active checks are initiated by Nagios itself, while Passive checks are performed by external applications.
16. How is distributed monitoring being done in Nagios?
There is a distributed monitoring scheme in Nagios with the help of which you can monitor your complete enterprise that may include local slave instances. In such environment, Nagios submit the result of reports of tasks to a single machine. All configuration, reporting, and notification can be managed at the master machine and here slaves do all the work. Here Nagios uses passive checks that are basically external applications that can send the results back to Nagios.
17. How does Nagios work?
- Nagios runs on a server, usually as a daemon or service.
- Nagios periodically runs plugins residing on the same server, they contact hosts or servers on your network or on the internet.
- One can view the status information using the web interface.
- You can also receive email or SMS notifications if something happens.
- The Nagios daemon behaves like a scheduler that runs certain scripts at certain moments.
- It stores the results of those scripts and will run other scripts if these results change.
18. What is meant by Nagios backend?
Both Configuration and Logs can be stored in a backend. Configurations are stored in backend using NagiosQL. Historical data are stored using ndoutils. In addition, you also have nagdb and opdb.
19. When Does Nagios Check for external commands?
Nagios check for external commands under the following conditions:
- At regular intervals specified by the command_check_interval option in the main configuration file or,
- Immediately after event handlers are executed. This is in addition to the regular cycle of external command checks and is done to provide immediate action if an event handler submits commands to Nagios.
20. Explain how Flap Detection works in Nagios?
Flapping occurs when a service or host changes state too frequently, this causes lot of problem and recovery notifications.Whenever Nagios checks the status of a host or service, it will check to see if it has started or stopped flapping. Nagios follow the below procedure to do that:
- Storing the results of the last 21 checks of the host or service analyzing the historical check results and determine where state changes/transitions occur.
- Using the state transitions to determine a percent state change value (a measure of change) for the host or service.
- Comparing the percent state change value against low and high flapping thresholds
- A host or service is determined to have started flapping when its percent state change first exceeds a high flapping threshold.
- A host or service is determined to have stopped flapping when its percent state goes below a low flapping threshold.
21. How does Nagios help with Distributed Monitoring?
With Nagios you can monitor your whole enterprise by using a distributed monitoring scheme in which local slave instances of Nagios perform monitoring tasks and report the results back to a single master.
You manage all configuration, notification, and reporting from the master, while the slaves do all the work. This design takes advantage of Nagios’s ability to utilize passive checks i.e. external applications or processes that send results back to Nagios. In a distributed configuration, these external applications are other instances of Nagios.
22. Nagios says my machine is unreachable, not down. What is the difference and how it is achieved?
When Nagios says a node is unreachable, a node is unreachable if Nagios is not able to find a path to the node.
The node itself may be up but because Nagios is unable to connect to it, it has to mark this as unreachable. To achieve this, Nagios use parent-child relationship between components.A router may be defined as a parent for a server.
- Now Nagios checks for server and marks it as down.
- It then checks the parent (in our example, the router)
- If parent is also down, then server is marked as unreachable.
- If Parent is up, the server is marked as really down.
23. Explain Nagios state types?
The current state of monitored services and hosts is determined by two components:
- The status of service or host i.e. OK, WARNING, UP, DOWN etc..
- The type of state the service or host is in.
There are two types of states SOFT states and HARD states.
- When a service or host check results are in a non-OK or non-UP state and the service check has not yet been rechecked the number of times specified by the max_check_attempts directives in the service or host definition. This is called Soft Error. When a service or a host recovers from Soft Error that is considered as Soft Recovery.
- When a service or host check results are in a non-OK or non-UP state and the service check has been rechecked the number of times specified by the max_check_attempts directives in the service or host definition. This is called Hard Error. When a service or a host recovers from Hard Error that is considered as Hard Recovery.
24. What is a Passive Check?
In Nagios, external processes initiate Passive checks. When they are completed, the results are sent to Nagios. Passive checks help in monitoring asynchronous services. Those services can’t be tracked without regular polling of their status. Passive checks also help Nagios in checking the status of hosts that are behind a firewall as they can’t be verified through a monitoring host.
25. How does Nagios operate?
- Nagios runs as a service on a server
- It runs plugins on the server which connect with hosts on the network
- You can see the detailed information of the connected host through its interface
- In case some issue arises, you would receive an email or another notification
- Nagios runs scripts at specific times and saves the results of those scripts
- If the results of running the scripts change, Nagios starts running other scripts.
26. What are the advantages of using Nagios?
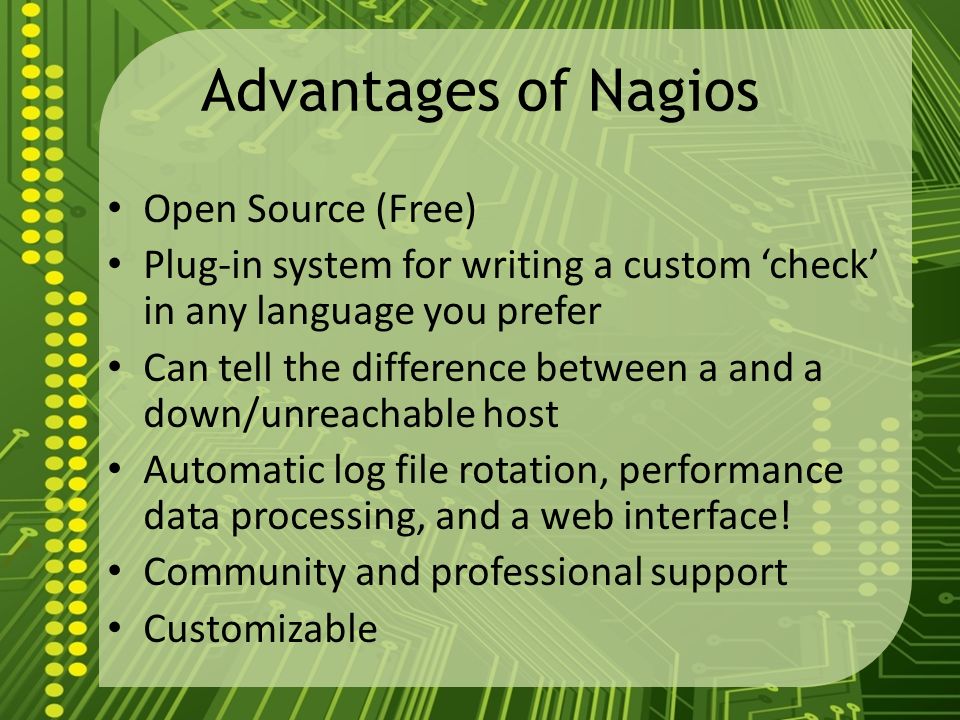
Nagios offers plenty of advantages to an organization.
- It allows you to plan future upgrades for your existing infrastructure
- It ensures a technical error in your IT infrastructure has minimum impact
- It quickly alerts you of any new problems
- It allows you to monitor the entire system and infrastructure
- It coordinates the responses of the technical staff
- It helps you find out how fast your team responds to technical problems
- It ensures that SLAs (Service-Level Agreements) of your organization are met.
27. What is an Active Check?
Nagios performs an Active check to poll a device or service for its status information on a scheduled basis.
28. What is Icinga? How is it related to Nagios?
Icinga is another popular open-source software that helps in monitoring services. It was designed in 2009 to help Nagios, but it has become a separate software.
29. What is Nagios XI?
Nagios is the most trusted and most powerful monitoring software. It can help you in monitoring applications, network protocols, systems, services, and metrics. It provides you with all the advantages of Nagios (discussed above) and has a powerful performance.
30. What is OID Nagios?
The Simple Network Management Protocol (aka SNMP) uses Object Identifiers for defining the Management Information Base.
31. What Are Ports Numbers Nagios Will Use To Monitor Clients?
Answer : Port numbers are 5666, 5667 and 5668
32. What Are The Three Main Variables That Affect Recursion And Inheritance In Nagios?
First name the variables and then a small explanation of each of these variables:
- Name
- Use
- Register
Now I will give a small explanation for each of these variables.
Name is a placeholder that is used by other objects. Use defines the “parent” object whose properties should be used. Register can have a value of 0 (indicating its only a template) and 1 (an actual object). The register value is never inherited.
33. What Is The Difference Between Active And Passive Check In Nagios?
The major difference between Active and Passive checks is that Active checks are initiated and performed by Nagios, while passive checks are performed by external applications.
Passive checks are useful for monitoring services that are:
- Asynchronous in nature and cannot be monitored effectively by polling their status on a regularly scheduled basis.
- Located behind a firewall and cannot be checked actively from the monitoring host.
- The main features of Actives checks are as follows:
- Active checks are initiated by the Nagios process.
- Active checks are run on a regularly scheduled basis.
34. Explain The Need For Passive Check?
Passive checks are useful for monitoring services that are Asynchronous in nature and cannot be monitored effectively by polling their status on a regularly scheduled basis. It can also be used for monitoring services that are Located behind a firewall and cannot be checked actively from the monitoring host.
35. What Are The Operating Systems We Can Monitor Using Nagios..?
Any Operating System We can monitor using Nagios, OS should support to install Nagios Clinet either SNMP.
36. What Is Nrpe?
The Nagios Remote Plugin Executor addon is designed to allow you to execute Nagios plugins on remote Linux/Unix machines. The main
reason for doing this is to allow Nagios to monitor “local” resources (like CPU load, memory usage, etc.) on remote machines. Since these public resources are not usually exposed to external machines, an agent like NRPE must be installed on the remote Linux/Unix machines.
The NRPE addon consists of two pieces:
- The check_nrpe plugin, which resides on the local monitoring machine
- The NRPE daemon, which runs on the remote Linux/Unix machine.
When Nagios needs to monitor a resource of service from a remote Linux/Unix machine:
- Nagios will execute the check_nrpe plugin and tell it what service needs to be checked
- The check_nrpe plugin contacts the NRPE daemon on the remote host over an (optionally) SSL-protected connection
- The NRPE daemon runs the appropriate Nagios plugin to check the service or resource
- The results from the service check are passed from the NRPE daemon back to the check_nrpe plugin, which then returns the check results to the Nagios process.
37. What Is The Difference Between Nagiosxi And Nagios Core?
NagiosXI is a Paid version and Nagios core is a free version.
NagiosXI includes lot of features which we can modify using web interface. Nagios Core default not include all the features we have to implement by installing plugins.
38. How To Verify Nagios Configuration?
In order to verify your configuration, run Nagios with the -v command line option like so:
/usr/local/nagios/bin/nagios -v /usr/local/nagios/etc/nagios.cfg
If you’ve forgotten to enter some critical data or misconfigured things, Nagios will spit out a warning or error message that should point you to the location of the problem. Error messages generally print out the line in the configuration file that seems to be the source of the problem. On errors, Nagios will often exit the pre-flight check and return to the command prompt after printing only the first error that it has encountered.
39. Why do we require the Nagios tool?
Here are some important factors to use the Nagios monitoring tool:
- Identifies all types of network or server problems.
- Assists users in determining the root cause of the problem, allowing users to obtain a permanent solution.
- Monitoring entire infrastructure and business processes on an ongoing basis.
- Users can use it to monitor and troubleshoot server performance issues.
- It enables us to plan for infrastructure upgrades before outdated systems fail.
- Users could even maintain the service’s security and availability.
40. Write down some of the names of the Nagios monitoring tool for Linux mentoring?
Some of the Nagios monitoring tools for Linux meeting are:
- Service state
- File system usage
- System metrics
- Process state.
41. Can you use Nagios to monitor the window machine?
By following these steps below, you can use Nagios to monitor the window machine:
- Set the Nagios to monitor the window system
- Add a separate host and server for the window monitoring
42. Describe the Nagios Network Analyzer?
A Nagios network analyzer is an important aspect of the Nagios software that allows it to deeply scan the system and search for any potential threat. The quick and reliable scan enables system admin to gather the data needed regarding the health of the system and granular data through network analysis.
43. Write down the protocols that support Nagios?
Protocols that support Nagios are:
- SMTP Monitoring
- IPMI Monitoring
- FTP Monitoring
- LDAP Monitoring
- POP Monitoring
- DNS monitoring.
44. state the name of any four virtualization platforms that supports Nagios?
Most common virtualization platforms that use Nagios are:
- VMware
- Amazon EC2
- Xen
- Microsoft Virtual PC
45. Is Nagios push or pull?
Nagios uses agents that are installed on both the network elements and the components that it monitors; they collect data using pull methodology.
46. Which is better Nagios vs zabbix?
After comparing the two it is clear that Zabbix is the winner. While Nagios Core has the basics in place to run effective network monitoring it simply doesn’t have the experience and configurability that Zabbix does. Zabbix is a free network monitor that performs like a product situated in the very top price bracket.
47. What are some advantages of Nagios XI over Nagios core?
The Definitive Comparison Guide: Nagios XI vs Nagios Core
- Faster capabilities.
- Easier user experience through built in configuration wizards and monitoring guides.
- Data visualization.
- A built-in graphical user interface that make it significantly easier to manage than Nagios Core.
48. Is Nagios a DevOps tool?
Nagios monitors your entire IT infrastructure to ensure systems, applications, services, and business processes are functioning properly. It is integral to the DevOps lifecycle and is a must for DevOps Certification.
49. Can Nagios run on IIS Web server?
IIS Log Monitoring With Nagios
Nagios provides complete monitoring and management of web logs and web log data from IIS, Apache, and other web servers. Nagios is capable of monitoring web logs, system logs, application logs, log files, and syslog data, and alerting you when specific patterns are detected.
50. How do I restart Nagios?
Starting and Stopping Nagios
- Init Script: The easiest way to restart the Nagios daemon is by using the init script like so: /etc/rc.d/init.d/nagios reload.
- Web Interface: You can restart the Nagios through the web interface by clicking the “Process Info” navigation link and selecting “Restart the Nagios process”:
I’m Rajesh Kumar, a DevOps, SRE, DevSecOps, Cloud, and Platform Engineering expert passionate about sharing practical knowledge, real-world experiences, and industry best practices. I have worked at Cotocus and regularly write about technology, travel, investing, health, product reviews, and digital marketing through my various platforms.
I publish technical articles at DevOps School, travel stories at Holiday Landmark, stock market insights at Stocks Mantra, health and fitness guidance at My Medic Plus, product reviews at TrueReviewNow, and SEO and digital marketing strategies at Wizbrand.
Find Trusted Cardiac Hospitals
Compare heart hospitals by city and services — all in one place.
Explore Hospitals