What are Data Analytics Tools?
Data Analytics Tools are software applications or platforms that enable organizations and individuals to gather, process, analyze, and visualize data for gaining insights and making informed decisions. These tools provide a range of functionalities, from basic data exploration and visualization to advanced data mining, machine learning, and predictive analytics. Data analytics tools play a crucial role in extracting meaningful patterns and trends from large and complex datasets, contributing to the success of data-driven decision-making.
Top 10 use cases of Data Analytics Tools:
- Business Intelligence: Providing key insights and performance metrics to support business decision-making.
- Data Exploration and Visualization: Exploring and visualizing data to understand patterns and trends.
- Customer Segmentation: Grouping customers based on their behaviors and characteristics for targeted marketing strategies.
- Predictive Analytics: Forecasting future outcomes and trends based on historical data.
- Fraud Detection: Identifying and preventing fraudulent activities using pattern recognition.
- Churn Analysis: Analyzing customer behavior to predict and reduce churn rates.
- Market Basket Analysis: Discovering associations and relationships between products to optimize product offerings.
- Sentiment Analysis: Analyzing text data to understand customer sentiments and feedback.
- Healthcare Analytics: Analyzing patient data for improving healthcare outcomes and resource allocation.
- Supply Chain Optimization: Optimizing supply chain operations for efficiency and cost-effectiveness.
What are the feature of Data Analytics Tools?
- Data Integration: Data analytics tools can connect to various data sources and integrate data for analysis.
- Data Exploration and Visualization: They offer interactive data exploration and visualization capabilities.
- Data Cleaning and Preprocessing: Tools provide functionalities for data cleaning and preparation.
- Statistical Analysis: They support various statistical methods for hypothesis testing and data inference.
- Machine Learning Algorithms: Data analytics tools often include pre-built machine learning algorithms for predictive analytics.
- Data Mining and Pattern Recognition: They help discover patterns and relationships in data.
- Predictive Modeling: Tools enable the development and evaluation of predictive models.
- Report Generation: They offer functionalities for generating reports and dashboards for data insights.
- Data Export and Sharing: Tools allow data export and sharing with others for collaboration.
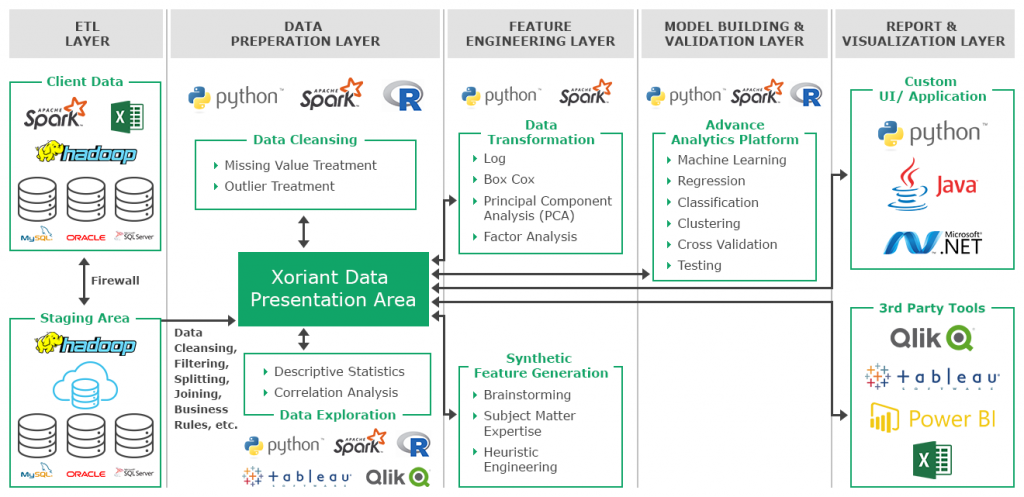
How Data Analytics Tools Work and Architecture?
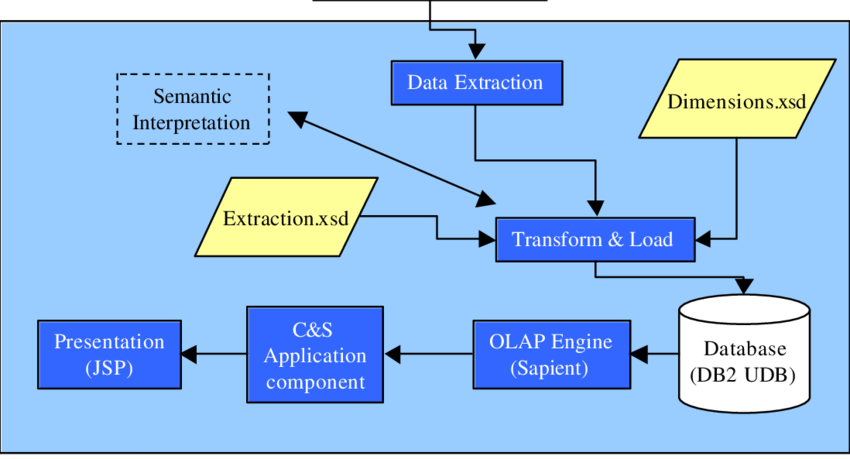
The architecture of data analytics tools can vary based on the specific tool and its functionalities. Generally, they involve the following steps:
- Data Ingestion: Data is ingested from various sources and integrated into the tool.
- Data Exploration and Visualization: Data analysts explore and visualize data to gain insights.
- Data Cleaning and Preprocessing: Data is cleaned and prepared for analysis.
- Statistical Analysis and Modeling: Statistical methods and machine learning algorithms are applied to the data.
- Predictive Analytics: Models are developed and evaluated for predictive analytics.
- Report Generation and Visualization: Reports and visualizations are generated to communicate insights.
How to Install Data Analytics Tools?
The installation process for data analytics tools depends on the specific tool you want to use. Many data analytics tools are available as standalone applications or cloud-based platforms. Some popular data analytics tools include:
- Microsoft Power BI: For Windows, you can download and install Power BI from the Microsoft website.
- Tableau: Tableau Desktop can be installed by downloading the installer from Tableau’s website.
- Python Data Analytics Libraries: Libraries like pandas, NumPy, and matplotlib can be installed using pip, the Python package manager.
- R Programming: R and RStudio can be installed separately by downloading their respective installers.
- Google Data Studio: It is a web-based tool accessible through a web browser.
- QlikView: QlikView is available for download from Qlik’s website.
Please visit the official websites of the data analytics tools you wish to install for detailed and up-to-date installation instructions specific to each tool.
Basic Tutorials of Data Analytics Tools: Getting Started
Below are step-by-step basic tutorials for getting started with popular Data Analytics Tools:
Data Analytics Tool: Microsoft Power BI
- Installing Microsoft Power BI:
- Download the Power BI Desktop installer from the Microsoft site.
- Run the installer and apply the given screen instructions to accomplish the installation.
2. Connecting to Data Sources:
- Launch Power BI Desktop and click on “Get Data” to connect to data sources like Excel, SQL Server, or CSV files.
- Choose the data source, provide necessary credentials, and load the data into Power BI.
3. Data Exploration and Visualization:
- Use the “Data” view to clean and preprocess the data.
- Create visualizations like charts, graphs, and tables using the “Report” view.
4. Creating a Dashboard:
- Combine multiple visualizations into a dashboard.
- Add filters and slicers to make the dashboard interactive.
5. Sharing and Publishing:
- Publish the dashboard to Power BI service for sharing with others.
- Collaborate and collaborate with teammates in real-time.
Data Analytics Tool: Tableau
- Installing Tableau Desktop:
- Download the Tableau Desktop installer from the Tableau website.
- Run the installer and apply the given screen instructions to accomplish the installation.
2. Connecting to Data Sources:
- Launch Tableau Desktop and connect to data sources like Excel, databases, or cloud-based storage.
- Select the relevant tables or sheets to import the data.
3. Data Exploration and Visualization:
- Apply drag and drop areas onto the canvas to create visualizations.
- Use the “Show Me” feature to choose suitable chart types.
4. Creating a Dashboard:
- Combine multiple visualizations on a dashboard.
- Add filters and parameters to make the dashboard interactive.
5. Publishing to Tableau Server/Online:
- Publish the dashboard to Tableau Server or Tableau Online for sharing with others.
- Collaborate and access the dashboard from a web browser.
Data Analytics Tool: Python Data Analytics Libraries (pandas, NumPy, matplotlib)
- Installing Python and Required Libraries:
- Install Python from the Python website or Anaconda distribution.
- Install pandas, NumPy, and matplotlib using pip or conda.
2. Data Loading and Exploration:
- Use pandas to read data from CSV files or databases.
- Explore data using pandas DataFrame operations and basic statistics.
3. Data Visualization with matplotlib:
- Create basic visualizations like line plots, bar charts, and scatter plots using matplotlib.
4. Data Analysis with pandas:
- Perform data manipulation, filtering, and aggregation using pandas DataFrames.
Data Analytics Tool: R Programming
- Installing R and RStudio:
- Download and install R from the official website.
- Download and install RStudio, an integrated development environment for R.
2. Data Loading and Exploration:
- Use R’s base functions or packages like readr to read data from CSV files or databases.
- Explore data using summary statistics and data visualization packages like ggplot2.
3. Data Analysis with dplyr:
- Perform data manipulation, filtering, and aggregation using the dplyr package.
These tutorials will help you get started with these popular data analytics tools. As you progress, you can explore more advanced features and functionalities to leverage the full potential of each tool for your data analysis and visualization needs.

👤 About the Author
Ashwani is passionate about DevOps, DevSecOps, SRE, MLOps, and AiOps, with a strong drive to simplify and scale modern IT operations. Through continuous learning and sharing, Ashwani helps organizations and engineers adopt best practices for automation, security, reliability, and AI-driven operations.
🌐 Connect & Follow:
- Website: WizBrand.com
- Facebook: facebook.com/DevOpsSchool
- X (Twitter): x.com/DevOpsSchools
- LinkedIn: linkedin.com/company/devopsschool
- YouTube: youtube.com/@TheDevOpsSchool
- Instagram: instagram.com/devopsschool
- Quora: devopsschool.quora.com
- Email– contact@devopsschool.com
Find Trusted Cardiac Hospitals
Compare heart hospitals by city and services — all in one place.
Explore Hospitals