What are Data Science Platforms?
Data Science Platforms are software tools and frameworks that provide an integrated environment for data scientists and analysts to perform end-to-end data science tasks. These platforms offer a suite of tools and functionalities to access, explore, analyze, and visualize data, as well as build and deploy machine learning models and predictive analytics solutions. Data science platforms aim to streamline the data science workflow, making it easier for teams to collaborate, share insights, and deliver data-driven solutions.
Top 10 use cases of Data Science Platforms:
- Data Exploration and Preprocessing: Exploring and cleaning large datasets to prepare them for analysis.
- Machine Learning Model Development: Building, training, and evaluating machine learning models for various applications.
- Predictive Analytics: Developing predictive models to make data-driven predictions and forecasts.
- Automated Machine Learning (AutoML): Utilizing automated tools to streamline the process of model selection and hyperparameter tuning.
- Data Visualization: Creating interactive and informative visualizations to communicate insights effectively.
- Big Data Analytics: Analyzing large-scale datasets using distributed computing frameworks.
- Natural Language Processing (NLP): Analyzing and extracting insights from textual data.
- Time Series Analysis: Analyzing time-dependent data and forecasting future trends.
- Recommendation Systems: Building recommendation engines for personalized content or product recommendations.
- Anomaly Detection: Identifying anomalies or outliers in data for anomaly detection applications.
What are the feature of Data Science Platforms?
- Data Access and Integration: Platforms provide tools to access, ingest, and integrate data from various sources.
- Data Exploration and Visualization: They offer interactive data exploration and visualization capabilities to gain insights from data.
- Model Development and Training: Data science platforms include tools for building, training, and evaluating machine learning models.
- Automated Machine Learning (AutoML): Some platforms offer automated model selection and hyperparameter tuning.
- Model Deployment and Management: Platforms allow deploying and managing machine learning models in production environments.
- Collaboration and Sharing: They provide features for teams to collaborate, share insights, and work together on projects.
- Version Control: Many platforms support version control to track changes to code and data.
- Scalability and Performance: Some platforms can handle big data and leverage distributed computing for scalability and performance.
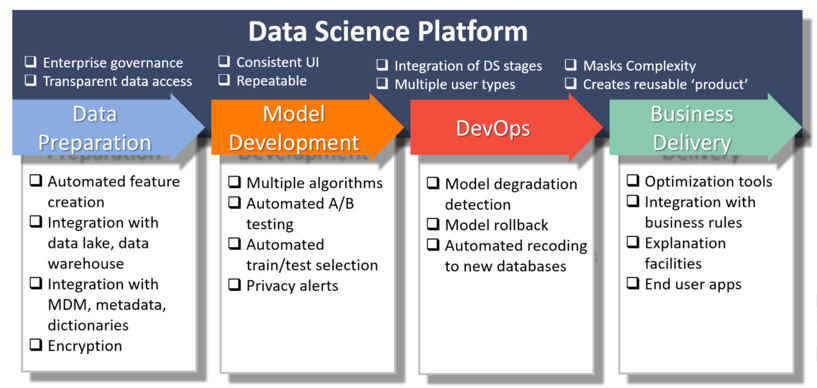
How Data Science Platforms Work and Architecture?
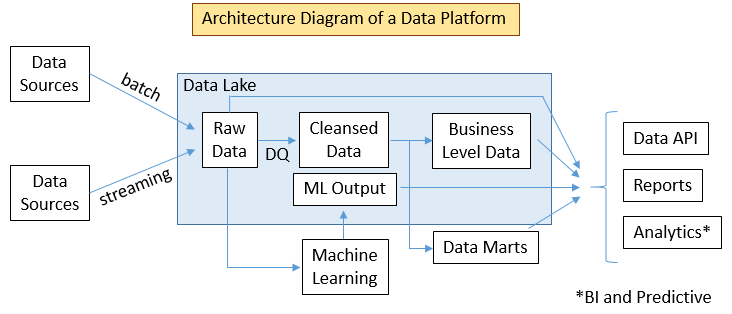
The architecture of data science platforms can vary based on the specific platform and its functionalities. Generally, they involve the following components:
- Data Ingestion: Data is ingested from various sources and integrated into the platform.
- Data Exploration and Visualization: Data scientists explore and visualize data to gain insights.
- Model Development: Machine learning models are developed using various algorithms and techniques.
- Model Training and Evaluation: Models are trained and evaluated using historical data.
- Model Deployment: Selected models are deployed to production environments.
- Collaboration and Sharing: Teams collaborate, share insights, and work together on projects.
How to Install Data Science Platforms?
Installing data science platforms typically involves setting up the platform’s environment and dependencies. Data science platforms can be installed on local machines or deployed on cloud-based services.
Some popular data science platforms include Anaconda, Jupyter, IBM Watson Studio, Databricks, and Google Colab.
Installation instructions can vary depending on the platform and the environment in which you choose to deploy it. It is recommended to refer to the official documentation and websites of the specific data science platform you wish to install for detailed and up-to-date installation instructions.
Basic Tutorials of Data Science Platforms: Getting Started
Below are step-by-step basic tutorials for getting started with popular Data Science Platforms:
Data Science Platform: Microsoft Power BI
- Installing Microsoft Power BI:
- Download the Power BI Desktop installer from the Microsoft site.
- Run the installer and apply the given screen instructions to accomplish the installation.
- Connecting to Data Sources:
- Launch Power BI Desktop and click on “Get Data” to connect to data sources like Excel, SQL Server, or CSV files.
- Choose the data source, provide necessary credentials, and load the data into Power BI.
- Data Exploration and Visualization:
- Use the “Data” view to clean and preprocess the data.
- Create visualizations like charts, graphs, and tables using the “Report” view.
- Creating a Dashboard:
- Combine multiple visualizations into a dashboard.
- Add filters and slicers to make the dashboard interactive.
- Sharing and Publishing:
- Publish the dashboard to Power BI service for sharing with others.
- Collaborate and collaborate with teammates in real-time.
Data Science Platform: Tableau
- Installing Tableau Desktop:
- Download the Tableau Desktop installer from the Tableau website.
- Run the installer and apply the given screen instructions to accomplish the installation.
2. Connecting to Data Sources:
- Launch Tableau Desktop and connect to data sources like Excel, databases, or cloud-based storage.
- Select the relevant tables or sheets to import the data.
3. Data Exploration and Visualization:
- Apply drag and drop areas onto the canvas to create visualizations.
- Use the “Show Me” feature to choose suitable chart types.
4. Creating a Dashboard:
- Combine multiple visualizations on a dashboard.
- Add filters and parameters to make the dashboard interactive.
5. Publishing to Tableau Server/Online:
- Publish the dashboard to Tableau Server or Tableau Online for sharing with others.
- Collaborate and access the dashboard from a web browser.
Data Science Platform: Python Data Analytics Libraries (pandas, NumPy, matplotlib)
- Installing Python and Required Libraries:
- Install Python from the Python website or Anaconda distribution.
- Install pandas, NumPy, and matplotlib using pip or conda.
2. Data Loading and Exploration:
- Use pandas to read data from CSV files or databases.
- Explore data using pandas DataFrame operations and basic statistics.
3. Data Visualization with matplotlib:
- Create basic visualizations like line plots, bar charts, and scatter plots using matplotlib.
4. Data Analysis with pandas:
- Perform data manipulation, filtering, and aggregation using pandas DataFrames.
Data Science Platform: R Programming
- Installing R and RStudio:
- Download and install R from their official website.
- Download and install RStudio, an integrated development environment for R.
2. Data Loading and Exploration:
- Use R’s base functions or packages like readr to read data from CSV files or databases.
- Explore data using summary statistics and data visualization packages like ggplot2.
3. Data Analysis with dplyr:
- Perform data manipulation, filtering, and aggregation using the dplyr package.
These tutorials will help you get started with these popular data science platforms. As you progress, you can explore more advanced features and functionalities to leverage the full potential of each platform for your data analysis and visualization needs.

👤 About the Author
Ashwani is passionate about DevOps, DevSecOps, SRE, MLOps, and AiOps, with a strong drive to simplify and scale modern IT operations. Through continuous learning and sharing, Ashwani helps organizations and engineers adopt best practices for automation, security, reliability, and AI-driven operations.
🌐 Connect & Follow:
- Website: WizBrand.com
- Facebook: facebook.com/DevOpsSchool
- X (Twitter): x.com/DevOpsSchools
- LinkedIn: linkedin.com/company/devopsschool
- YouTube: youtube.com/@TheDevOpsSchool
- Instagram: instagram.com/devopsschool
- Quora: devopsschool.quora.com
- Email– contact@devopsschool.com
Find Trusted Cardiac Hospitals
Compare heart hospitals by city and services — all in one place.
Explore Hospitals