What is AppDynamics?
AppDynamics is a leading Application Performance Management (APM) and business observability platform designed to provide deep insights into your applications and infrastructure. It goes beyond traditional monitoring by offering real-time visibility into code-level performance, user experience, and business outcomes.
Here are some key features of AppDynamics:
- Full-stack Application Monitoring: Monitor everything from code to databases, including application performance, user experience, and infrastructure health.
- Real-time Insights: Get instant visibility into your system’s performance with real-time dashboards and alerts.
- AI-powered Anomaly Detection: Leverage machine learning to identify potential issues before they impact users.
- Root Cause Analysis: Quickly pinpoint the source of performance problems with detailed diagnostics.
- Business Impact Tracking: Understand how application performance directly impacts business metrics like revenue and conversion rates.
Top 10 use cases of AppDynamics?
As for the top 10 use cases of AppDynamics, they include:
1. Performance Monitoring: Identify and resolve performance bottlenecks across your entire application stack.
2. User Experience Monitoring: Monitor real user experience (RUM) metrics to ensure a smooth and efficient user journey.
3. Digital Customer Experience (DX) Optimization: Gain insights into user behavior and optimize your applications for better engagement and conversion.
4. Cloud Migration and Modernization: Monitor and optimize applications running in the cloud for optimal performance and cost efficiency.
5. Microservices Troubleshooting: Understand how microservices interact and identify issues within complex distributed systems.
6. DevOps Collaboration: Break down silos between development and operations teams with shared visibility and insights.
7. Security Monitoring: Detect and investigate potential security threats across your applications and infrastructure.
8. Compliance Reporting: Generate reports to demonstrate compliance with industry regulations and standards.
9. Cost Optimization: Identify areas for cost savings by optimizing resource utilization and infrastructure spending.
10. Continuous Improvement: Track progress towards performance goals and identify opportunities for ongoing improvement.
AppDynamics is a powerful tool for organizations of all sizes looking to improve the performance, reliability, and scalability of their applications. It empowers teams to:
- Deliver exceptional user experiences
- Make data-driven decisions
- Optimize resource utilization and costs
- Reduce time to market
- Improve business agility and competitiveness
What are the feature of AppDynamics?
AppDynamics boasts a rich suite of features designed to provide deep insights and actionable intelligence across your entire application ecosystem. Here are some key highlights:
Full-Stack Application Monitoring:
- Code-level Monitoring: Dive into code-level performance data to pinpoint the exact lines of code impacting performance.
- Transaction Tracing: Trace entire user journeys across your application stack, identifying bottlenecks and slowdowns.
- Database Visibility: Monitor database performance and identify queries causing inefficiencies.
- Infrastructure Monitoring: Gain visibility into the health and performance of your servers, network, and cloud resources.
Real-time Insights and Analytics:
- Live Dashboards: Visualize key metrics and gain real-time insights into your application health and performance.
- Ad-hoc Analysis: Craft custom queries and analyze your data from any angle to answer specific questions.
- Business Impact Tracking: Track how application performance directly impacts business KPIs like revenue and conversion rates.
- AI-powered Insights: Leverage AI and machine learning for anomaly detection, proactive alerts, and personalized recommendations.
Root Cause Analysis and Troubleshooting:
- Detailed Diagnostics: Analyze detailed performance data to pinpoint the source of issues quickly and efficiently.
- Distributed Tracing: See how components interact within complex distributed systems to identify the root cause of problems.
- Alerts and Notifications: Set up custom alerts to be notified of critical issues or performance anomalies.
- Incident Response: Streamline incident response with real-time data and collaboration tools.
Additional Features:
- Scalability and Flexibility: AppDynamics scales horizontally to handle massive data volumes and complex architectures.
- Open APIs and Integrations: Integrate AppDynamics with your existing tools and workflows for seamless data exchange.
- Collaboration Tools: Share dashboards, reports, and insights with your team to work together effectively.
- Security and Compliance: AppDynamics adheres to strict security standards and data privacy regulations.
These features make AppDynamics a powerful tool for:
- Identifying and resolving performance bottlenecks across your entire application stack.
- Understanding how application performance impacts business outcomes.
- Improving user experience and customer satisfaction.
- Streamlining development and operations processes.
- Making data-driven decisions for continuous improvement.
How AppDynamics works and Architecture?
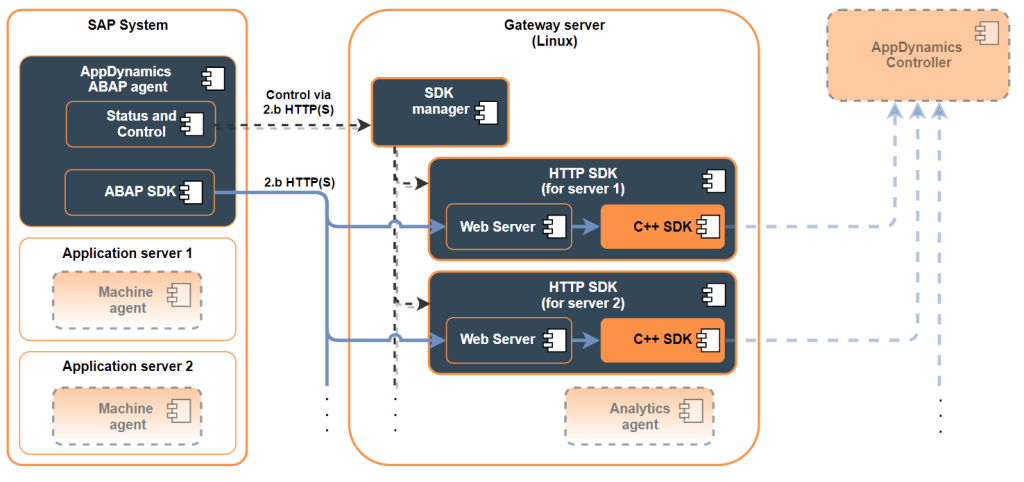
AppDynamics’ power lies in its highly distributed architecture, designed to handle real-time data ingestion, analysis, and visualization for complex applications and infrastructure. Here’s a breakdown of the key components:
Data Ingestion:
- Agents: Installed on servers, containers, and databases, agents collect performance data at the source.
- Collectors: Regional collector clusters receive data from agents, process it initially, and route it to the appropriate destination.
- Pre-processing and Aggregation: Data is normalized, filtered, and aggregated for faster analysis and storage efficiency.
Data Analysis and Storage:
- Distributed Database: Processed data is stored in a horizontally scaled, geo-distributed database across multiple nodes.
- Query Engine: Users submit queries through the AppDynamics platform interface or APIs.
- Parallel Processing: The query engine analyzes data location and distributes the workload to relevant database nodes.
- Aggregated Results: Partial results from each node are combined and presented to the user in real-time dashboards and reports.
Key Architectural Highlights:
- Distributed Agents: Collect data locally near the source for reduced latency and efficient data capture.
- Geo-distributed Database: Ensures high availability and fault tolerance even during regional outages.
- Pre-processed Data: Minimizes processing overhead during query execution, enabling faster response times.
- Parallel Query Processing: Leverages the power of multiple database nodes for fast data analysis.
Additional Layers:
- Machine Learning and AI: Powers anomaly detection, root cause analysis, and proactive recommendations.
- Analytics Engine: Enables deep data analysis and visualization through custom dashboards and reports.
- Integration Layer: Connects AppDynamics with various tools and platforms for a unified view of your IT ecosystem.
Benefits of this architecture:
- Highly scalable: Handles massive data volumes with minimal performance degradation.
- Real-time insights: Provides instant visibility into application and infrastructure performance.
- Fault-tolerant: Ensures high availability and minimizes downtime risks.
- Cost-effective: Easy data storage and processing optimizes resource utilization.
How to Install AppDynamics it?
Installing AppDynamics involves setting up various components like agents, collectors, and the controller. The specific steps can vary depending on your infrastructure and desired configuration. Here’s a general outline:
1. Choose your deployment:
- Cloud Deployment: This is the easiest option, ideal for cloud-native applications. Choose your desired cloud provider and follow the AppDynamics cloud deployment guide.
- On-Premise Deployment: This offers more control and flexibility for complex on-premise environments. Download the AppDynamics platform and follow the on-premise installation guide.
2. Install Agents:
- Application Agents: Deploy agents on your application servers and databases to collect performance data. Choose the appropriate agent based on your platform (Java, .NET, Node.js, etc.).
- Infrastructure Agents: Install agents on your infrastructure components like servers, routers, and load balancers to monitor their health and performance.
3. Configure Collectors:
- Collectors gather data from agents and route it to the AppDynamics platform. Configure collectors based on your geographical location and data volume.
4. Install and Configure the Controller:
- The controller is the central hub for data visualization, analysis, and alerting. Install it on your preferred platform (physical server, virtual machine, container) and configure settings like license keys and connection details.
5. Verify Installation:
- Once all components are installed and configured, launch the AppDynamics platform and verify agent connections and data flow. Start exploring dashboards and reports to confirm everything is working correctly.
Always remember, the installation process can be complex and may require advanced technical knowledge depending on your environment. Consider seeking assistance from AppDynamics support or professional consultants if needed.
Basic Tutorials of AppDynamics: Getting Started
Ready to unlock the power of AppDynamics and gain deep insights into your application performance? Let’s delve into some basic tutorials to get you started:
1. Setting Up Your Account:
- Head to the AppDynamics official website and create a free trial account.
- You’ll receive a Controller URL and credentials for accessing the web interface.
2. Installing Agents:
- Choose the appropriate AppDynamics agent for your application technology (e.g., Java, .NET, PHP).
- Download and install the agent on your servers or containers hosting the application.
- Use the Controller URL and credentials during installation to establish communication with AppDynamics.
3. Monitoring Application Performance:
- Once the agent starts sending data, navigate to the Dashboard section in AppDynamics.
- Pre-built dashboards offer instant insights into key metrics like response times, errors, API calls, and resource utilization.
- Drill down into specific transactions and code traces to identify performance bottlenecks and pinpoint problem areas.
4. Exploring Business Transactions:
- AppDynamics excels at tracing business transactions across your application infrastructure.
- Navigate to the Business Transactions section to see visualizations of transaction flows and identify slow or problematic journeys.
- Analyze bottlenecks and optimize transaction flows for a smoother user experience.
5. Customizing Monitoring and Alerts:
- AppDynamics allows extensive customization of dashboards, metrics, and alerts.
- Create custom dashboards to focus on specific metrics relevant to your application and workflows.
- Define custom alerts based on thresholds for critical metrics to receive proactive notifications about potential issues.
6. Leveraging Machine Learning:
- AppDynamics integrates machine learning algorithms to provide predictive insights and anomaly detection.
- Utilize Anomaly Detection to identify unusual performance patterns and potential problems before they impact users.
- Leverage AI-powered recommendations to optimize your application configurations and resource allocation.
7. Expanding Your Observability:
- AppDynamics offers numerous integrations with other monitoring tools and services.
- Explore and utilize these integrations to build a comprehensive view of your entire IT infrastructure.
- Consider extending monitoring to databases, infrastructure components, and other critical systems.
Note:
- Start small by monitoring a single application or service initially.
- Focus on understanding key metrics and identifying performance bottlenecks.
- Leverage AppDynamics’ rich resources and documentation to explore advanced features and customization options.
- Join the active AppDynamics community to learn from other users and get expert advice.
Bonus Tutorial: Try the Getting Started Wizard:
- AppDynamics offers a guided Getting Started Wizard to ease your initial configuration.
- This wizard helps choose the right agents, configure monitoring, and set up basic alerts in just a few steps.
- Utilize the wizard for a quick dive into AppDynamics’ capabilities and gain confidence for further exploration.
By following these step-by-step tutorials and embracing the world of AppDynamics, you’ll be on your way to mastering application performance monitoring and achieving robust observability for your entire IT ecosystem. Keep learning, keep exploring, and let AppDynamics guide you towards optimal application performance and user experience!

Find Trusted Cardiac Hospitals
Compare heart hospitals by city and services — all in one place.
Explore Hospitals
Thanks for this clear and practical overview of AppDynamics! I really appreciated how the article goes beyond just defining the tool and explains real use cases — like monitoring application performance, tracing business transactions, and identifying bottlenecks across distributed systems. The way the examples tie AppDynamics to actual observability and troubleshooting scenarios makes it much easier to understand why it’s valuable for performance‑driven teams. Great job making a technical topic feel accessible and actionable!