What is CloudWatch?
Amazon CloudWatch is a comprehensive monitoring and observability service offered by AWS (Amazon Web Services). It empowers you to collect, visualize, and analyze real-time and historical data from your AWS infrastructure, applications, and custom metrics. CloudWatch provides actionable insights to:
- Maintain application performance and availability: Monitor key metrics like CPU utilization, memory usage, network traffic, and custom application metrics to identify and troubleshoot performance bottlenecks, resource constraints, and errors.
- Optimize resource utilization: Gain insights into your resource usage patterns to optimize costs and identify opportunities for consolidation or scaling.
- Debug and troubleshoot issues: Use logs, traces, and metrics to pinpoint the root cause of operational issues and resolve them swiftly.
- Ensure compliance and security: Monitor events, logs, and security data to comply with regulations and identify potential security threats.
- Gain operational insights: Derive meaningful insights from your data to make informed decisions about your infrastructure and applications.
Top 10 use cases of CloudWatch?
Top 10 Use Cases of CloudWatch:
- Website and Application Monitoring:
- Track response times, error rates, resource usage, and user experience metrics.
- Recognise performance bottlenecks and proactively address issues before they influence users.
- Server Monitoring:
- Monitor CPU, memory, disk, and network utilization across your EC2 instances and other AWS resources.
- Receive alerts for critical metrics to ensure optimal server health and performance.
- Container Monitoring:
- Monitor the health and performance of your containerized applications with Container Insights.
- Debug issues within containers and gain insights into resource utilization.
- Log Management:
- Collect, aggregate, and analyze logs from various sources like applications, servers, and network devices.
- Search and filter logs to troubleshoot issues and gain operational insights.
- Custom Metrics Monitoring:
- Define and monitor custom metrics specific to your applications and business needs.
- Gain deeper visibility into the health and performance of your unique services.
- Cost Optimization:
- Track and analyze resource utilization costs across your AWS resources.
- Identify opportunities to optimize costs through rightsizing, reserved instances, and other strategies.
- Alarm and Notification Management:
- Set up custom alarms based on metrics, logs, and events to be notified of potential issues promptly.
- Integrate with notification channels like SMS, email, Slack, or PagerDuty for real-time alerting.
- Compliance and Security Monitoring:
- Monitor security events, logs, and compliance-related metrics.
- Gain insights into potential security threats and ensure adherence to regulatory requirements.
- Performance Analysis and Trends:
- Utilize historical data and visualizations to identify trends and patterns in your metrics.
- Forecast future resource requirements and proactively scale your infrastructure.
- Root Cause Analysis (RCA):
- Combine logs, traces, and metrics to investigate and pinpoint the root cause of complex issues.
- Resolve issues faster and hamper them from recurring.
Beyond the Top 10:
CloudWatch offers a vast array of capabilities beyond these core use cases. You can leverage it for:
- Application performance management (APM) with AWS X-Ray
- Serverless function monitoring with AWS Lambda Insights
- Network traffic analysis with Amazon VPC Flow Logs
- And much more
What are the feature of CloudWatch?
Amazon CloudWatch boasts a robust set of features catering to various monitoring and observability needs across your AWS infrastructure and applications. Following is a breakdown of some key highlights:
Monitoring Capabilities:
- Metrics: Collect and monitor a wide range of built-in metrics from AWS services, custom metrics defined by you, and dimensional metrics providing detailed granularity.
- Logs: Aggregate, store, analyze, and filter logs from applications, servers, network devices, and more. Leverage log insights for efficient troubleshooting and analysis.
- Events: Track events indicating significant changes in your AWS environment, like instance launches, configuration changes, security events, and API calls.
- Alarms: Set up custom alarms based on various criteria, including metrics, logs, and events, to receive timely notifications for potential issues.
- Dashboards: Create customizable dashboards to visualize critical metrics, logs, and events in a single view, facilitating comprehensive monitoring.
Advanced Features:
- Amazon CloudWatch Logs Insights: Perform interactive log queries and filter logs based on specific criteria for efficient troubleshooting and analysis.
- Container Insights: Gain deep visibility into the health and performance of your containerized applications running on Amazon ECS or Amazon EKS.
- Synthetics: Simulate user interactions with your web applications from multiple locations to proactively identify performance issues before they impact real users.
- Lambda Insights: Monitor the performance and invocation patterns of your serverless functions running on AWS Lambda.
- X-Ray: Gain end-to-end tracing insights into the performance of your distributed applications for effective root cause analysis.
- Anomaly Detection: Identify unusual patterns in your metrics using machine learning to proactively detect potential issues before they become critical.
- Cost Explorer: Analyze and optimize your AWS costs by correlating resource utilization with costs for informed spending decisions.
Additional Features:
- Integrations: Integrate CloudWatch with various tools and services like Slack, PagerDuty, and third-party monitoring solutions for streamlined workflows and broader ecosystem visibility.
- API Access: Programmatically access and manage your CloudWatch data using its REST API for automation and custom integrations.
- High Availability and Scalability: CloudWatch leverages a distributed architecture to ensure high availability and scalability, handling diverse monitoring demands effectively.
- Security: CloudWatch encrypts your data at rest and in transit with industry-standard protocols to protect your sensitive information.
Choosing the Right Features:
The specific CloudWatch features you’ll leverage depend on your monitoring needs and environment. Exploring the available features and understanding their functionalities will help you tailor a monitoring strategy that aligns with your goals.
How CloudWatch works and Architecture?
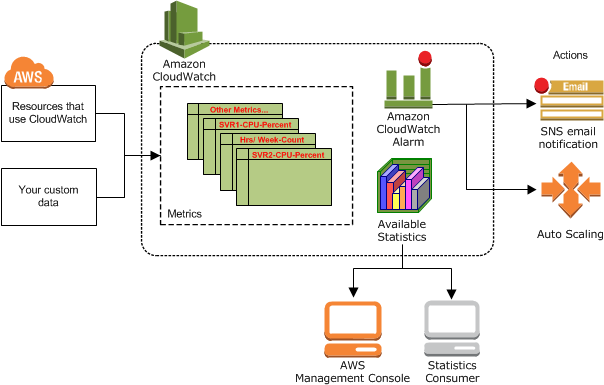
Amazon CloudWatch operates on a distributed and secure architecture designed for scalability, reliability, and efficient handling of your monitoring data. Here’s a breakdown of its key components and how they collaborate:
Data Collection and Aggregation:
- Agents: Lightweight agents installed on your instances or containers collect metrics, logs, and events directly from your resources.
- Amazon EC2 Instance Metadata Service (IMDS): Retrieves dynamic instance metadata for metrics collection.
- AWS SDKs and APIs: Developers can embed code within applications to directly publish custom metrics and logs.
- Integration with AWS Services: Services like DynamoDB and EC2 automatically publish relevant metrics.
- CloudWatch Logs Agent: Forwards logs from various sources to the central log storage.
Data Processing and Storage:
- Data Transfer: Collected data is securely transmitted to geographically distributed data centers through encrypted channels.
- Metrics Processing: Metrics are aggregated, filtered, and stored in time-series databases optimized for fast retrieval and analysis.
- Logs Processing: Logs are ingested, indexed, and compressed for efficient storage and searching.
- Events Processing: Events are filtered and stored in an event stream for real-time processing and analysis.
Analysis and Visualization:
- Console and Dashboards: Users can access real-time and historical data through the CloudWatch console or create custom dashboards for visualization.
- Amazon CloudWatch Logs Insights: Enables interactive log queries and filtering for deep analysis.
- AWS X-Ray: Provides distributed tracing capabilities for complex application performance analysis.
- Cost Explorer: Correlates resource utilization with costs for cost optimization insights.
Alerting and Notification:
- Alarms: Users define custom alarms based on metrics, logs, or events, triggering notifications when thresholds are breached.
- Integration with Notification Channels: CloudWatch seamlessly integrates with tools like Slack, PagerDuty, and SNS for prompt alerts.
Architectural Aspects:
- Scalability: The distributed architecture can handle large volumes of data from diverse sources seamlessly.
- Security: Encryption at rest and in transit, access control mechanisms, and compliance certifications ensure data security.
- High Availability: Redundancy measures across data centers guarantee minimal downtime and reliable monitoring.
- API Access: Programmatically manage your monitoring data and configurations through CloudWatch’s REST API.
Always keep in mind, CloudWatch offers different pricing models catering to various usage levels. You can start with the free tier and explore paid options for increased capacity and advanced features as your needs evolve.
By understanding CloudWatch’s architecture and core functionalities, you’re empowered to make informed decisions about your monitoring strategy and leverage its capabilities to optimize your infrastructure performance and gain valuable insights.
How to Install CloudWatch it?
While Amazon CloudWatch doesn’t require traditional installation as it’s a cloud-based service, several steps are involved in setting it up and integrating it with your resources:
1. Sign Up and Configure Your AWS Account:
- If you haven’t already, create an AWS account at aws amazon official site.
- Set up billing and IAM (Identity and Access Management) settings to grant CloudWatch access to your resources.
2. Access the CloudWatch Console:
- Login to the AWS Management Console and navigate to the CloudWatch service dashboard.
3. Configure Data Collection:
- Metrics:
- No installation required for built-in AWS service metrics.
- For custom metrics, use the AWS SDK or APIs within your applications to publish them.
- Consider installing the CloudWatch Agent on instances or containers for advanced collection options.
- Logs:
- Enable log streams for your resources like EC2 instances, Lambda functions, etc.
- Install the CloudWatch Logs Agent on instances to centralize log collection from various sources.
- Events:
- No configuration needed; CloudWatch automatically captures AWS service events.
4. Set Up Alarms and Notifications:
- Create custom alarms based on metrics, logs, or events to trigger notifications when thresholds are breached.
- Configure notification channels like email, SMS, or integrations with tools like Slack or PagerDuty.
5. Create Dashboards for Visualization:
- Organize and visualize your collected data by creating custom dashboards with relevant metrics, logs, and events.
Considerations:
- Explore advanced features like Amazon CloudWatch Logs Insights for deeper log analysis.
- Integrate CloudWatch with other AWS services like X-Ray for application performance tracing.
- Leverage the CloudWatch API for programmatic management of your monitoring data.
Basic Tutorials of CloudWatch: Getting Started
CloudWatch is a powerful monitoring service offered by Amazon Web Services (AWS) that helps you monitor and troubleshoot your applications, infrastructure, and logs. Following are some step-by-step basic tutorials to get you started:
1. Setting Up CloudWatch Alarms:
- Step 1: Navigate to the CloudWatch console in your AWS account.
- Step 2: Select the “Alarms” section from the left-hand menu.
- Step 3: Click “Create alarm”.
- Step 4: Choose the metric you want to monitor (e.g., CPU utilization, network traffic, API calls).
- Step 5: Configure the alarm conditions (e.g., if CPU utilization is above 80% for 5 minutes).
- Step 6: Select the actions to take when the alarm triggers (e.g., send an email notification, auto-scale your resources).
- Step 7: Set a name and description for your alarm and click “Create alarm”.
2. Creating Dashboards for Visualization:
- Step 1: Go to the “Dashboards” section in the CloudWatch console.
- Step 2: Click “Create dashboard”.
- Step 3: Give your dashboard a name and choose a layout.
- Step 4: Click “Add widget” and select the metrics you want to display (e.g., line graphs, pie charts).
- Step 5: Configure the widget options (e.g., time range, statistics).
- Step 6: Arrange the widgets on the dashboard and customize the layout.
- Step 7: Share your dashboard with other users or embed it in your applications.
3. Monitoring Logs with CloudWatch Logs:
- Step 1: Navigate to the “Logs” section in the CloudWatch console.
- Step 2: Select the log group you want to monitor (e.g., your application logs).
- Step 3: Use the search bar and filters to find specific log entries.
- Step 4: Create log insights to analyze your logs with predefined queries and visualizations.
- Step 5: Set up log subscriptions to route your logs to other services like Amazon Elasticsearch Service for further analysis.
4. Exploring Additional CloudWatch Features:
- CloudWatch Events: Trigger actions based on events or changes in your AWS resources.
- CloudWatch Agent: Collect metrics from on-premises servers and send them to CloudWatch.
- CloudWatch Cost Explorer: Analyze and optimize your CloudWatch costs.
Note: These are just basic tutorials to get you started. CloudWatch offers a wide range of functionalities.

Find Trusted Cardiac Hospitals
Compare heart hospitals by city and services — all in one place.
Explore Hospitals