What is Cobertura ?

Cobertura is an open-source code coverage tool for Java projects. It helps developers measure the code coverage of their tests by analyzing which parts of the codebase are executed during test runs.
Top 10 use cases of Cobertura ?
Here are the top 10 use cases for Cobertura:
- Code Coverage Analysis:
- Cobertura measures the percentage of code that is executed by automated tests. It gives insights into which parts of the codebase are covered by tests and which are not.
- Identifying Uncovered Code:
- Cobertura highlights code segments that are not covered by tests. This helps developers identify areas of the codebase that require additional test coverage.
- Tracking Test Effectiveness:
- By analyzing code coverage trends over time, developers can track the effectiveness of their test suites. They can ensure that new code changes are adequately covered by tests and that test coverage does not regress over time.
- Integration with Build Systems:
- Cobertura integrates with popular build systems such as Maven, Ant, and Gradle. This allows developers to automatically generate code coverage reports as part of the build process.
- Continuous Integration (CI):
- Incorporating Cobertura into CI/CD pipelines enables automated code coverage analysis with each build. This ensures that code changes are tested thoroughly before being deployed.
- Setting Coverage Targets:
- Developers can define coverage targets based on organizational or project-specific requirements. Cobertura helps track progress towards these targets and ensures that code coverage goals are met.
- Identifying Test Gaps:
- Cobertura reveals gaps in test coverage by showing which parts of the codebase are not exercised by existing tests. Developers can use this information to write additional tests to cover these areas.
- Code Review Assistance:
- Cobertura reports can be valuable during code reviews, as they provide visibility into the quality and thoroughness of test coverage. Reviewers can identify uncovered code segments and suggest improvements.
- Regression Testing:
- When making changes to the codebase, developers can use Cobertura to ensure that new code does not introduce regressions in test coverage. They can run Cobertura before and after code changes to verify coverage integrity.
- Educating Developers:
- Cobertura fosters a culture of test-driven development (TDD) by encouraging developers to write tests that cover all parts of the codebase. It helps educate developers about the importance of test coverage and quality.
Cobertura is a valuable tool for improving test coverage and ensuring the reliability and maintainability of Java codebases. It facilitates better testing practices, enhances code quality, and contributes to overall software reliability.
What are the feature of Cobertura ?
Cobertura is a popular code coverage tool for Java projects. It offers several features to help developers measure the effectiveness of their test suites and identify areas of the codebase that require additional testing. Here are some of the key features of Cobertura:
- Code Coverage Analysis:
- Cobertura measures the percentage of code that is executed by automated tests, known as code coverage.
- It gives detailed reports indicating which parts of the codebase are covered by tests and which are not.
- Line, Branch, and Method Coverage:
- Cobertura supports different types of code coverage metrics, including line coverage, branch coverage, and method coverage.
- Developers can analyze coverage at the level of individual lines of code, branches (such as if statements), and methods.
- Integration with Build Systems:
- Cobertura integrates seamlessly with popular Java build systems such as Maven, Ant, and Gradle.
- It can be easily incorporated into the build process to generate code coverage reports automatically.
- Multiple Report Formats:
- Cobertura generates code coverage reports in various formats, including HTML, XML, and CSV.
- These reports provide detailed information about code coverage metrics, uncovered code segments, and coverage trends over time.
- Historical Reporting:
- Cobertura maintains historical data about code coverage trends over multiple test runs.
- Developers can track changes in code coverage over time to ensure that coverage targets are being met and to identify trends in test effectiveness.
- Coverage Thresholds:
- Developers can define coverage thresholds based on project requirements or organizational standards.
- Cobertura allows users to set minimum acceptable coverage levels and generates warnings or errors if coverage falls below these thresholds.
- Customizable Reporting:
- Cobertura offers flexibility in generating code coverage reports.
- Users can customize the content and format of reports to meet specific requirements or integrate with other tools and systems.
- IDE Integration:
- Cobertura integrates with popular Java Integrated Development Environments (IDEs) such as IntelliJ IDEA, Eclipse, and NetBeans.
- Developers can view code coverage information directly within their IDEs and use it to guide test development and debugging.
- Continuous Integration (CI) Support:
- Cobertura is well-suited for integration into Continuous Integration (CI) pipelines.
- It can be configured to run as part of automated build and test processes, providing immediate feedback on code coverage metrics.
- Open-Source and Extensible:
- Cobertura is an open-source tool with an active community of developers and contributors.
- It is highly extensible, allowing users to customize and extend its functionality as needed to suit their specific requirements.
These features make Cobertura a valuable tool for Java developers seeking to improve the quality and reliability of their code through effective test coverage analysis.
How Cobertura works and Architecture?
Cobertura works by instrumenting Java bytecode to track which parts of the code are executed during test runs, and then generates reports based on this information to provide insights into code coverage. Here’s an overview of how Cobertura works and its architecture:
- Bytecode Instrumentation:
- Cobertura instruments the Java bytecode of the classes being tested. It modifies the bytecode to insert additional instructions for tracking code coverage.
- These instructions record information about which lines of code, branches, and methods are executed during test runs.
- Test Execution:
- After bytecode instrumentation, the instrumented classes are used during test execution.
- As the tests are run, the instrumented bytecode tracks the execution of each line of code, branch decisions, and method invocations.
- Data Collection:
- Cobertura collects coverage data during test execution. It records information about which parts of the code have been executed and how many times.
- Coverage data is typically stored in memory or written to temporary files during test execution.
- Coverage Analysis:
- Once the tests are complete, Cobertura analyzes the collected coverage data to determine the code coverage metrics.
- It calculates metrics such as line coverage, branch coverage, and method coverage based on the recorded execution information.
- Report Generation:
- Cobertura generates code coverage reports based on the analyzed coverage data.
- These reports provide detailed information about the coverage metrics, including which lines of code are covered by tests and which are not.
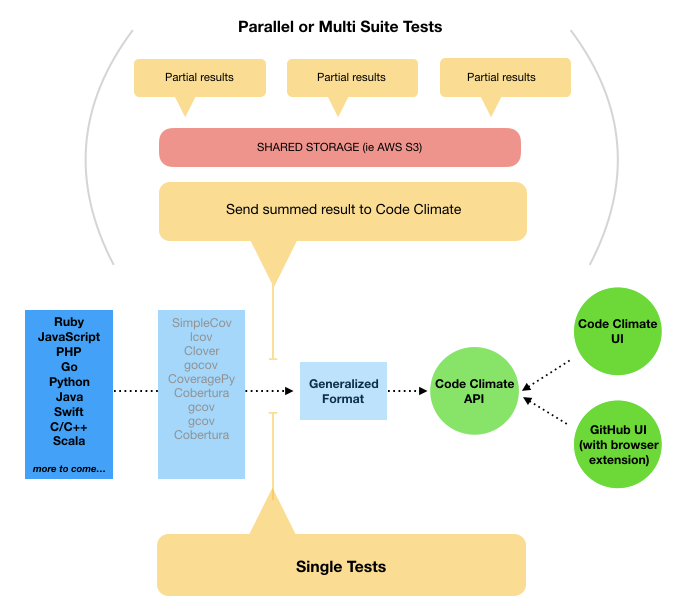
- Report Formats:
- Cobertura supports multiple report formats, including HTML, XML, and CSV.
- HTML reports are commonly used for interactive visualization of code coverage results, while XML and CSV reports are suitable for automated processing and integration with other tools.
- Integration with Build Systems:
- Cobertura integrates with popular Java build systems such as Maven, Ant, and Gradle.
- It can be configured to run as part of the build process, automatically generating code coverage reports after tests are executed.
- Continuous Integration (CI) Support:
- Cobertura is often used in Continuous Integration (CI) pipelines to monitor code coverage trends and ensure that coverage targets are being met.
- It can be integrated into CI workflows to provide immediate feedback on code coverage metrics with each build.
- Customization and Configuration:
- Cobertura provides options for customizing and configuring the coverage analysis process.
- Users can define coverage thresholds, customize report content and formatting, and adjust instrumentation settings to suit their specific requirements.
Cobertura’s architecture involves bytecode instrumentation, test execution, data collection, coverage analysis, and report generation to provide insights into code coverage and facilitate the improvement of test suites.
How to Install Cobertura it?
To install Cobertura, a code coverage tool for Java projects, you have a few options based on your development environment. Let’s explore how to set it up:
- Maven Integration (Recommended for Java Projects):
- First, add the Cobertura Maven plugin to your project’s
pom.xmlfile under thereportingsection:<reporting> <plugins> <plugin> <groupId>org.codehaus.mojo</groupId> <artifactId>cobertura-maven-plugin</artifactId> <version>2.7</version> </plugin> </plugins> </reporting> - Run Maven with the goal
cobertura:cobertura. This will generate a detailed HTML-style report showing code coverage statistics gathered via code instrumentation. The report includes line coverage and branch coverage metrics.
2. Eclipse Integration (Using eCobertura):
- If you’re using Eclipse, you can install the eCobertura plugin:
- Go to the Eclipse menu and select Help → Install New Software.
- In the “Work with” field, place this URL.
- Select eCobertura Code Coverage, click “Next,” and follow the installation wizard.
- Once installed, you’ll be able to view code coverage directly within Eclipse.
3. Alternative Eclipse Plugin (EclEmma):
- If you encounter issues with eCobertura, consider applying the EclEmma plugin:
- Install it via the Eclipse Marketplace by searching for “EclEmma.”
- After installation, restart Eclipse.
- To find the coverage of your test cases, right-click on the desired package or project, go to Coverage As → JUnit Test, or open the Coverage View from Window → Show View → Other → Java → Coverage.
Remember to choose the method that best suits your development environment and project requirements.
Basic Tutorials of Cobertura: Getting Started
Here’s a basic step-by-step tutorial to help you get started with Cobertura for measuring code coverage in your Java projects:
- Add Cobertura Plugin to Your Build System:
- If you’re using Maven, add the Cobertura plugin to your
pom.xmlfile:
        <build>
    <plugins>
        <plugin>
            <groupId>org.codehaus.mojo</groupId>
            <artifactId>cobertura-maven-plugin</artifactId>
            <version>2.7</version>
            <configuration>
                <!-- Optional: Specify where to store Cobertura coverage reports -->
                <formats>
                    <format>html</format>
                </formats>
            </configuration>
            <executions>
                <execution>
                    <goals>
                        <goal>cobertura</goal>
                    </goals>
                </execution>
            </executions>
        </plugin>
    </plugins>
</build>
Code language: HTML, XML (xml)- If you’re using Gradle, add the Cobertura plugin to your
build.gradlefile.
2. Configure Your IDE:
- If you’re using an IDE like IntelliJ IDEA or Eclipse, make sure the Cobertura plugin is installed and configured.
- This allows you to view code coverage information directly within your IDE.
3. Run Your Tests with Cobertura:
- Execute your tests with Cobertura instrumentation enabled. This can typically be done using a Maven or Gradle command, or directly within your IDE.
- For Maven, you can run
mvn clean cobertura:cobertura. - For Gradle, you can run
./gradlew clean cobertura.
4. View Code Coverage Reports:
- After running your tests, Cobertura will generate code coverage reports in the specified format (e.g., HTML).
- Open the generated reports using a web browser or other appropriate viewer.
- The reports will provide insights into code coverage metrics, highlighting which lines, branches, and methods are covered by your tests and which are not.
5. Analyze Coverage Results:
- Review the code coverage reports to identify areas of the codebase that are not adequately covered by tests.
- Use the coverage information to prioritize writing additional tests for uncovered code segments.
6. Track Coverage Trends:
- As you make changes to your code and tests, regularly rerun the Cobertura analysis to track coverage trends over time.
- Ensure that coverage levels are maintained or improved with each code change.
7. Integrate with CI/CD Pipelines:
- Integrate Cobertura into your Continuous Integration (CI) or Continuous Deployment (CD) pipelines to automate code coverage analysis with each build.
- Configure your CI/CD system to fail builds if coverage falls below certain thresholds.
8. Refine and Improve Tests:
- Use code coverage information to guide the development of new tests and improve the effectiveness of existing tests.
- Aim to achieve high test coverage across all critical parts of your codebase.
By following these steps, you can effectively use Cobertura to measure code coverage in your Java projects and improve the quality and reliability of your code through comprehensive test coverage.

Find Trusted Cardiac Hospitals
Compare heart hospitals by city and services — all in one place.
Explore Hospitals