What is Thread Profiling?
Analyze code performance in production at deep level.
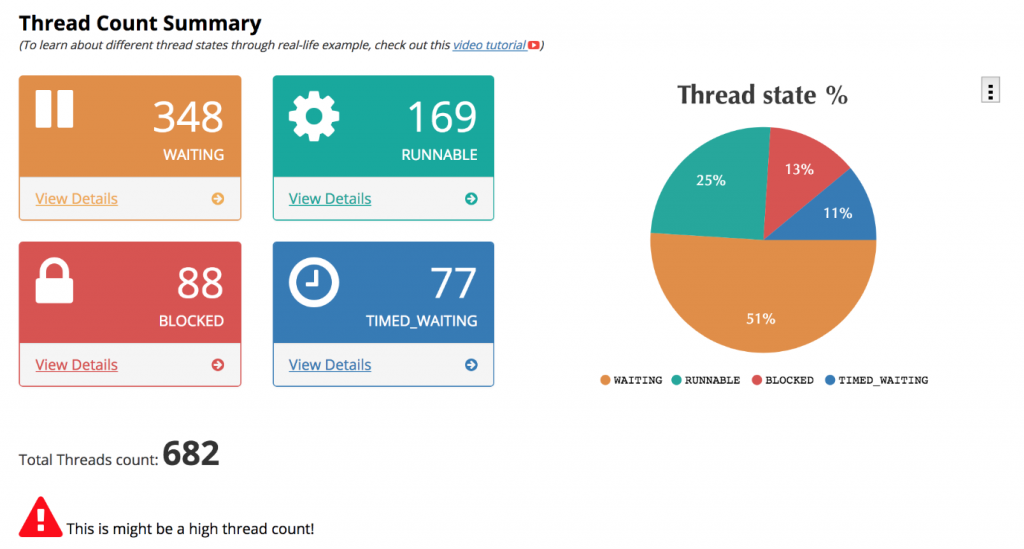
Thread profiling enables you to identify and isolate bottlenecks in your code stack. In Applications Manager’s APM Insight, all thread profiles collected in the chosen time window are listed, along with the thread count, CPU time and memory details. Each thread profile consists of a list of threads that were running when the application was being profiled.
Upon clicking a specific thread profile, one can view:
- High CPU consuming threads,along with its thread ID, CPU time and memory allocated details
- Time consuming methods which could potentially affect application’s performance
- Invocation count of every method
Introduction to Continuous Profiling
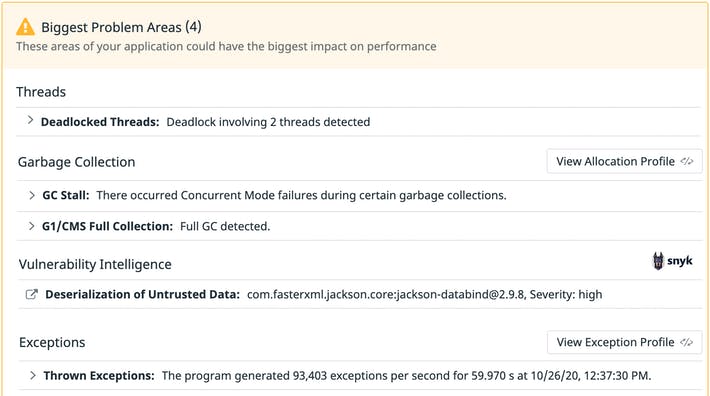
More often than not, developers need to investigate performance bottlenecks in their production applications and attempt to identify the root cause of the issue. To do this, they need actionable insights, which they typically start collecting via logs and code instrumentations. Unfortunately, this approach can be time-consuming and doesn’t provide good enough details about the underlying problems.
A modern and more advanced approach is to apply and use profiling techniques and tools that highlight the slowest application code, that is, the area consuming most of your resources, such as CPU and memory. Continuous profiling is the process of collecting application performance data in a production environment and making that data available to developers for deeper analysis.
Benefits of Continuous Profiling
Profiles provide great benefits by helping developers solve performance problems in an automatic and relatively cheap way via profiling reports that offer up valuable information about an application’s behavior in production. This data allows developers to analyze and get a better understanding of areas of code that are hot spots, which they can then start optimizing to resolve issues, reduce costs, enhance the user experience, and improve scalability.
Most profilers support different types of profiling data, namely:
- CPU time: time spent running on the CPU
- CPU percentage- percentage of CPU consumed
- Memory allocation: amount of allocated memory
- Wall time: time spent to finish a certain flow or task
In summary, code profilers give you an automated approach to highlight the root causes of performance problems and provide actionable insights for fixing them.

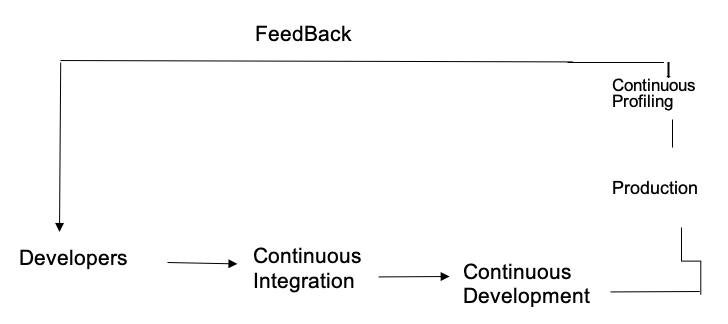
Continuous Profiling Techniques
Profiling has to be an ongoing and iterative process to gain performance wins; furthermore, you should focus your profiling efforts in the production environment where performance issues are found, as in most cases, optimization of local or development environments does not help resolve them.
Types of Profilers
The code profilers available are mainly categorized under two types: sampling and instrumenting profilers.
Sampling Profilers
Sampling profilers, also known as statistical profilers, work by approximating the “time spent” distribution in an application by collecting different time-point samples. Typically, a profiling agent periodically polls the profiled application by recording the current call stack; this determines the routine being executed and collects CPU utilization, memory usage, and latency data.
Instrumenting Profilers
Instrumenting profilers work by updating the application code and injecting calls into functions that will calculate how many times a procedure was called and how much time was spent inside a function. The overhead associated with this performance analysis is often high because of having to insert instrumentation directly into the profiled application code.

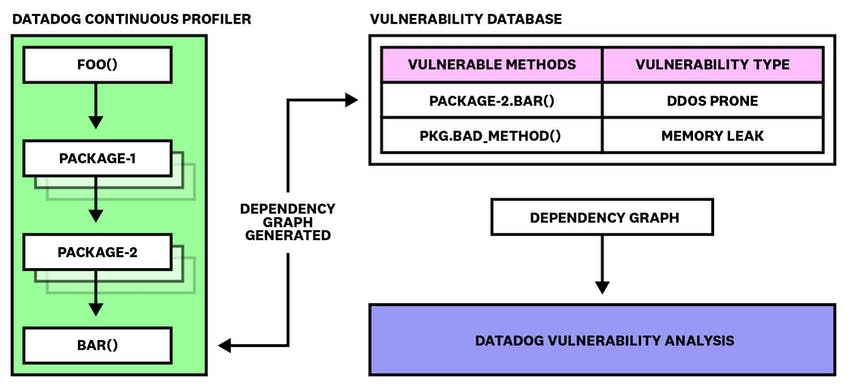
Advantage of Continuous Profiler & Thread Profiling
- Pinpoint hard to replicate production issues caused by inefficient code
- Continuously profile each line of code in any environment without affecting application performance and user experience
- Identify methods that are inefficient under production load, despite having performed well in pre-production environments
- Optimize resource consumption and save on compute costs with code profiling aggregations across hosts, services, and versions
Create thread dumps that help analyze slow responses
Inspect Slow Responses
Thread Profiler creates a thread dump of a slow thread with the configured frequency and log limit, so you can check the thread’s stack in a given timeframe, and find the root cause.
Log Slow Threads
The slow thread log messages will be logged in the “atlassian-jira.log” file by default.
Here is our list of the four best continuous profilers:
- Datadog Continuous Profiler – This tool is part of a more comprehensive platform of system monitoring tools and is offered in a package with an application performance monitor.
- Granulate gProfiler – This is a standalone tool available in versions for Google Cloud Platform, Azure, AWS, and on-premises servers.
- Amazon CodeGuru – This online service is offered in versions for developers and live applications running on the AWS platform.
- Google Cloud Profiler – This service from Google is aimed at developers and can analyze code on other cloud platforms, not just Google. It can also examine code performance on your servers.
I’m Rajesh Kumar, a DevOps, SRE, DevSecOps, Cloud, and Platform Engineering expert passionate about sharing practical knowledge, real-world experiences, and industry best practices. I have worked at Cotocus and regularly write about technology, travel, investing, health, product reviews, and digital marketing through my various platforms.
I publish technical articles at DevOps School, travel stories at Holiday Landmark, stock market insights at Stocks Mantra, health and fitness guidance at My Medic Plus, product reviews at TrueReviewNow, and SEO and digital marketing strategies at Wizbrand.
Find Trusted Cardiac Hospitals
Compare heart hospitals by city and services — all in one place.
Explore Hospitals