What is Datadog?
Datadog is a cloud-based monitoring and analytics platform that provides full-stack observability for dynamic and cloud-native environments. It allows organizations to collect, correlate, and visualize data from various sources, providing insights into the performance, availability, and health of applications, infrastructure, and networks.
Top 10 use cases of Datadog?
Here are ten common use cases for Datadog:
- Application Performance Monitoring (APM):
- Monitor the performance of applications in real-time.
- Identify and diagnose performance bottlenecks, errors, and latency issues.
- Infrastructure Monitoring:
- Collect and visualize metrics related to the health and performance of infrastructure components.
- Monitor servers, containers, virtual machines, and other infrastructure elements.
- Log Management:
- Aggregate, search, and analyze logs from various sources in a centralized platform.
- Correlate logs with performance metrics for efficient troubleshooting.
- Network Monitoring:
- Monitor network performance and track the flow of traffic between different components.
- Identify network issues, latency, and potential bottlenecks.
- Cloud Monitoring:
- Monitor and optimize the performance of cloud services and resources.
- Support for major cloud providers such as AWS, Azure, and Google Cloud Platform.
- Security Monitoring and Threat Detection:
- Detect and respond to security threats by monitoring abnormal behavior and identifying potential security incidents.
- Integrate with security information and event management (SIEM) solutions.
- User Experience Monitoring:
- Monitor user interactions with applications to understand user experience.
- Identify and resolve issues affecting user satisfaction and engagement.
- Incident Response and Alerting:
- Set up customizable alerts based on predefined thresholds and conditions.
- Automate incident response workflows and collaborate on issue resolution.
- DevOps and CI/CD Integration:
- Integrate Datadog with CI/CD pipelines to monitor the impact of code changes on performance and reliability.
- Support for popular CI/CD tools and platforms.
- Business Analytics and Dashboards:
- Create custom dashboards and reports to visualize key performance indicators and business metrics.
- Publish insights with stakeholders and make data-driven decisions.
- Container Orchestration Monitoring:
- Monitor containerized environments, including orchestration platforms like Kubernetes and Docker.
- Gain visibility into container health, resource usage, and performance.
- Serverless Monitoring:
- Monitor and trace serverless functions to understand their performance and dependencies.
- Support for serverless platforms like AWS Lambda.
Datadog’s flexibility and integrations make it suitable for a wide range of use cases, from traditional IT environments to modern cloud-native architectures. It provides a unified platform for observability, allowing teams to gain comprehensive insights into their systems and applications.
What are the feature of Datadog?
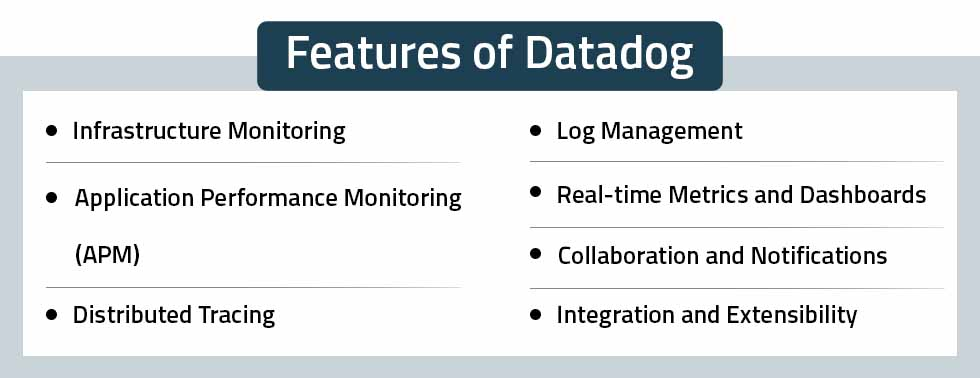
Datadog is a powerful monitoring and analytics platform that offers a comprehensive suite of features to help you visualize, troubleshoot, and optimize your IT infrastructure, applications, and services. Following are some of its key features:
1. Infrastructure Monitoring:
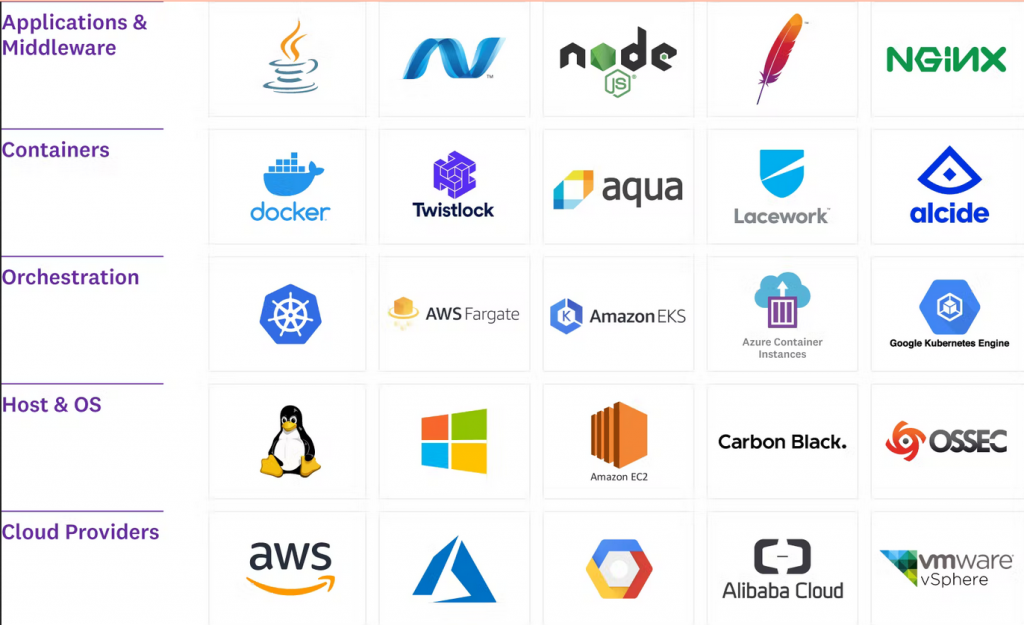
- Unified Visibility: Monitor servers, containers, databases, networks, cloud services, and more from a single platform.
- Real-Time Metrics: Track key performance indicators (CPU, memory, disk, network, etc.) in real time to identify bottlenecks and anomalies.
- Historical Data: Analyze historical trends and patterns to understand system behavior and make informed decisions.
- Infrastructure Mapping: Visualize your infrastructure topology and dependencies for faster troubleshooting and change impact analysis.
2. Application Performance Monitoring (APM):
- Distributed Tracing: Follow requests across distributed systems to pinpoint performance issues and troubleshoot errors.
- Code-Level Visibility: Drill down into code-level insights for Java, Python, Ruby, Go, and more to identify performance bottlenecks and errors.
- User Experience Monitoring: Track user interactions and measure page load times, error rates, and user satisfaction.
3. Log Management:
- Centralized Logging: Collect and aggregate logs from all your systems and applications for easy analysis and troubleshooting.
- Full-Text Search: Quickly search through logs to find specific events or patterns.
- Customizable Alerts: Set up alerts based on log patterns to identify critical issues proactively.
4. Network Performance Monitoring:
- Packet Analysis: Capture and analyze network traffic to identify latency, packet loss, and network errors.
- Network Topology Mapping: Visualize your network topology to understand traffic flows and dependencies.
- Security Analysis: Detect network anomalies and potential security threats.
5. Cloud Monitoring:
- Multi-Cloud Visibility: Monitor AWS, Azure, GCP, Kubernetes, and more in a unified platform.
- Cloud-Native Metrics: Track cloud-specific metrics like instance costs, resource utilization, and security posture.
6. Security Monitoring:
- Threat Detection: Detect potential threats and vulnerabilities in your infrastructure and applications.
- Compliance Monitoring: Track compliance with industry standards like PCI DSS, HIPAA, and SOC 2.
7. Collaboration and Alerting:
- Collaboration Tools: Share dashboards, troubleshoot issues together, and assign tasks to team members.
- Alerting and Notifications: Receive alerts via email, SMS, Slack, or PagerDuty to stay informed of critical issues.
8. Integrations:
- Integrates with hundreds of popular tools and services, including GitHub, Jira, Jenkins, Splunk, and more.
9. Customization:
- Create custom dashboards, metrics, and alerts to tailor Datadog to your specific needs.
How Datadog works and Architecture?
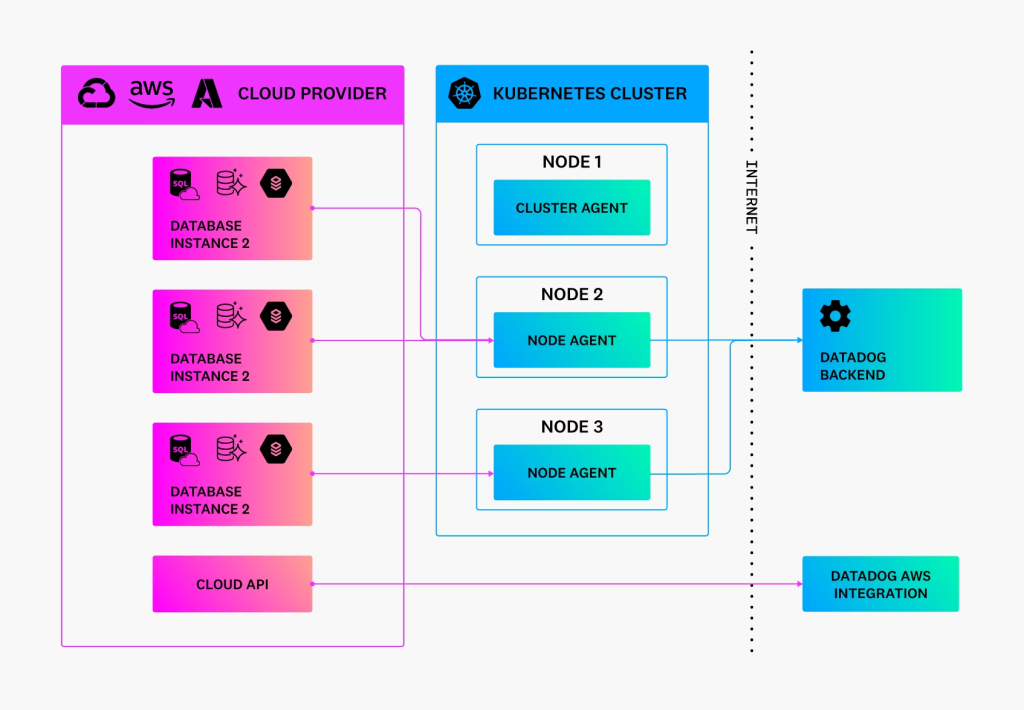
Datadog’s powerful monitoring capabilities stem from its robust architecture, designed to collect, analyze, and visualize data from your entire IT infrastructure. Here’s a breakdown of its key components:
1. Agents:
- Datadog Agents: Lightweight software installed on individual servers, containers, and databases to collect system metrics, logs, and application traces.
- Firehose: An optional component on Windows servers that forwards logs and event data to Datadog.
2. Data Collectors:
- Forwarders: Receive data from Agents and Firehose via HTTPS, buffer it, and send it to Datadog processing clusters.
- Intake: Processes incoming data, parses logs, analyzes traces, and aggregates metrics for efficient storage and analysis.
3. Storage and Processing:
- Distributed Database: Stores all metric, log, and trace data in a horizontally scalable, distributed database for reliable performance and high availability.
- Processing Engines: Analyze and aggregate data to create dashboards, charts, and other visualizations for real-time monitoring and historical analysis.
4. Web App and APIs:
- Web App: Provides a user interface for accessing dashboards, configuring alerts, and managing your Datadog account.
- APIs: Allow programmatic access to Datadog data and functionality for integration with other tools and automation workflows.
5. Alerting and Notifications:
- Alert Engine: Analyzes data based on user-defined rules and triggers alerts when thresholds are met or anomalies are detected.
- Notification System: Sends alerts via email, SMS, Slack, PagerDuty, and other integrations to keep users informed of critical issues.
Additional Points:
- Security: Datadog uses HTTPS encryption for all communication and offers role-based access control for secure access to data.
- Scalability: Datadog’s architecture is highly scalable and can handle data from small deployments to large enterprises.
- Customization: Datadog allows you to create custom dashboards, metrics, and alerts to tailor your monitoring experience to your specific needs.
By understanding how Datadog works, you can effectively utilize its features to gain deep insights into your IT infrastructure, optimize performance, troubleshoot issues, and ensure overall health and stability.
How to Install Datadog it?
Here’s a guide on how to install Datadog:
1. Create a Datadog Account:
- Visit Datadog official website and sign up for a free account.
- Once you’ve logged in, you’ll find your API key in the Integrations > Agents section. Copy this key, as you’ll need it for installation.
2. Choose Your Installation Method:
- Package Manager: Datadog provides packages for various operating systems, including Ubuntu, Debian, Red Hat, CentOS, Windows, and macOS.
- Docker: If you’re using Docker, you can install the Datadog Agent as a container.
- Kubernetes: For Kubernetes environments, Datadog offers Helm charts and Operator installation methods.
3. Follow the Official Instructions:
- Datadog provides detailed installation instructions for each method and operating system from their official website
- Select the appropriate guide for your environment and follow the steps carefully.
4. Key Steps for Most Installations:
- Download the installation script or package.
- Run the installation command, providing your API key.
- Verify the Agent’s status by running
sudo service datadog-agent status.
5. Additional Configuration (Optional):
- Customize Datadog Agent settings in the configuration file (
/etc/datadog-agent/datadog.yaml) to fit your specific needs. - Enable integrations: Integrate Datadog with various services and applications to collect additional data.
6. Start Monitoring:
- Once the Agent is installed and configured, it will start collecting and sending data to your Datadog account.
- Access your Datadog dashboard to view metrics, logs, and traces from your infrastructure and applications.
Basic Tutorials of Datadog: Getting Started

Datadog is a powerful monitoring and observability platform that helps you keep your infrastructure, applications, and services running smoothly. This guide will walk you through the basic steps of getting started with Datadog, from setting up an account to exploring your data.
1. Create a Free Datadog Account:
Head over to the Datadog official site and click “Get Started Free.” Enter your email address and set a password to create your account.
2. Install the Datadog Agent:
The Datadog Agent is a lightweight program that collects data from your systems and sends it to the Datadog platform. Choose your operating system from the list and follow the provided instructions. Most installations involve downloading a package, running a command with your API key (found in your Datadog settings), and verifying the Agent is running.
3. Add Hosts and Tags:
In the Datadog UI, navigate to Infrastructure > Hosts. You’ll see the host where you installed the Agent listed. You can add more hosts manually or configure automatic discovery. Tags are helpful for organizing your data, so consider adding relevant tags to your hosts like environment, application, or team.
4. Explore Your Data:
Datadog automatically collects a variety of metrics from your systems. You can explore these metrics in the Dashboard section. Datadog provides pre-built dashboards for common applications and services, or you can create your own custom dashboards to visualize the data that matters most to you.
5. Set Up Alerts:
Alerts notify you when specific metrics exceed thresholds or fall outside normal ranges. This can help you catch problems early and prevent them from impacting your users. Go to Monitors > Create Monitor to set up alerts for your most critical metrics.
6. Further Exploration:
Datadog offers many other features beyond the basics, including:
- Log Management: Centralize and analyze your logs for deeper insights into your applications.
- Application Performance Monitoring (APM): Monitor the performance of your applications at the code level.
- Synthetic Monitoring: Simulate user interactions to proactively identify performance issues.
- Security Monitoring: Detect and respond to security threats in your infrastructure.
Note: This is just a basic introduction to Datadog. As you get more comfortable with the platform, you can explore its full potential and tailor it to your specific needs.
Happy monitoring!

Find Trusted Cardiac Hospitals
Compare heart hospitals by city and services — all in one place.
Explore Hospitals