What is Dynatrace?
Dynatrace is an observability platform that provides full-stack monitoring and AIOps capabilities. It is designed to automatically discover and monitor dynamic, cloud-native environments, providing insights into the performance, availability, and user experience of applications and infrastructure.
Top 10 use cases of Dynatrace?
Here are ten common use cases for Dynatrace:
- Application Performance Monitoring (APM):
- Monitor and optimize the performance of applications in real-time.
- Trace transactions, identify bottlenecks, and analyze code-level details.
- End-User Monitoring (EUM):
- Gain visibility into the user experience by monitoring real user interactions with applications.
- Capture user behavior, performance, and engagement metrics.
- Infrastructure Monitoring:
- Monitor the health and performance of servers, virtual machines, and containers.
- Track CPU usage, memory utilization, disk I/O, and network metrics.
- Cloud Monitoring:
- Monitor cloud-based infrastructure and services across multiple cloud providers.
- Gain insights into the performance and availability of cloud resources.
- Microservices and Container Monitoring:
- Monitor microservices-based architectures and containerized applications.
- Automatically discover and trace the dependencies between microservices.
- AI-Powered Root Cause Analysis:
- Utilize artificial intelligence (AI) for automated root cause analysis.
- Identify and prioritize issues affecting application and infrastructure performance.
- Automated Performance Testing:
- Integrate Dynatrace into the continuous integration and continuous delivery (CI/CD) pipeline for automated performance testing.
- Assess the impact of code changes on application performance.
- Digital Experience Monitoring:
- Monitor and analyze the digital experience of users across different devices and browsers.
- Detect and resolve issues impacting user satisfaction.
- Log Monitoring and Analytics:
- Collect and analyze log data for troubleshooting and diagnostics.
- Correlate log entries with performance metrics for comprehensive analysis.
- Synthetic Monitoring:
- Simulate user interactions with applications using synthetic monitoring.
- Test application availability, performance, and functionality from different geographic locations.
- Application Security Monitoring:
- Integrate with security tools to monitor applications for security vulnerabilities and anomalies.
- Detect and respond to security incidents affecting application performance.
- Capacity Planning:
- Analyze historical data and trends for capacity planning and optimization.
- Ensure that infrastructure resources are provisioned appropriately to handle demand.
- Business Analytics and Dashboards:
- Create custom dashboards and reports to visualize key business metrics and performance indicators.
- Share insights with stakeholders to support data-driven decision-making.
- Alerting and Notification:
- Set up alerts based on predefined thresholds and conditions.
- Receive real-time notifications for performance issues and anomalies.
Dynatrace’s AI-driven observability platform provides a holistic view of the entire application stack, from the user experience to the underlying infrastructure. Its automated features enable organizations to detect and respond to issues proactively, ensuring optimal performance and user satisfaction.
What are the feature of Dynatrace?
Dynatrace boasts a robust feature set designed to provide deep, automated, and AI-powered observability across your entire IT ecosystem. Here are some key highlights:
Full-Stack Observability:
- Application Monitoring: Gain real-time insights into application performance, including code-level details, transactions, and user experience.
- Infrastructure Monitoring: Monitor servers, containers, networks, and cloud resources for health, performance, and resource utilization.
- Log Management: Ingest and analyze logs from any source to identify anomalies, errors, and security threats.
- Digital Experience Monitoring (DEM): Track real user experience (RUM) metrics and gain insights into user journeys across your applications.
AI-powered Automation and Insights:
- Davis AI: Analyzes your data proactively to identify anomalies, predict potential issues, and recommend actionable solutions.
- Automated Root Cause Analysis: Quickly pinpoint the source of performance problems without manual investigation.
- Baselining and Anomaly Detection: Automatically establish performance baselines and detect deviations that could impact users.
- Smart Alerts and Notifications: Receive intelligent alerts based on context and potential impact, reducing noise and false positives.
Unified Data Platform and Scalability:
- OneAgent: Single, unified agent simplifies deployment and data collection across all your systems.
- Unified Data Platform: Analyze all your data, including metrics, traces, logs, and events, in one central location.
- Horizontal Scalability: Dynatrace scales effortlessly to handle massive data volumes and complex environments.
- Open APIs and Integrations: Integrate Dynatrace with your existing tools and workflows for seamless data exchange.
Additional Features:
- Security Monitoring: Detect and investigate potential security threats across your systems.
- Cloud-native Observability: Gain deep insights into applications running in the cloud.
- DevOps Collaboration: Foster better collaboration between development and operations teams with shared visibility and insights.
- Cost Optimization: Monitor resource utilization and identify opportunities for cost savings.
These features make Dynatrace a powerful tool for:
- Improving application performance and user experience.
- Identifying and resolving issues quickly and efficiently.
- Making data-driven decisions for continuous improvement.
- Optimizing resource utilization and costs.
- Providing a unified view of your entire IT ecosystem.
How Dynatrace works and Architecture?
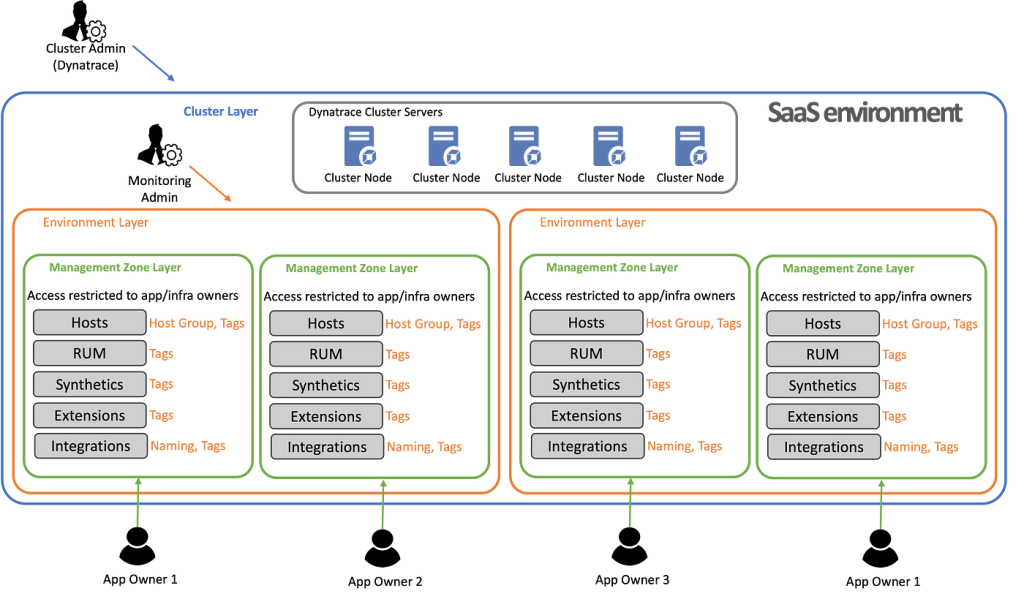
Dynatrace’s power lies in its unique and intelligent architecture built for real-time observability and proactive automation. Here’s a breakdown of the key components:
Data Ingestion:
- OneAgent: A single, unified agent deployed across your infrastructure collects data from all your systems, including applications, servers, containers, networks, and databases.
- Data Transfer: OneAgent transmits data in real-time to regional Collector instances closest to the source.
- Pre-processing and Enrichment: Collectors process and enrich data with timestamps, context, and AI-powered analysis.
Data Analysis and Insights:
- Distributed Data Grid: Processed data is distributed across a global network of geographically dispersed nodes for scalability and redundancy.
- Davis AI Engine: This powerful AI engine analyzes data in real-time, identifying anomalies, predicting potential issues, and providing actionable insights.
- Query Engine: Users can submit queries using Dynatrace’s intuitive query language to access specific data insights.
- Visualization and Alerts: Real-time dashboards and alerts display key metrics, anomalies, and actionable recommendations for users.
Key Architectural Highlights:
- OneAgent: Simplifies deployment and data collection with a single agent for all your systems.
- Distributed Data Grid: Ensures high availability and scalability to handle massive data volumes.
- Real-time Data Analysis: Provides instant insights into your system’s health and performance.
- Davis AI Engine: Proactively identifies issues, predicts problems, and offers intelligent solutions.
Additional Layers:
- Baselining and Anomaly Detection: Establishes performance baselines for each system and automatically detects deviations.
- Automated Root Cause Analysis: Pinpoints the exact source of performance issues and potential threats.
- Open APIs and Integrations: Connects Dynatrace with your existing tools and workflows for seamless data exchange.
Benefits of this architecture:
- Highly scalable: Handles massive data volumes with minimal performance degradation.
- Real-time insights: Provides instant visibility into your system’s health and performance.
- Proactive automation: Reduces manual effort by automatically identifying and resolving issues.
- Cost-effective: Efficient data storage and analysis optimizes resource utilization.
How to Install Dynatrace it?
Installing Dynatrace can be a fairly straightforward process, thanks to its unified OneAgent approach. Here’s a general outline of the steps involved:
1. Choose your deployment method:
- Cloud Deployments: If you use AWS, Azure, or GCP, Dynatrace offers simplified cloud-specific deployment processes. Simply follow the dedicated guides for your preferred cloud platform.
- On-Premise Deployments: For on-premise environments, you’ll need to download the OneAgent installer and manually configure it for your infrastructure.
2. Install the OneAgent:
- Download the appropriate OneAgent installer for your OS and hardware platform.
- Run the installer on your target server or container.
- Provide your Dynatrace license key and configure basic settings if prompted.
- The OneAgent will automatically start collecting data and sending it to Dynatrace.
3. Verify Installation:
- Log in to the Dynatrace web interface.
- Check the “Monitored Entities” section to ensure your systems are showing up.
- Explore dashboards and metrics to confirm data is flowing.
Tips:
- Before installation, ensure your target systems meet the system requirements for the OneAgent.
- If you’re using firewalls or security policies, configure them to allow communication with Dynatrace servers.
Always remember, the specific installation steps may vary depending on your environment and desired configuration. If you encounter any difficulties, don’t hesitate to consult the resources above or reach out to Dynatrace support for assistance.
Basic Tutorials of Dynatrace: Getting Started
Welcome to the captivating world of Dynatrace! Ready to unlock its potential for comprehensive monitoring and analysis of your IT environment? Let’s explore some basic tutorials to guide you through your initial steps:
1. Setting Up Your Account:
- Head to dynatrace official website and create a free trial account.
- You’ll receive an activation key and download links for the OneAgent.
2. Deploying OneAgent:
- Choose the appropriate OneAgent platform (e.g., Windows, Linux, container) based on your system.
- Download and install the OneAgent on your servers or containers hosting the applications and infrastructure you want to monitor.
- Use the activation key during installation to connect the OneAgent to your Dynatrace environment.
3. Exploring Dashboards:
- Once data starts flowing, navigate to the Dashboards section in Dynatrace.
- Pre-built dashboards offer instant insights into key performance metrics like response times, errors, resource utilization, and application health.
- Explore specific dashboards for your chosen technologies (e.g., Java, Kubernetes) for deeper analysis.
4. Drilling Down with Code Level Visibility:
- Dynatrace shines with its deep code-level insights.
- Click on applications or services in the dashboards to navigate to code-level details, including transaction traces and code hotspots.
- Identify performance bottlenecks at the function level and pinpoint areas for optimization.
5. Proactive with Problem Detection:
- Dynatrace’s AI-powered problem detection automatically identifies anomalies and potential issues.
- The Problems section presents a consolidated view of detected issues, along with root cause analysis and suggested solutions.
- Address problems proactively before they impact users and maintain optimal performance.
6. Customizing Monitoring and Alerts:
- Dynatrace allows you to tailor dashboards, metrics, and alerts to your specific needs.
- Create custom dashboards focused on your crucial metrics and workflows.
- Define custom alerts based on thresholds for critical metrics to receive timely notifications about potential problems.
7. Expanding Your Observability:
- Dynatrace integrates with various tools and services to provide a holistic view of your IT landscape.
- Explore and utilize these integrations to monitor databases, networks, cloud platforms, and other critical components.
- Build a comprehensive observability strategy for complete visibility into your entire IT ecosystem.
Note:
- Start small by monitoring a single application or service initially.
- Focus on understanding key metrics and identifying performance bottlenecks.
- Join the active Dynatrace community to learn from other users and get expert advice.
Bonus Tutorial: Try the Dynatrace University Tutorials:
- Dynatrace offers a wealth of online tutorials categorized by technology and use case.
- Find beginner-friendly tutorials tailored to your specific environment and learning goals.
- Take a structured learning path to master Dynatrace’s capabilities and unlock its full potential for optimal performance monitoring.
By following these step-by-step tutorials and embracing the power of Dynatrace, you’ll be well on your way to achieving comprehensive monitoring, proactive problem detection, and insightful performance analysis for your entire IT infrastructure. Let Dynatrace guide you towards a smoother, more efficient, and user-centric IT environment!

Find Trusted Cardiac Hospitals
Compare heart hospitals by city and services — all in one place.
Explore Hospitals