What is Elastic Security?
Elastic Security is a comprehensive security information and event management (SIEM) solution offered by Elastic, the company behind the Elasticsearch, Kibana, Beats, and Logstash (ELK) stack. Elastic Security is designed to help organizations detect, investigate, and respond to security threats and incidents.
Elastic Security is known for its flexibility, scalability, and ease of use, making it suitable for organizations of various sizes and industries. It leverages the Elasticsearch-based data analytics platform to provide powerful search and analysis capabilities, allowing security teams to gain deep insights into their security data and respond effectively to security incidents.
Top 10 use cases of Elastic Security:
Here are the top 10 use cases of Elastic Security:
- Threat Detection and Monitoring: Elastic Security continuously monitors network traffic, system logs, and other data sources to detect suspicious activities and security threats in real-time.
- Incident Response: Security teams can use Elastic Security to quickly investigate and respond to security incidents, including breaches, malware outbreaks, and unauthorized access.
- Security Event Correlation: Elastic Security correlates security events and logs from multiple sources to identify complex attack patterns and prioritize alerts based on their potential impact.
- User and Entity Behavior Analytics (UEBA): Elastic Security employs UEBA to analyze user and entity behavior, helping detect insider threats, compromised accounts, and abnormal activities.
- Log Management and Retention: Elastic Security collects, stores, and centralizes log data from various sources, providing organizations with a comprehensive log management solution for compliance, auditing, and forensic analysis.
- Vulnerability Assessment Integration: By integrating with vulnerability assessment tools, Elastic Security can prioritize and analyze security vulnerabilities based on their potential risk to the organization.
- Threat Intelligence Integration: Elastic Security can ingest threat intelligence feeds and indicators of compromise (IoCs) to enhance its threat detection capabilities.
- Compliance and Reporting: Elastic Security provides reporting and dashboard features to assist organizations in meeting compliance requirements by demonstrating adherence to security policies and regulations.
- Custom Dashboards and Visualizations: Security teams can create custom dashboards and visualizations to gain insights into security events and trends within their organization.
- Integration with Elastic Stack: Elastic Security seamlessly integrates with other components of the Elastic Stack, such as Elasticsearch, Kibana, Beats, and Logstash, allowing organizations to leverage the full power of the stack for security analytics and monitoring.
- Cloud Security Monitoring: Elastic Security extends its capabilities to cloud environments, enabling organizations to monitor security events and activities in cloud services and platforms.
- Endpoint Security: Elastic Security can be used to monitor and secure endpoints, detect malicious activities on individual devices, and respond to endpoint-based threats.
What are the feature of Elastic Security?
Elastic Security, formerly known as the Elastic SIEM, is a security information and event management (SIEM) solution offered by Elastic. It is designed to provide comprehensive security monitoring, threat detection, and incident response capabilities. Here are the key features of Elastic Security, along with an overview of how it works and its architecture:
Key Features of Elastic Security:
- Data Ingestion: Elastic Security can ingest data from various sources, including logs, network flows, and cloud platforms, allowing organizations to centralize security data.
- Real-Time Threat Detection: It continuously monitors data in real-time to detect and alert on security threats, using predefined rules, machine learning, and behavioral analysis.
- Threat Intelligence Integration: Elastic Security can ingest threat intelligence feeds and indicators of compromise (IoCs) to enhance its threat detection capabilities.
- Security Event Correlation: The solution correlates security events and logs from multiple sources to identify complex attack patterns and prioritize alerts based on severity.
- User and Entity Behavior Analytics (UEBA): Elastic Security employs UEBA to analyze user and entity behavior and detect anomalies that may indicate security threats.
- Incident Response: Security teams can use Elastic Security to investigate and respond to security incidents, leveraging built-in incident management and workflow capabilities.
- Log Management and Retention: It provides log management features, allowing organizations to collect, store, and retain log data for compliance, auditing, and forensic analysis.
- Custom Dashboards and Visualizations: Security teams can create custom dashboards and visualizations using Kibana, Elastic’s data visualization and exploration tool, to gain insights into security events.
- Elasticsearch-Based: Elastic Security leverages Elasticsearch, a powerful search and analytics engine, to store, search, and analyze security data efficiently.
- Integration with Elastic Stack: It seamlessly integrates with other components of the Elastic Stack, including Elasticsearch, Kibana, Beats, and Logstash, for comprehensive data analytics and visualization.
How Elastic Security works and Architecture?
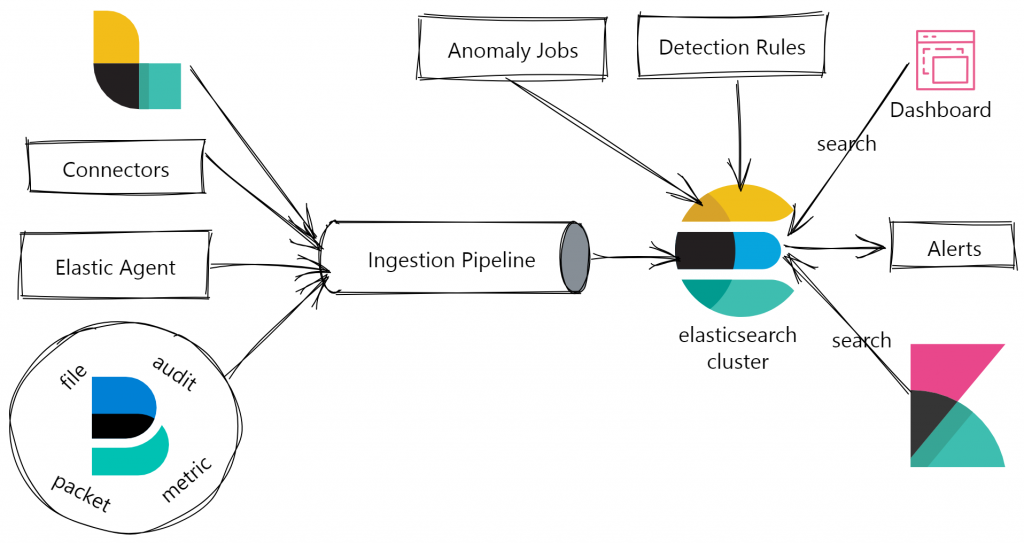
- Data Ingestion: Elastic Security collects data from various sources, such as logs, network flows, and cloud services, using data shippers like Beats or Logstash. The data is then indexed in Elasticsearch for efficient searching and analysis.
- Real-Time Analysis: As data is ingested, Elastic Security performs real-time analysis, applying predefined detection rules, machine learning algorithms, and behavioral analysis to identify security threats and anomalies.
- Alerting and Notification: When a potential security threat is detected, Elastic Security generates alerts and notifications for security analysts to investigate.
- Correlation and Prioritization: The solution correlates security events from multiple sources, helping security teams identify complex attack patterns and prioritize alerts based on the severity and potential impact of the threat.
- Investigation and Response: Security analysts use Elastic Security to investigate security incidents, including incident triage, timeline reconstruction, and evidence gathering. The solution offers built-in incident management and workflow capabilities to facilitate response and mitigation.
Elastic Security is built on top of the Elastic Stack, which consists of several components:
- Elasticsearch: Elasticsearch is used as the data store and search engine for security data. It provides scalable and efficient storage and retrieval of security events.
- Kibana: Kibana serves as the user interface for Elastic Security, offering data visualization, dashboards, and tools for exploring and analyzing security data.
- Beats: Beats are lightweight data shippers that collect data from various sources and send it to Elasticsearch. Different Beats modules are available for specific data types, such as Filebeat for logs and Metricbeat for metrics.
- Logstash: Logstash can be used for data transformation and enrichment before it is indexed in Elasticsearch, if needed.
- Machine Learning: Elastic Security leverages machine learning algorithms for advanced threat detection and anomaly detection.
- SIEM App: Elastic Security provides a SIEM app within Kibana, which offers a dedicated workspace for security operations, including alerts, incident management, and visualizations.
Elastic Security’s architecture is highly scalable and adaptable to the needs of organizations of varying sizes and industries. It is known for its flexibility and ease of use, making it a popular choice for security monitoring and threat detection.
How to Install Elastic Security?
To install Elastic Security, you can either deploy it in the cloud or on-premises.
Deploying Elastic Security in the cloud
To deploy Elastic Security in the cloud, you can use Elastic Cloud. Elastic Cloud is a managed service that provides a quick and easy way to deploy Elasticsearch and other Elastic Stack products.
To deploy Elastic Security in Elastic Cloud, follow these steps:
- Go to the Elastic Cloud website and create an account.
- Click the Deploy button and select the Elastic Security deployment template.
- Choose the deployment options that you want, such as the region and instance size.
- Click the Deploy button to start the deployment process.
Once the deployment process is complete, you will have a running Elastic Security cluster.
Deploying Elastic Security on-premises
To deploy Elastic Security on-premises, you will need to install Elasticsearch and Kibana. You can download the latest versions of Elasticsearch and Kibana from the Elastic website.
Once you have installed Elasticsearch and Kibana, you need to configure them to work with Elastic Security. To do this, you will need to edit the Elasticsearch configuration file and the Kibana configuration file.
For instructions on how to configure Elasticsearch and Kibana for Elastic Security, please refer to the Elastic Security documentation: https://www.elastic.co/guide/en/security/current/getting-started.html
Once you have configured Elasticsearch and Kibana, you need to start the Elasticsearch and Kibana services.
Once the Elasticsearch and Kibana services are running, you can access the Elastic Security UI in Kibana at http://localhost:5601.
Additional Steps
Once you have installed Elastic Security, you need to complete the following additional steps:
- Set up security for your Elasticsearch cluster.
- Ingest security data into Elasticsearch.
- Create detection rules.
Elastic Security is a powerful and comprehensive security solution that can help you to protect your environment from threats. By following the steps outlined above, you can install Elastic Security and start protecting your environment today.
Basic Tutorials of Elastic Security: Getting Started

The following steps are the Basic Tutorials of Elastic Security:
1. Set up security for your Elasticsearch cluster
To set up security for your Elasticsearch cluster, follow these steps:
- Open the Elasticsearch configuration file (elasticsearch.yml).
- Add the following settings to the file:
  xpack.security.enabled: true
Code language: CSS (css)- Save the Elasticsearch configuration file.
- Restart Elasticsearch.
2. Ingest security data into Elasticsearch
You can ingest security data into Elasticsearch from a variety of sources, such as endpoint agents, cloud security platforms, and log management systems.
To ingest security data from an endpoint agent, you can use the Elastic Agent. The Elastic Agent is a lightweight agent that can be installed on your endpoints to collect security data.
To ingest security data from a cloud security platform, you can use the Elastic Cloud Integrations. The Elastic Cloud Integrations provide a way to ingest security data from a variety of cloud security platforms, such as AWS Security Hub and Azure Sentinel.
To ingest security data from a log management system, you can use the Elastic Logstash pipeline. Logstash is a data collection and processing pipeline that can be used to ingest security data from a variety of sources.
Once you have ingested security data into Elasticsearch, you can start creating detection rules.
3. Create detection rules
Detection rules allow you to detect threats in your security data. You can create your own detection rules, or you can use pre-built rules from the Elastic Security library.
To create a detection rule, follow these steps:
- Open the Elastic Security UI in Kibana.
- Click the Detection rules tab.
- Click the Create rule button.
- Select a rule type.
- Configure the rule.
- Save the rule.
Once you have created a detection rule, it will start running immediately.
4. Monitor your security data
Once you have created detection rules, you can start monitoring your security data for threats. You can do this using the Elastic Security UI in Kibana.
The Elastic Security UI provides a variety of ways to monitor your security data, such as:
- Overview: The overview page provides a high-level overview of your security data, including the number of detections, the number of hosts, and the number of vulnerabilities.
- Detections: The detections page shows a list of all of the detections that have been triggered.
- Host list: The host list page shows a list of all of the hosts in your environment. You can use this page to view the security status of each host.
- Vulnerabilities: The vulnerabilities page shows a list of all of the vulnerabilities that have been detected in your environment.
You can also use the Elastic Security UI to create custom dashboards to monitor your security data.
5. Respond to threats
If you detect a threat, you can use Elastic Security to respond to it quickly and effectively. Elastic Security provides a variety of response capabilities, such as:
- Isolating infected endpoints: You can use Elastic Security to isolate infected endpoints from your network.
- Blocking malicious traffic: You can use Elastic Security to block malicious traffic from entering your network.
- Running a playbook: You can use Elastic Security to run a playbook to respond to a threat. A playbook is a series of steps that you can use to automate your response to a threat.
By following the steps outlined above, you can get started with Elastic Security and start protecting your environment from threats.

👤 About the Author
Ashwani is passionate about DevOps, DevSecOps, SRE, MLOps, and AiOps, with a strong drive to simplify and scale modern IT operations. Through continuous learning and sharing, Ashwani helps organizations and engineers adopt best practices for automation, security, reliability, and AI-driven operations.
🌐 Connect & Follow:
- Website: WizBrand.com
- Facebook: facebook.com/DevOpsSchool
- X (Twitter): x.com/DevOpsSchools
- LinkedIn: linkedin.com/company/devopsschool
- YouTube: youtube.com/@TheDevOpsSchool
- Instagram: instagram.com/devopsschool
- Quora: devopsschool.quora.com
- Email– contact@devopsschool.com
Find Trusted Cardiac Hospitals
Compare heart hospitals by city and services — all in one place.
Explore Hospitals