What is ELK Stack?
The ELK Stack, also known as the Elasticsearch, Logstash, and Kibana Stack, is a powerful set of open-source tools used for log and data analytics. Each component of the stack plays a specific role in managing, processing, and visualizing data.
The ELK Stack’s flexibility and extensibility make it a valuable tool for a wide range of use cases, from IT operations and security to application development and business intelligence. Its ability to process and visualize data from diverse sources makes it popular for organizations looking to gain insights from log and event data.
Top 10 use cases of ELK Stack:
Here are the top 10 use cases of the ELK Stack:
- Log Management: ELK Stack is commonly used for centralized log management, allowing organizations to collect, store, and analyze logs from various systems, applications, and devices.
- Monitoring and Alerting: ELK Stack can be used for real-time monitoring of systems and applications. It helps organizations set up alerts based on specific conditions or thresholds and receive notifications when issues arise.
- Security Information and Event Management (SIEM): ELK Stack can function as a SIEM solution by collecting and analyzing security-related data from multiple sources. It helps in detecting and responding to security incidents and threats.
- Application Performance Monitoring (APM): Organizations use ELK Stack for monitoring the performance of applications, identifying bottlenecks, and troubleshooting issues that impact user experience.
- Infrastructure Monitoring: ELK Stack helps in monitoring the health and performance of infrastructure components such as servers, databases, and network devices. It provides insights into resource utilization and system availability.
- DevOps and Continuous Integration/Continuous Deployment (CI/CD): ELK Stack supports DevOps practices by providing visibility into the development and deployment process. It helps teams identify issues early in the pipeline and streamline releases.
- IoT Data Analytics: ELK Stack can ingest and analyze data generated by Internet of Things (IoT) devices, sensors, and connected systems. It enables organizations to gain insights from IoT data.
- Business Intelligence and Reporting: ELK Stack can be used for business intelligence and reporting by analyzing data to generate insights and visualizations that aid decision-making.
- Capacity Planning and Resource Optimization: Organizations use ELK Stack to analyze historical data and trends to make informed decisions about resource allocation and capacity planning.
- User Behavior Analysis: ELK Stack can monitor user behavior and provide insights into how users interact with applications and systems. This information can be used for improving user experiences and detecting unusual or suspicious behavior.
- Log File Analysis: ELK Stack is ideal for parsing and analyzing log files generated by web servers, applications, and databases. It helps in identifying issues, optimizing performance, and troubleshooting errors.
- Geospatial Data Analysis: With Elasticsearch’s geospatial capabilities, ELK Stack can be used for location-based data analysis and visualization, such as mapping and geospatial analytics.
- Compliance and Audit: ELK Stack assists organizations in meeting compliance requirements by providing the ability to collect, retain, and report on logs and events necessary for audits.
- Content Management and Search: ELK Stack can be used for building content management systems and search engines, enabling fast and efficient searching and retrieval of content and documents.
- Container Orchestration: ELK Stack can be used in containerized environments to monitor and analyze the performance and behavior of containerized applications and services.
The ELK Stack’s flexibility and extensibility make it a valuable tool for a wide range of use cases, from IT operations and security to application development and business intelligence. Its ability to process and visualize data from diverse sources makes it popular for organizations looking to gain insights from log and event data.
What are the feature of ELK Stack?
The ELK Stack, consisting of Elasticsearch, Logstash, and Kibana, is a powerful open-source platform for log and data analytics. Each component of the stack plays a specific role in managing, processing, and visualizing data. Here are the key features of each component and an overview of how the ELK Stack works:
Elasticsearch:
- Full-Text Search: Elasticsearch is known for its full-text search capabilities, making it efficient for searching and retrieving textual data.
- Distributed and Scalable: It is designed to be distributed and horizontally scalable, allowing organizations to handle large volumes of data across multiple nodes.
- Near Real-Time Search: Elasticsearch provides near real-time search capabilities, ensuring that newly ingested data becomes searchable almost immediately.
- Schema-Free: It is schema-free, meaning you can index and search unstructured and semi-structured data without the need for a fixed schema.
- Powerful Query Language: Elasticsearch uses a powerful query language called Elasticsearch Query DSL for complex queries and aggregations.
Logstash:
- Data Ingestion: Logstash is used for data collection and transformation. It supports a wide range of input sources and can normalize and enrich data as it passes through.
- Data Transformation: It can filter, parse, and transform data to fit a common format, making it easier to analyze and visualize.
- Pipeline Processing: Logstash uses pipeline processing to allow for multiple stages of data transformation and enrichment.
- Extensible: Logstash is highly extensible, and users can create custom plugins to support unique data sources or processing requirements.
Kibana:
- Data Visualization: Kibana provides a web-based interface for creating interactive data visualizations, including charts, graphs, and maps.
- Dashboard Creation: Users can create custom dashboards that combine multiple visualizations to monitor and analyze data in real-time.
- Search and Exploration: Kibana allows users to search, explore, and drill down into data using its search and query capabilities.
- User Authentication and Authorization: It provides user authentication and role-based access control to ensure that only authorized users can access and interact with the data.
How ELK Stack works and Architecture?
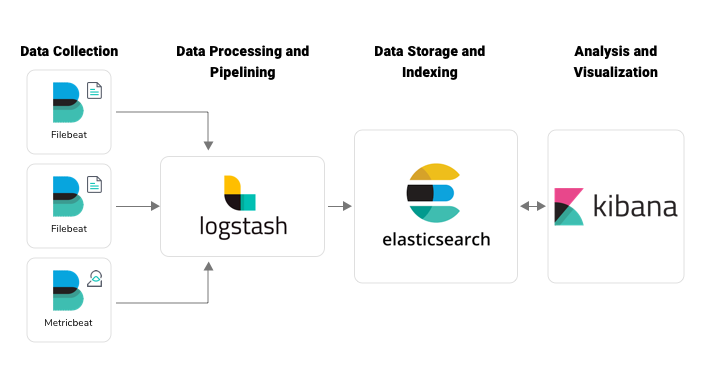
- Data Ingestion: Logstash, the data collection and transformation component, ingests data from various sources. Data can come from log files, metrics, APIs, databases, and other systems.
- Data Transformation: Logstash processes the data, parsing, filtering, and enriching it as needed. This transformation ensures that the data is in a consistent and usable format.
- Data Indexing: The processed data is sent to Elasticsearch, where it is indexed, making it searchable and efficient to query.
- Data Visualization: Kibana connects to Elasticsearch to visualize the indexed data. Users can create dashboards, visualizations, and perform ad-hoc searches to gain insights.
- User Interaction: Users interact with Kibana through a web-based interface, exploring data, creating visualizations, and setting up alerts.
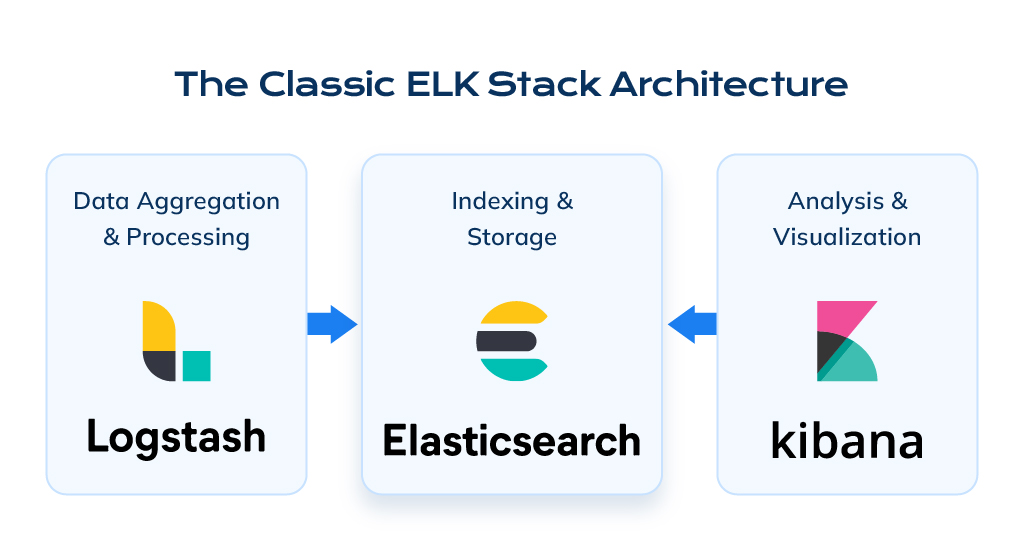
ELK Stack Architecture:
The ELK Stack’s architecture typically consists of the following components:
- Data Sources: These are systems, applications, and devices that generate log or data files.
- Logstash Agents: Logstash agents, often deployed on data source systems, collect and forward data to the central Logstash server.
- Logstash Server: The central Logstash server processes data from agents. It can include multiple processing pipelines.
- Elasticsearch Nodes: Elasticsearch nodes store and index the processed data. Elasticsearch clusters can consist of multiple nodes for scalability and fault tolerance.
- Kibana: Kibana provides the user interface for data visualization, exploration, and interaction.
- Additional Components: Organizations may add additional components for advanced use cases, such as Beats for lightweight data shippers or advanced data processing components.
The ELK Stack’s architecture is designed to be scalable and fault-tolerant, making it suitable for organizations of varying sizes and data volumes. It offers flexibility in deployment configurations to meet specific requirements, whether for small-scale deployments or large enterprise environments.
How to Install ELK Stack?
To install the ELK stack, you will need to install the following components:
- Elasticsearch
- Logstash
- Kibana
You can install the ELK stack on a variety of platforms, including Linux, macOS, and Windows.
To install the ELK stack on Linux:
- Download the latest version of Elasticsearch from the Elasticsearch website.
- Extract the Elasticsearch installation package to a directory on your server.
- Open a terminal window and navigate to the directory where you extracted the Elasticsearch installation package.
- Run the following command to start the Elasticsearch installation process:
./elasticsearch-setup-linux-x86_64- Follow the on-screen instructions to complete the installation process.
- Download the latest version of Logstash from the Logstash website.
- Extract the Logstash installation package to a directory on your server.
- Open a terminal window and navigate to the directory where you extracted the Logstash installation package.
- Run the following command to start the Logstash installation process:
./logstash-installer- Follow the on-screen instructions to complete the installation process.
- Download the latest version of Kibana from the Kibana website.
- Extract the Kibana installation package to a directory on your server.
- Open a terminal window and navigate to the directory where you extracted the Kibana installation package.
- Run the following command to start the Kibana installation process:
./kibana-installer- Follow the on-screen instructions to complete the installation process.
Once the ELK stack is installed, you can start using it to collect, analyze, and visualize your logs.
Some additional tips for installing the ELK stack:
- Make sure that your server has the required system requirements.
- If you are installing the ELK stack in a production environment, it is recommended to follow the ELK stack hardening guide to secure your installation.
- You can also find a variety of tutorials and other resources on the Elasticsearch, Logstash, and Kibana websites.
The ELK stack is a powerful logging and analytics platform that can help you to improve your security posture by helping you to collect, analyze, and visualize your security data. By following the steps above, you can learn how to install the ELK stack on Linux and start using it to improve your security posture.
Basic Tutorials of ELK Stack: Getting Started

The following steps are the basic tutorial on how to use the ELK stack to improve your security posture:
1. Getting Started
- Install the ELK stack. You can install the ELK stack on a variety of platforms, including Linux, macOS, and Windows.
- Configure the ELK stack. Once the ELK stack is installed, you need to configure it to collect, analyze, and visualize your logs.
- Learn the basics of Elasticsearch. Elasticsearch is the search and analytics engine at the heart of the ELK stack. It is important to understand the basics of Elasticsearch in order to use the ELK stack effectively.
- Learn the basics of Logstash. Logstash is the pipeline that collects and processes logs in the ELK stack. It is important to understand the basics of Logstash in order to collect and process your logs effectively.
- Learn the basics of Kibana. Kibana is the visualization tool in the ELK stack. It is important to understand the basics of Kibana in order to visualize your logs effectively.
2. Collecting Logs
- Identify the logs that you want to collect. What sources are generating the logs that you want to collect?
- Configure Logstash to collect the logs. Logstash can collect logs from a variety of sources, including files, databases, and applications.
- Send the collected logs to Elasticsearch. Once Logstash has collected the logs, it needs to send them to Elasticsearch for storage and analysis.
3. Analyzing Logs
- Index the logs in Elasticsearch. Elasticsearch needs to index the logs before it can analyze them.
- Create Elasticsearch queries to analyze the logs. Elasticsearch provides a powerful query language that you can use to analyze your logs.
- Use Kibana to visualize the logs. Kibana provides a variety of visualization options that you can use to visualize your logs.
4. Using Logs to Improve Your Security Posture
- Use the ELK stack to identify security threats. You can use the ELK stack to identify security threats by analyzing your logs for suspicious activity.
- Use the ELK stack to investigate security incidents. You can use the ELK stack to investigate security incidents by analyzing the logs for information about the incident.
- Use the ELK stack to monitor your security posture. You can use the ELK stack to monitor your security posture by creating dashboards and alerts to notify you of potential security problems.
Some additional tips for using the ELK stack to improve your security posture:
- Use the ELK stack community to get help and support from other ELK stack users.
- Take advantage of the ELK stack documentation and training resources to learn more about the platform and how to use it effectively.
- Contact the ELK stack vendor support if you have any questions or problems.
The ELK stack is a powerful logging and analytics platform that can help you to improve your security posture by helping you to collect, analyze, and visualize your security data. By following the steps above, you can learn how to use the ELK stack to improve your security posture.

👤 About the Author
Ashwani is passionate about DevOps, DevSecOps, SRE, MLOps, and AiOps, with a strong drive to simplify and scale modern IT operations. Through continuous learning and sharing, Ashwani helps organizations and engineers adopt best practices for automation, security, reliability, and AI-driven operations.
🌐 Connect & Follow:
- Website: WizBrand.com
- Facebook: facebook.com/DevOpsSchool
- X (Twitter): x.com/DevOpsSchools
- LinkedIn: linkedin.com/company/devopsschool
- YouTube: youtube.com/@TheDevOpsSchool
- Instagram: instagram.com/devopsschool
- Quora: devopsschool.quora.com
- Email– contact@devopsschool.com
Find Trusted Cardiac Hospitals
Compare heart hospitals by city and services — all in one place.
Explore Hospitals