What is Excel?

Microsoft Excel is a spreadsheet program developed by Microsoft that is part of the Microsoft Office suite. Excel is widely used for creating, managing, and analyzing numerical data in a tabular format. It provides a grid of cells, each identified by a unique address formed by the combination of a letter and a number (e.g., A1, B2). Users can enter data into these cells, perform calculations, create charts, and organize information in a structured manner.
Key Features of Excel:
- Grid Structure: Excel organizes data into a grid structure of rows and columns, creating a worksheet. Several worksheets can be combined into a workbook.
- Cell-Based Data Entry: Users can input data, text, and formulas into individual cells. Every one cell can hold various types of data, including text, dates, numbers, and formulas.
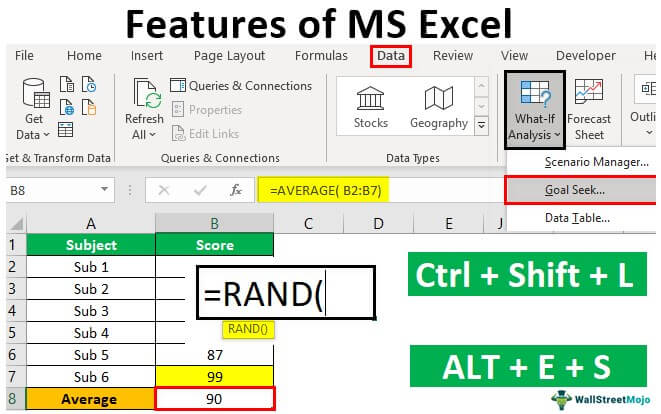
- Formulas and Functions: Excel supports a wide range of mathematical and logical formulas. Functions, such as SUM, AVERAGE, VLOOKUP, and IF, enable users to perform complex calculations on data.
- Data Analysis Tools: Excel includes tools for sorting, filtering, and analyzing data. PivotTables and PivotCharts allow users to summarize and visualize data dynamically.
- Charts and Graphs: Users can create a variety of charts and graphs to represent data visually. Excel supports bar charts, line charts, pie charts, and more.
- Data Validation: Excel allows users to set rules for data entry, ensuring that only valid data is inputted. This helps maintain consistency and data accuracy.
- Conditional Formatting: Users can apply formatting rules based on the content of cells. This includes highlighting cells that meet specific criteria or applying color scales.
- Data Import and Export: Excel can import data from external sources, including databases and text files. Users can also export data to various formats for sharing and analysis.
- Collaboration and Sharing: Excel workbooks can be shared and edited collaboratively. Multiple users can work on the same document simultaneously, and changes are tracked and merged.
- Automation with Macros: Users can automate repetitive tasks by recording and running macros. Macros are sequences of actions that can be executed with a single click.
What is top use cases of Excel?
- Financial Analysis:
- Budgeting and forecasting.
- Financial modeling.
- Expense tracking.
- Business Planning:
- Business plans and projections.
- Sales forecasts.
- Market analysis.
- Data Management:
- Database management.
- Sorting and filtering data.
- Data cleaning and validation.
- Project Management:
- Task tracking and scheduling.
- Gantt charts and project timelines.
- Resource allocation.
- Statistical Analysis:
- Basic statistical calculations.
- Regression analysis.
- Data visualization with charts.
- Inventory Management:
- Tracking stock levels.
- Inventory valuation.
- Order management.
- Human Resources:
- Employee databases.
- Payroll calculations.
- Attendance tracking.
- Educational Use:
- Grading and assessment.
- Lesson planning.
- Data analysis for research projects.
- Scientific Research:
- Data collection and analysis.
- Graphing and charting results.
- Statistical analysis.
- Sales and Marketing:
- Sales tracking and reporting.
- Marketing campaign analysis.
- Customer relationship management.
- Personal Finance:
- Budgeting and expense tracking.
- Investment tracking.
- Retirement planning.
Excel’s versatility and ease of use make it a valuable tool in various fields and industries. It is a go-to solution for professionals and individuals who need to manage, analyze, and present numerical data efficiently.
What are feature of Excel?
Features of Microsoft Excel:
- Spreadsheets:
- Excel is built around the concept of spreadsheets, allowing users to organize data into rows and columns in a tabular format.
- Data Entry and Formatting:
- Users can enter and format data easily, adjusting font styles, sizes, colors, and cell formatting options.
- Formulas and Functions:
- Excel supports a wide range of mathematical, statistical, and logical formulas. Functions like SUM, AVERAGE, IF, VLOOKUP, and others enable powerful calculations.
- Charts and Graphs:
- Users can create various types of charts and graphs, including bar charts, line charts, pie charts, and more, to visualize data.
- Data Sorting and Filtering:
- Excel allows users to sort data alphabetically or numerically and filter data based on specific criteria.
- PivotTables:
- PivotTables enable users to summarize, analyze, and present data in a tabular format with dynamic calculations.
- Data Validation:
- Data validation rules can be applied to cells to ensure that data entered meets specified criteria. This helps maintain data accuracy.
- Conditional Formatting:
- Users can apply conditional formatting to cells, making it visually intuitive to identify trends, outliers, or specific data points.
- Data Import and Export:
- Excel supports importing data from external sources and exporting data to various formats, including CSV, text, and databases.
- Collaboration:
- Multiple users can collaborate on a workbook simultaneously. Changes are tracked, and comments can be added for communication.
- Automation with Macros:
- Users can automate repetitive tasks by recording and running macros, which are sequences of actions.
- Formula Auditing:
- Excel provides tools to audit and trace formulas, helping users understand complex formulas and identify errors.
- Solver:
- The Solver add-in helps find optimal solutions to mathematical problems, such as linear programming or optimization.
- Scenario Manager:
- Users can create and analyze different scenarios to assess the impact of changes in variables on the overall outcome.
What is the workflow of Excel?
Following is a workflow of Microsoft Excel:
- Open Excel:
- Launch the Excel application on your computer.
- Create a New Workbook:
- Start a new workbook to begin your project.
- Enter Data:
- Input data into cells by selecting the appropriate cell and typing. Use the keyboard or the formula bar for data entry.
- Format Data:
- Apply formatting to cells, such as changing font styles, colors, and adjusting cell borders.
- Apply Formulas and Functions:
- Use formulas and functions to perform calculations on the data. Formulas begin with an equal sign (
=).
- Use formulas and functions to perform calculations on the data. Formulas begin with an equal sign (
- Create Charts and Graphs:
- Visualize data by creating charts and graphs. Select the data range and choose the chart type from the “Insert” menu.
- Sort and Filter Data:
- Arrange data in a desired order using sorting. Apply filters to view specific subsets of data.
- Utilize PivotTables:
- Use PivotTables to summarize and analyze data dynamically. Drag and drop fields to arrange data as needed.
- Apply Conditional Formatting:
- Highlight cells based on certain conditions using conditional formatting. This makes it easier to identify trends and patterns.
- Data Validation:
- Set data validation rules to ensure that data entered meets specific criteria.
- Collaborate and Share:
- Share the workbook with others for collaboration. Use features like comments and track changes to communicate and review.
- Automate Tasks with Macros:
- Record and run macros to automate repetitive tasks. Macros can be created using the “Developer” tab.
- Audit Formulas:
- Use tools like “Trace Precedents” and “Trace Dependents” to audit and understand complex formulas.
- Save and Export:
- Save the workbook regularly and export data to different formats if needed.
- Protect Workbook:
- Protect the workbook or specific sheets with passwords to control access and prevent unintended changes.
- Explore Advanced Features:
- Explore advanced features like Solver, Scenario Manager, and other add-ins for specialized analysis.
Excel’s workflow is flexible and can be adapted to various tasks, from simple data entry and basic calculations to complex data analysis and reporting. Users often leverage a combination of features based on their specific needs and the complexity of the task at hand.
How Excel Works & Architecture?
Its intuitive interface and wide range of features make it a popular tool for individuals and businesses alike. Excel’s architecture is designed to support its extensive functionality and provide a user-friendly experience.
Core Components of Excel’s Architecture:
- Workbook: A workbook is the primary file format in Excel, representing an entire Excel document. It contains worksheets, charts, and other data structures.
- Worksheet: A worksheet is a rectangular grid of cells, each of which can hold a single value or formula. Worksheets are the main data storage units in Excel.
- Cells: Cells are the building blocks of worksheets, storing data, formulas, or formatting information. They are identified by their row and column coordinates.
- Formulas: Formulas are expressions that calculate values based on other cells or data. They are essential for performing data analysis and calculations.
- Functions: Excel provides a vast library of built-in functions for various tasks, including mathematical operations, statistical analysis, and text manipulation.
- Charts: Charts visually represent data using graphical elements, such as lines, bars, and pie charts. They are used to communicate insights and trends.
- Macros: Macros are automated sequences of actions that can be recorded and executed to automate repetitive tasks.
How Excel Works:
- Data Entry: Users enter data into cells, either manually or through data import.
- Formula Creation: Users create formulas to perform calculations or derive values from other cells.
- Data Manipulation: Excel provides tools for manipulating data, such as sorting, filtering, and data cleaning.
- Data Analysis: Excel offers a range of data analysis tools, including pivot tables, statistics functions, and chart creation.
- Visualizations: Excel generates charts and graphs to visualize data effectively and communicate insights.
Excel’s Architecture:
Excel’s architecture is layered, with each layer providing specific functionalities.
- User Interface: The user interface provides a graphical environment for interacting with Excel, including menus, toolbars, and the worksheet grid.
- Application Layer: The application layer handles user actions, manages data structures, and executes formulas.
- Calculation Engine: The calculation engine efficiently evaluates formulas and updates dependent cells based on changes.
- Data Storage Layer: The data storage layer manages the persistence of data, including workbooks, worksheets, and cells.
- File Format Layer: The file format layer defines the structure and encoding of Excel files.
Excel’s architecture is designed to be scalable, enabling it to handle large datasets and complex calculations. Its layered structure allows for modular development and integration with other tools.
Excel is a powerful spreadsheet application with a well-designed architecture that supports its extensive features and provides a user-friendly experience for data management, analysis, and visualization.
How to Install and Configure Excel?
Installing and configuring Excel depends on your operating system and whether you’re using a standalone Excel application or a part of a Microsoft Office suite. Here’s a step-by-step guide for both Windows and macOS systems:
Installing Excel on Windows:
Prerequisites:
- Administrator Privileges: You’ll need administrator privileges to install Excel.
Installation Steps:
- Download Excel: If you have purchased Excel as a standalone application, download the installer from the Microsoft Office website
- Run Installer: Run the downloaded installer and apply the on-screen instructions.
- Accept License Agreement: Agree to the license agreement to proceed with the installation.
- Customize Installation: Choose the desired installation options, such as installation location and feature selection.
- Complete Installation: Click “Install” to start the installation process. Once completed, Excel will be installed on your system.
Configuring Excel on Windows:
- Launch Excel: Double-click the Excel icon on your desktop or in the Start menu to launch the application.
- Create or Open Workbook: If you’re creating a new workbook, click “Blank workbook” or open an existing workbook by selecting the “File” tab and choosing “Open.”
- Customize Settings: Access settings through the “File” tab to personalize your Excel experience, such as color schemes, language preferences, and accessibility options.
Installing Excel on macOS:
Prerequisites:
- Mac App Store: Ensure you have access to the Mac App Store.
Installation Steps:
- Open Mac App Store: Open the Mac App Store application.
- Search for Excel: Search for “Microsoft Excel” in the search bar.
- Click “Get” or “Install”: If Excel is not already installed, click “Get” to download and install it. If it’s already installed, click the “Install” button.
- Enter Apple ID: If prompted, enter your Apple ID credentials to complete the installation.
Configuring Excel on macOS:
- Launch Excel: Open the Finder application and locate the “Applications” folder. Double-click the “Microsoft Excel” icon to launch the application.
- Create or Open Workbook: Similar to Windows, create a new workbook or open an existing one using the “File” menu.
- Customize Settings: Access settings through the “Excel” menu in the top menu bar to personalize your Excel experience, such as preferences, themes, and language options.
Notes:
- If you’re using Excel as part of a Microsoft Office suite, the installation and configuration process may differ slightly.
- For a subscription-based version of Excel, you may need to sign in with your Microsoft account to access the application.
- If you encounter any installation or configuration issues, refer to the Microsoft support documentation or contact Microsoft support for assistance.
Fundamental Tutorials of Excel: Getting started Step by Step

Following is a step-by-step fundamental tutorial of Excel, covering essential concepts and operations:
Step 1: Getting Started with Excel
- Launching Excel: Open the Microsoft Excel application on your computer.
- Understanding the Workbook and Worksheet: A workbook is the file that contains worksheets, which are the individual spreadsheet grids. Excel automatically opens a new workbook with a default worksheet named “Sheet1”.
- Navigating the Excel Interface: Familiarize yourself with the Excel interface, including the Ribbon, Formula bar, Name box, and Status bar.
- Entering and Editing Data: Click on a cell and start typing to enter data. Apply the arrow keys or the mouse to navigate between cells.
Step 2: Basic Data Manipulation and Formatting
- Formatting Text and Numbers: Use the Font, Alignment, and Number formatting options in the Home tab to customize the appearance of text and numbers in cells.
- Copying and Pasting: Use the Ctrl+C (Copy) and Ctrl+V (Paste) shortcuts or the Copy and Paste buttons in the Home tab to copy and paste data between cells, worksheets, or workbooks.
- Autofill Feature: Use the Autofill feature to quickly fill a range of cells with a pattern or series. Select the starting cell and drag the Autofill handle (small black square in the lower-right corner of the selected cell) to fill the desired range.
Step 3: Formulas and Functions
- Creating Simple Formulas: Use arithmetic operators (+, -, *, /) to create basic formulas in cells. For example, in cell B2, enter “=A2+A3” to add the values in cells A2 and A3.
- Understanding Cell References: Cell references refer to the location of other cells in the worksheet. In a formula, instead of typing the actual values, use cell references to refer to the cells that contain the values.
- Using Built-in Functions: Excel provides a wide range of built-in functions for various tasks, such as SUM, AVERAGE, COUNT, IF, and more. Use the Function Wizard or type the function name directly into a formula.
Step 4: Organizing and Analyzing Data
- Sorting Data: Use the Sort & Filter option in the Home tab to sort data in ascending or descending order based on one or more columns.
- Filtering Data: Use the Filter option in the Home tab to temporarily hide rows that don’t meet specific criteria.
- Creating PivotTables: PivotTables provide a powerful tool for summarizing, analyzing, and visualizing data. Use the PivotTable option in the Insert tab to create a PivotTable.
Step 5: Visualizing Data with Charts
- Creating Charts: Use the Charts group in the Insert tab to create various types of charts, such as line charts, bar charts, pie charts, and more.
- Selecting Chart Data: Excel automatically selects the data in the current worksheet when creating a chart. You can adjust the chart data range by clicking on the chart and using the data range selection tools.
- Customizing Charts: Use the Chart Design tab to customize the appearance of your chart, including chart title, axis labels, data series colors, and more.
Step 6: Enhancing Data Management
- Using Named Ranges: Assign names to ranges of cells to make formulas and references more meaningful and easier to manage.
- Data Validation: Use the Data Validation tool in the Data tab to restrict the type of data that can be entered into cells.
- Error Checking: Utilize Excel’s error checking tools to identify and correct errors in formulas or data.
These steps provide a fundamental foundation for using Excel.

Find Trusted Cardiac Hospitals
Compare heart hospitals by city and services — all in one place.
Explore Hospitals