What are Graphical Models Libraries?
Graphical Models Libraries are software tools and frameworks that provide functionalities to work with graphical models, a probabilistic framework to represent and reason about complex systems using graphs. Graphical models, also known as probabilistic graphical models (PGMs), are used to model the dependencies and interactions between random variables in a probabilistic manner. These libraries offer tools for building, training, and making inferences from graphical models, enabling researchers and developers to model and analyze complex data distributions.
Top 10 use cases of Graphical Models Libraries:
- Probabilistic Inference: Performing probabilistic inference to make predictions and estimates based on graphical models.
- Anomaly Detection: Detecting anomalies or outliers in complex datasets.
- Pattern Recognition: Identifying patterns and structures in data using graphical models.
- Natural Language Processing (NLP): Modeling the dependencies between words and sentences in NLP tasks.
- Computer Vision: Analyzing images and videos with graphical models to model visual dependencies.
- Causal Inference: Inferring causal relationships between variables in a system.
- Bioinformatics: Analyzing biological data, such as gene interactions and protein networks.
- Social Network Analysis: Modeling relationships and interactions in social networks.
- Finance: Modeling financial data for risk assessment and portfolio optimization.
- Healthcare: Modeling patient data for diagnosis and treatment recommendations.
What are the feature of Graphical Models Libraries?
- Graph Representation: Libraries provide tools to define and manipulate graphical models using graphs.
- Probabilistic Inference: They support various probabilistic inference algorithms for making predictions and estimates.
- Learning from Data: Graphical models libraries enable learning the structure and parameters of graphical models from data.
- Efficient Algorithms: Many libraries use efficient algorithms for inference and learning tasks.
- Causal Inference: Some libraries support causal inference algorithms to discover causal relationships.
How Graphical Models Libraries Work and Architecture?
The architecture of graphical models libraries can vary based on the specific library and its functionalities. Generally, they involve:
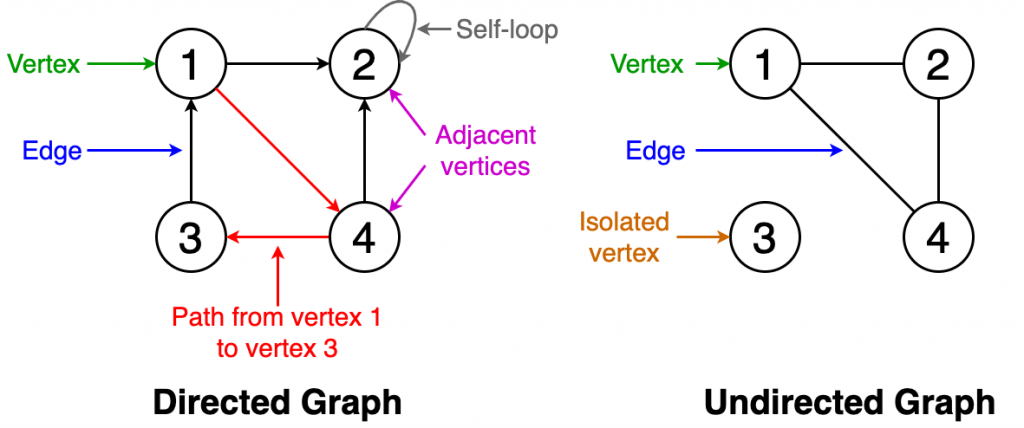
- Graph Definition: Define the structure of the graphical model using nodes and edges to represent random variables and their dependencies.
- Learning from Data: Learn the parameters and structure of the graphical model from observed data.
- Inference: Perform probabilistic inference to make predictions and estimates from the graphical model.
How to Install Graphical Models Libraries?
To install graphical models libraries, you can use package managers like pip or conda. Some popular graphical models libraries include pgmpy, OpenGM, and Infer.NET.
For example, to install pgmpy using pip, you can use the following command:
pip install pgmpyBefore installing a graphical models library, ensure you have the required dependencies and libraries for numerical computations.
Please refer to the official documentation and websites of the specific graphical models library you wish to install for detailed and up-to-date installation instructions.
Basic Tutorials of Graphical Models Libraries: Getting Started
Sure! Below are basic tutorials for getting started with Graphical Models Libraries step-by-step:
Basic Tutorials of Graphical Models Libraries
Tutorial 1: PyMC3
PyMC3 is a Python library for probabilistic programming. It allows you to build Bayesian models using intuitive Python syntax.
To get started with PyMC3, you’ll need to install it using pip. Once installed, you can import the library and start building your first Bayesian model.
Here’s an example of how to build a simple Bayesian model using PyMC3:
import pymc3 as pm

# Define the model
with pm.Model() as model:
    # Define the prior distribution for the parameter
    parameter = pm.Normal('parameter', mu=0, sd=1)

    # Define the likelihood function
    likelihood = pm.Binomial('likelihood', n=10, p=parameter, observed=5)

    # Inference
    trace = pm.sample(1000, tune=1000)

# Plot the posterior distribution
pm.plot_posterior(trace)Code language: PHP (php)
This code defines a Bayesian model with a normal prior distribution for the parameter and a binomial likelihood function. The model is then sampled using the Metropolis-Hastings algorithm, and the posterior distribution is plotted using the plot_posterior function.
Tutorial 2: Graph-tool
Graph-tool is a Python library for efficient graph analysis and manipulation. It provides a large number of graph algorithms and data structures.
To get started with Graph-tool, you’ll need to install it using pip. Once installed, you can import the library and start building your first graph.
Here’s an example of how to build a simple graph using Graph-tool:
import graph_tool as gt

# Create an empty graph
graph = gt.Graph(directed=False)

# Add vertices to the graph
v1 = graph.add_vertex()
v2 = graph.add_vertex()

# Add an edge between the vertices
graph.add_edge(v1, v2)Code language: PHP (php)
This code creates an empty undirected graph and adds two vertices to it. An edge is then added between the two vertices.
Tutorial 3: NetworkX
It is a Python library for the manipulation, creation, and study of complex networks. It provides a large number of network algorithms and data structures.
To get started with NetworkX, you’ll need to install it using pip. Once installed, you can import the library and start building your first network.
Here’s an example of how to build a simple network using NetworkX:
import networkx as nx

# Create an empty network
network = nx.Graph()

# Add nodes to the network
network.add_node(1)
network.add_node(2)

# Add an edge between the nodes
network.add_edge(1, 2)Code language: PHP (php)
This code creates an empty undirected network and adds two nodes to it. An edge is then added between the two nodes.
In this article, we provided step-by-step tutorials on some of the most popular graphical models libraries. We covered PyMC3, Graph-tool, and NetworkX. By following these tutorials, you should have a good understanding of how to use these libraries to build and analyze graphical models. Happy modeling!

👤 About the Author
Ashwani is passionate about DevOps, DevSecOps, SRE, MLOps, and AiOps, with a strong drive to simplify and scale modern IT operations. Through continuous learning and sharing, Ashwani helps organizations and engineers adopt best practices for automation, security, reliability, and AI-driven operations.
🌐 Connect & Follow:
- Website: WizBrand.com
- Facebook: facebook.com/DevOpsSchool
- X (Twitter): x.com/DevOpsSchools
- LinkedIn: linkedin.com/company/devopsschool
- YouTube: youtube.com/@TheDevOpsSchool
- Instagram: instagram.com/devopsschool
- Quora: devopsschool.quora.com
- Email– contact@devopsschool.com
Find Trusted Cardiac Hospitals
Compare heart hospitals by city and services — all in one place.
Explore Hospitals