What is Graylog?

Graylog is an open-source log management and log analysis platform that helps organizations collect, store, and analyze log data from various sources. It offers powerful search and visualization capabilities, making it valuable for a wide range of use cases.
Graylog’s flexibility, scalability, and open-source nature make it a versatile log management and analysis solution suitable for organizations of varying sizes and industries. It helps organizations improve their operational efficiency, enhance security, and gain valuable insights from their log data.
Top 10 use cases of Graylog:
Here are the top 10 use cases of Graylog:
- Log Management: Graylog serves as a central log management platform, collecting logs and events from diverse sources such as servers, network devices, applications, and cloud services.
- Real-Time Monitoring: Organizations use Graylog for real-time monitoring of system and network activity, enabling them to detect and respond to issues and anomalies as they occur.
- Security Information and Event Management (SIEM): Graylog can function as a SIEM solution by collecting, correlating, and analyzing security-related data to identify and respond to security incidents and threats.
- Incident Response: Graylog helps in incident response by providing security teams with the ability to investigate and analyze log data when responding to security incidents.
- Threat Detection: It plays a crucial role in threat detection by identifying patterns, anomalies, and indicators of compromise (IOCs) in log data to detect potential security threats.
- Troubleshooting and Debugging: Graylog assists IT and DevOps teams in troubleshooting and debugging applications and systems by providing a centralized platform for analyzing logs.
- Compliance and Auditing: Organizations use Graylog to maintain compliance with industry regulations and standards by collecting and retaining logs and generating compliance reports.
- Application Performance Monitoring (APM): Graylog can be used for APM by monitoring application logs and performance metrics to identify bottlenecks and issues impacting user experience.
- Network Traffic Analysis: It helps in analyzing network traffic logs and flow data to monitor network activity, detect unauthorized access, and troubleshoot network issues.
- Dashboard Creation: Graylog provides tools for creating customized dashboards and visualizations, allowing users to gain insights from log data through charts, graphs, and widgets.
- Infrastructure Monitoring: Organizations use Graylog for monitoring the health and performance of infrastructure components such as servers, databases, and cloud resources.
- Custom Alerting: Graylog allows users to set up custom alerting rules based on specific log events or conditions, enabling proactive notification of critical events.
- Application Log Analysis: Developers and application support teams use Graylog to analyze application logs, diagnose errors, and optimize code and application performance.
- Container and Microservices Monitoring: Graylog can monitor log data from containerized environments and microservices, helping teams track and troubleshoot issues in these dynamic environments.
- User and Entity Behavior Analytics (UEBA): Graylog can analyze user and entity behavior in log data to detect anomalies and potential security breaches.
What are the feature of Graylog?
Graylog is a robust open-source log management and log analysis platform that offers a range of features for collecting, storing, analyzing, and visualizing log data. Below are some key features of Graylog, along with an overview of how it works and its typical architecture:
Key Features of Graylog:
- Log Collection: Graylog can collect log and event data from various sources, including servers, network devices, applications, and cloud services. It supports multiple input methods, such as syslog, GELF (Graylog Extended Log Format), and various APIs.
- Real-Time Data Processing: It processes incoming log data in real-time, allowing for immediate analysis and response to events as they occur.
- Log Parsing and Normalization: Graylog normalizes and parses log data, making it consistent and structured for analysis. This normalization helps in correlating data from different sources.
- Advanced Search and Querying: Graylog provides a powerful search engine that allows users to query log data using a flexible query language. It supports full-text search, field-specific searches, and complex queries.
- Alerting and Notifications: Users can create custom alerting rules based on specific log events or conditions. Graylog can send notifications via various channels, including email, Slack, and more.
- Dashboards and Visualization: Graylog offers customizable dashboards and visualizations, enabling users to create charts, graphs, and widgets to gain insights from log data.
- Log Storage: It stores log data in an indexed and searchable format, making it easy to retrieve and analyze historical log entries.
- Security and Access Control: Graylog provides user authentication and role-based access control (RBAC) to ensure that only authorized users have access to log data and system configuration.
- Integration and Plugins: Graylog supports a wide range of integrations and plugins, allowing users to extend its functionality to meet specific needs and connect with various data sources.
How Graylog works and Architecture?
- Data Collection: Graylog collects log data from various sources using inputs like syslog, GELF, or custom APIs. Data can come from servers, applications, network devices, and more.
- Data Processing: Incoming log data is processed in real-time. Graylog normalizes and parses the data, making it structured and searchable.
- Storage: Processed log data is stored in Elasticsearch, which is used for indexing and fast retrieval. Elasticsearch provides scalability and efficient log storage.
- Search and Querying: Users interact with Graylog through a web-based interface, where they can perform searches, build complex queries, and analyze log data.
- Alerting: Graylog can trigger alerts based on predefined or custom rules. When an alert condition is met, notifications are sent to the designated recipients.
- Visualization: Users can create custom dashboards and visualizations to monitor and gain insights from log data. Visualization widgets can be added to dashboards for real-time monitoring.
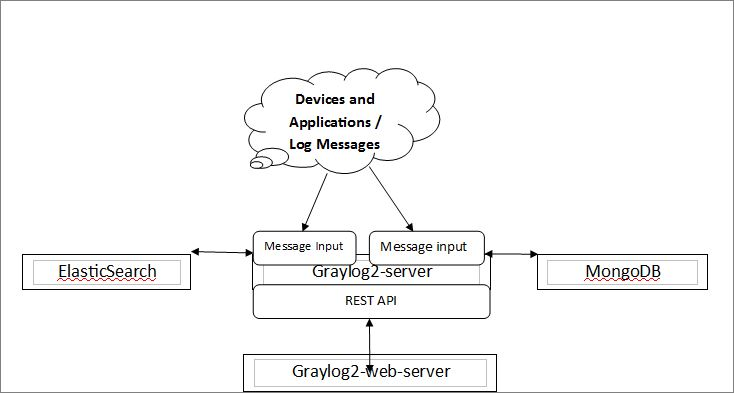
Graylog’s architecture typically consists of the following components:
- Graylog Server: This component is responsible for collecting, processing, and storing log data. It also provides the web-based user interface for interacting with the system.
- Elasticsearch: Graylog uses Elasticsearch for indexing and storing log data. Elasticsearch is a highly scalable and efficient search and analytics engine.
- MongoDB: MongoDB is used for storing configuration data, metadata, and user information. It acts as a backend database for Graylog.
- Inputs: Inputs are used to collect log data from various sources. Graylog supports multiple input methods, including syslog, GELF, and various APIs.
- Outputs: Outputs are used to send log data to external systems or services for further analysis or storage. Common outputs include Elasticsearch, Kafka, and various alerting channels.
- Plugins: Graylog supports plugins that extend its functionality. These plugins can provide additional input methods, alerting options, and integrations with third-party systems.
- Collector Sidecar: Collector Sidecar is an optional agent that can be installed on servers to collect log data and forward it to Graylog. It simplifies the process of collecting logs from various sources.
Graylog’s architecture is designed to be scalable and flexible, allowing organizations to adapt the system to their specific requirements. It provides a comprehensive log management and analysis solution suitable for small to large enterprises seeking to centralize and gain insights from their log data.
How to Install Graylog?
To install Graylog, you will need the following:
- A server with Ubuntu 20.04 or later installed
- A Java Runtime Environment (JRE)
- A MongoDB database
- A Graylog license
Once you have the prerequisites installed, you can follow these steps to install Graylog:
- Download the Graylog installation package from the Graylog website.
- Extract the Graylog installation package to a directory on your server.
- Open a terminal window and navigate to the directory where you extracted the Graylog installation package.
- Run the following command to start the Graylog installation process:
sudo ./graylog-server-installation.sh- Implement the on-screen instructions to fulfill the installation process.
Once the installation process is complete, you will need to configure Graylog.
- Open a web browser and proceed to the below URL:
https://<Graylog server IP address>:9000Code language: HTML, XML (xml)- Enter the Graylog administrator username and password. The default username and password are
adminandadmin. - Follow the on-screen instructions to complete the configuration process.
Once Graylog is configured, you can start adding data sources and creating dashboards.
Some additional tips for installing Graylog:
- Make sure that your server has the required system requirements.
- If you are installing Graylog in a production environment, it is recommended to follow the Graylog hardening guide to secure your installation.
- You can also find a variety of tutorials and other resources on the Graylog website.
Graylog is a powerful log management platform that can help you to improve your security posture by helping you to collect, analyze, and visualize your security data. By following the steps above, you can learn how to install Graylog and start using it to improve your security posture.
Basic Tutorials of Graylog: Getting Started
The following are the steps of Basic Tutorials of Graylog:
1. Install and configure Graylog
Graylog can be installed on-premises or in the cloud. There are many different ways to install Graylog, but the most common is to use a virtual machine (VM).
Once Graylog is installed, you need to configure it. This includes setting up the following:
- Inputs: Inputs are how Graylog receives logs. There are many different types of inputs, such as Syslog, TCP, and UDP.
- Outputs: Outputs are how Graylog sends logs to other systems. There are many different types of outputs, such as Elasticsearch, Kafka, and Splunk.
- Extractors: Extractors are used to parse log messages and extract key fields from them. This makes it simpler to analyze and search logs.
- Streams: Streams are used to group logs together. This can be useful for organizing logs by application, server, or other criteria.
2. Collect logs
Once Graylog is configured, you need to start collecting logs. You can do this by configuring your devices and applications to send logs to Graylog.
3. Search and analyze logs
Once Graylog has collected logs, you can start searching and analyzing them. You can use the Graylog web interface to search for logs by keyword, date, and other criteria. You can also create dashboards to visualize your log data.
4. Alert on logs
Graylog can be used to alert you to important events in your logs. You can create alerts based on specific keywords, log levels, and other criteria.
5. Retain logs
Graylog can be used to retain logs for a specific period of time. This is useful for compliance and troubleshooting purposes.
More detailed tutorial on how to get started with Graylog:
- Download and install Graylog.
- Configure Graylog inputs, outputs, extractors, and streams.
- Configure your devices and applications to send logs to Graylog.
- Start searching and analyzing logs using the Graylog web interface.
- Create dashboards to visualize your log data.
- Create alerts to notify you of important events in your logs.
- Configure Graylog to retain logs for a specific period of time.
Some additional tips for using Graylog:
- Use extractors to parse your log messages and extract key fields from them. This will make it easier to search and analyze your logs.
- Group your logs into streams. This will help you organize your logs and make them easier to find.
- Apply dashboards to visualize your log data. This will help you quickly identify trends and patterns in your logs.
- Create alerts to notify you of important events in your logs. This will help you suddenly respond to problems.
- Retain your logs for a specific period of time. This is useful for compliance and troubleshooting purposes.
Graylog is a powerful log management tool that can help you improve your IT operations. By following these basic tutorials, you can get started with Graylog quickly and easily.

👤 About the Author
Ashwani is passionate about DevOps, DevSecOps, SRE, MLOps, and AiOps, with a strong drive to simplify and scale modern IT operations. Through continuous learning and sharing, Ashwani helps organizations and engineers adopt best practices for automation, security, reliability, and AI-driven operations.
🌐 Connect & Follow:
- Website: WizBrand.com
- Facebook: facebook.com/DevOpsSchool
- X (Twitter): x.com/DevOpsSchools
- LinkedIn: linkedin.com/company/devopsschool
- YouTube: youtube.com/@TheDevOpsSchool
- Instagram: instagram.com/devopsschool
- Quora: devopsschool.quora.com
- Email– contact@devopsschool.com
Find Trusted Cardiac Hospitals
Compare heart hospitals by city and services — all in one place.
Explore Hospitals