What is Honeycomb?

Honeycomb is an observability platform built for high-velocity environments. It specializes in ingesting massive amounts of data from diverse sources like applications, services, infrastructure, and logs. Once ingested, Honeycomb offers powerful tools for real-time analysis, anomaly detection, and visualization, enabling developers and engineers to:
- Troubleshoot issues quickly: Drill down into specific events and identify root causes of performance problems with ease.
- Monitor application health: Track key metrics and proactively detect anomalies before they impact users.
- Understand system behavior: Gain insights into complex systems and optimize resource utilization.
- Improve developer productivity: Streamline debugging workflows and collaborate effectively on resolving issues.
Top 10 use cases of Honeycomb?
Top 10 Use Cases of Honeycomb:
- Microservices troubleshooting: Trace requests across distributed systems and pinpoint issues to specific services.
- Performance monitoring: Identify performance bottlenecks and track key metrics like latency and throughput.
- Incident response: Quickly diagnose and resolve critical incidents that impact customer experience.
- Continuous integration and delivery (CI/CD): Monitor deployments and rollbacks to ensure smooth application updates.
- Cloud-native application monitoring: Gain insights into the performance and health of applications running in the cloud.
- Log analysis: Analyze application logs in real-time to detect errors and anomalies.
- Infrastructure monitoring: Monitor the health and performance of servers, network, and other infrastructure components.
- Security monitoring: Detect potential security threats and investigate suspicious activity.
- Root cause analysis: Get to the bottom of complex issues quickly and efficiently.
- Custom dashboards and alerts: Build custom dashboards to visualize key metrics and set up alerts for proactive monitoring.
Honeycomb’s unique architecture and features make it ideal for large-scale, dynamic environments where traditional monitoring tools fall short. It helps teams work faster, troubleshoot effectively, and deliver reliable, high-performance applications.
What are the feature of Honeycomb?
Honeycomb by Honeycomb.io boasts a rich set of features designed for efficient data ingestion, analysis, and troubleshooting in high-velocity environments. Here are some key highlights:
Data Ingestion and Storage:
- Unrestricted Data Intake: Ingest any kind and volume of data, including metrics, traces, logs, and events, without format limitations.
- Real-time Ingestion: Stream data instantly with minimal latency, ensuring you’re working with the latest information.
- Automatic Schema Detection: No need to pre-define schemas. Honeycomb automatically detects and adapts to your data structure.
- Flexible Retention: Store data for as long as needed with customizable retention policies based on time, size, or cost.
Analysis and Visualization:
- Powerful Query Language: Use HoneyQL, a familiar-yet-expressive query language, to analyze and filter data across different dimensions.
- Live Dashboards: Build interactive dashboards in real-time to visualize key metrics, track trends, and identify anomalies.
- Ad-hoc Analysis: Explore your data freely without complex setup or configuration. Drill down into specific events and discover hidden insights.
- Alerts and Notifications: Set up custom alerts based on specific conditions to be notified instantly about potential issues.
Troubleshooting and Root Cause Analysis:
- Distributed Tracing: Trace requests across your entire system, regardless of complexity, to pinpoint the source of issues.
- Time travel: Replay historical data to see how your system behaved at any point in time and diagnose past incidents.
- Detailed Event Views: Analyze individual events with rich context and metadata to understand their impact and relationships.
- Collaboration Tools: Share dashboards, alerts, and insights with your team to collaborate effectively on problem-solving.
Additional Features:
- Scalability and Flexibility: Scale Honeycomb horizontally to handle growing data volumes without performance degradation.
- Open APIs and Integrations: Integrate Honeycomb with your existing tools and workflows for seamless data exchange.
- Security and Compliance: Honeycomb adheres to strict security standards and data privacy regulations.
These features make Honeycomb a powerful tool for developers, engineers, and operations teams to monitor, analyze, and troubleshoot systems effectively.
How Honeycomb works and Architecture?
Honeycomb’s impressive performance and scalability boil down to its unique architecture, dubbed the “Time-Series Shard” architecture. Here’s a breakdown of how it works:
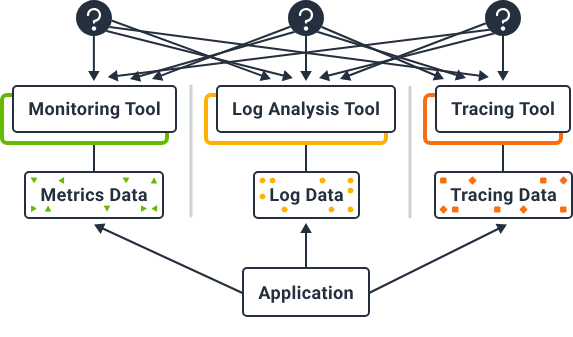
Data Ingestion:
- Data streams: Metrics, traces, logs, and events flow from various sources into Honeycomb.
- Pre-processing: Data is parsed and enriched with timestamp and contextual information.
- Sharding: Data is sliced into small, time-bounded segments called “shards” based on timestamps.
- Distributed Storage: Shards are distributed across a cluster of nodes for parallel processing and storage.
Data Analysis and Querying:
- Query engine: Users submit queries using HoneyQL, the platform’s query language.
- Parallel execution: The query is broken down and sent to relevant nodes containing the specific timeframes required.
- Local shard processing: Each node executes the query on its local shards, taking advantage of the pre-processed data within.
- Aggregated results: Partial results from each node are aggregated and returned to the user in real-time.
Key Architectural Highlights:
- Time-series sharding: Enables efficient data partitioning and parallelization, drastically reducing query processing times.
- Distributed storage and processing: Leverages the power of clustered nodes for horizontal scaling and fault tolerance.
- Pre-processed data: Minimizes processing overhead during query execution, maximizing response speed.
- Real-time ingest and querying: Offers near-instantaneous insights into your system without lag.
Benefits of this architecture:
- Highly scalable: Can handle massive data volumes without performance degradation.
- Fast queries: Responds to complex queries in milliseconds, ideal for real-time analysis.
- Cost-effective: Efficient data sharding optimizes storage needs and reduces costs.
- Fault-tolerant: Distributed design ensures high availability and resilience even if nodes fail.
How to Install Honeycomb it?
There are two ways to “install” Honeycomb, depending on what you mean:
1. Setting up Honeycomb for Data Ingestion:
This involves configuring your application or services to send data to Honeycomb. The process varies based on your programming language and framework. Here are the general steps:
- Add Dependencies: Install the appropriate Honeycomb OpenTelemetry SDK for your framework (e.g., Python, Java, Node.js).
- Initialize: Configure the SDK with your Honeycomb API key and other settings.
- Instrument your code: Add OpenTelemetry instrumentation to your code to capture relevant traces and spans.
- Run your application: The instrumented code will automatically send data to Honeycomb.
2. Setting up Honeycomb UI and Refinery:
If you want to access and analyze the data you sent to Honeycomb, you need to set up the Honeycomb UI and Refinery:
- Create a Honeycomb Account: If you haven’t already, sign up for a free account at Honeycomb official website.
- Deploy Refinery: Refinery is a distributed service that processes and stores traces for analysis. Choose a deployment method based on your infrastructure (e.g., Kubernetes, Docker, manual installation).
- Configure UI: Once Refinery is running, configure the Honeycomb UI to connect to it. This will allow you to visualize and analyze your traces and other data.
Note:
- Choose the appropriate installation method based on your needs and infrastructure.
- Consult the Honeycomb documentation for detailed instructions and specific configurations for your language and framework.
- Don’t hesitate to reach out to Honeycomb support if you encounter any issues during the setup process.
Basic Tutorials of Honeycomb: Getting Started
Honeycomb can be a powerful tool, but getting started can be a bit daunting. Here’s a step-by-step basic tutorial to help you navigate your first steps:
1. Sign up for a free trial:
- Head to the Honeycomb website and click “Get Started.”
- Create a free account with your email address and choose a trial plan (Basic or Advanced).
- Verify your email and log in to your new Honeycomb account.
2. Add your data sources:
- In the “Data Sources” section, click “Add Data Source.”
- Choose the type of data you want to ingest, such as metrics, traces, or logs.
- Follow the specific instructions for each data source type to connect it to Honeycomb.
- This might involve installing an agent on your servers, configuring an integration with your existing tools, or uploading log files.
3. Explore your data with HoneyQL:
- Once your data starts flowing in, you can start querying it with HoneyQL.
- HoneyQL is a powerful yet intuitive query language similar to SQL.
- You can find basic tutorials and examples in the Honeycomb documentation.
- Start with simple queries to get familiar with the syntax and see your data in action.
- For example, you could query for all events with a specific error message or all requests that took longer than a certain threshold.
4. Build dashboards:
- Honeycomb makes it easy to create interactive dashboards to visualize your data.
- Drag and drop widgets onto your dashboard to display different metrics, traces, or logs.
- You can customize the look and feel of your dashboard and share it with your team.
- Dashboards are great for monitoring key indicators and identifying trends or anomalies.
5. Set up alerts:
- Honeycomb allows you to set up alerts based on specific conditions in your data.
- You can define criteria for triggering an alert, like a sudden spike in errors or a drop in performance.
- When an alert is triggered, you can receive notifications via email, SMS, or integrations with other tools.
- Alerts are crucial for proactive troubleshooting and ensuring your system is running smoothly.
Additional Tips:
- Take advantage of the Honeycomb documentation and learning resources.
- There are plenty of tutorials, webinars, and blog posts to help you get started.
- Join the Honeycomb community forum to ask questions and learn from other users.
- Don’t be afraid to experiment and try new things with Honeycomb.
- The more you explore, the more you’ll discover its potential for monitoring, troubleshooting, and improving your systems.
This is just a basic introduction. As you get more comfortable with Honeycomb, you can explore its advanced features and customize it to fit your specific needs.

Find Trusted Cardiac Hospitals
Compare heart hospitals by city and services — all in one place.
Explore Hospitals