What is JaCoCo ?
JaCoCo (Java Code Coverage) is an open-source code coverage library for Java projects. It provides detailed insights into which parts of the codebase are covered by automated tests and which are not.
Top 10 use cases of JaCoCo ?
Here are the top 10 use cases for JaCoCo:
- Code Coverage Analysis:
- JaCoCo measures the percentage of code that is executed by automated tests, known as code coverage.
- It gives detailed reports indicating which parts of the codebase are covered by tests and which are not.
- Line, Branch, and Method Coverage:
- JaCoCo supports various types of code coverage metrics, including line coverage, branch coverage, and method coverage.
- Developers can analyze coverage at the level of individual lines of code, branches (such as if statements), and methods.
- Integration with Build Systems:
- JaCoCo integrates seamlessly with popular Java build systems such as Maven, Ant, and Gradle.
- It can be easily incorporated into the build process to generate code coverage reports automatically.
- Multiple Report Formats:
- JaCoCo generates code coverage reports in multiple formats, including HTML, XML, and CSV.
- These reports provide detailed information about code coverage metrics, uncovered code segments, and coverage trends over time.
- Historical Reporting:
- JaCoCo maintains historical data about code coverage trends over multiple test runs.
- Developers can track changes in code coverage over time to ensure that coverage targets are being met and to identify trends in test effectiveness.
- Coverage Thresholds:
- Developers can define coverage thresholds based on project requirements or organizational standards.
- JaCoCo allows users to set minimum acceptable coverage levels and generates warnings or errors if coverage falls below these thresholds.
- Identifying Uncovered Code:
- JaCoCo highlights code segments that are not covered by tests, helping developers identify areas of the codebase that require additional testing.
- Uncovered code segments are visually indicated in the coverage reports, making it easy to identify gaps in test coverage.
- Continuous Integration (CI) Support:
- Incorporating JaCoCo into Continuous Integration (CI) pipelines enables automated code coverage analysis with each build.
- It helps ensure that code changes are adequately tested before being deployed and provides immediate feedback on code coverage metrics.
- Integration with IDEs:
- JaCoCo integrates with popular Java Integrated Development Environments (IDEs) such as IntelliJ IDEA, Eclipse, and NetBeans.
- Developers can view code coverage information directly within their IDEs and use it to guide test development and debugging.
- Customization and Configuration:
- JaCoCo provides options for customizing and configuring the coverage analysis process.
- Users can define coverage exclusions, customize report content and formatting, and adjust instrumentation settings to suit their specific requirements.
JaCoCo is a valuable tool for Java developers seeking to improve the quality and reliability of their code through effective test coverage analysis. It facilitates better testing practices, enhances code quality, and contributes to overall software reliability.
What are the feature of JaCoCo ?
JaCoCo (Java Code Coverage) is a powerful code coverage tool for Java projects. It provides a range of features to help developers measure the effectiveness of their test suites and identify areas of the codebase that require additional testing. Here are some of the key features of JaCoCo:
- Line Coverage:
- JaCoCo measures line coverage, indicating which lines of code in the source files have been executed by tests and which have not.
- Branch Coverage:
- Branch coverage measures whether all possible branches in the code have been exercised by tests, including if/else statements and switch cases.
- Method Coverage:
- JaCoCo tracks whether all methods in the codebase have been invoked during test runs, providing insights into the completeness of test coverage at the method level.
- Instruction Coverage:
- JaCoCo measures instruction coverage, indicating whether all bytecode instructions in the code have been executed by tests.
- Cyclomatic Complexity:
- JaCoCo calculates cyclomatic complexity metrics for methods, helping developers identify complex methods that may require additional testing.
- Integration with Build Systems:
- JaCoCo seamlessly integrates with popular Java build systems such as Maven, Ant, and Gradle.
- It can be easily incorporated into the build process to generate code coverage reports automatically.
- Multiple Report Formats:
- JaCoCo supports multiple report formats, including HTML, XML, and CSV.
- These reports provide detailed information about code coverage metrics, uncovered code segments, and coverage trends over time.
- Historical Reporting:
- JaCoCo maintains historical data about code coverage trends over multiple test runs.
- Developers can track changes in code coverage over time to ensure that coverage targets are being met and to identify trends in test effectiveness.
- Threshold Configuration:
- Developers can define coverage thresholds based on project requirements or organizational standards.
- JaCoCo allows users to set minimum acceptable coverage levels and generates warnings or errors if coverage falls below these thresholds.
- IDE Integration:
- JaCoCo integrates with popular Java Integrated Development Environments (IDEs) such as IntelliJ IDEA, Eclipse, and NetBeans.
- Developers can view code coverage information directly within their IDEs and use it to guide test development and debugging.
- Coverage Exclusions:
- JaCoCo allows users to exclude specific classes, packages, or code segments from coverage analysis, providing flexibility in defining coverage targets.
- Continuous Integration (CI) Support:
- Incorporating JaCoCo into Continuous Integration (CI) pipelines enables automated code coverage analysis with each build.
- It helps ensure that code changes are adequately tested before being deployed and provides immediate feedback on code coverage metrics.
JaCoCo offers a comprehensive set of features for measuring code coverage in Java projects, helping developers improve the quality and reliability of their code through effective test coverage analysis.
How JaCoCo works and Architecture?
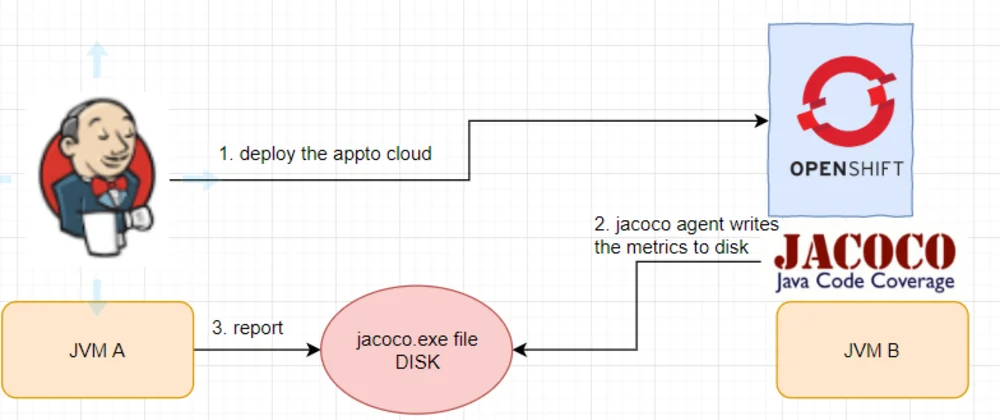
JaCoCo, or Java Code Coverage, works by instrumenting Java bytecode to track which parts of the codebase are executed during test runs. It then generates reports based on this information to provide insights into code coverage. Below is an overview of how JaCoCo works and its architecture:
- Bytecode Instrumentation:
- JaCoCo instruments the Java bytecode of the classes being tested. It inserts additional bytecode instructions to track code coverage during runtime.
- These instructions record information about which lines of code, branches, and methods are executed during test runs.
- Test Execution:
- After bytecode instrumentation, the instrumented classes are used during test execution.
- As the tests are run, JaCoCo tracks the execution of each line of code, branch decisions, and method invocations.
- Data Collection:
- JaCoCo collects coverage data during test execution. It records information about which parts of the code have been executed and how many times.
- Coverage data is typically stored in memory or written to temporary files during test execution.
- Coverage Analysis:
- Once the tests are complete, JaCoCo analyzes the collected coverage data to determine the code coverage metrics.
- It calculates metrics such as line coverage, branch coverage, and method coverage based on the recorded execution information.
- Report Generation:
- JaCoCo generates code coverage reports based on the analyzed coverage data.
- These reports provide detailed information about the coverage metrics, including which lines of code are covered by tests and which are not.
- Report Formats:
- JaCoCo supports multiple report formats, including HTML, XML, and CSV.
- These reports can be generated to provide detailed insights into code coverage metrics and trends.
- Integration with Build Systems:
- JaCoCo integrates with popular Java build systems such as Maven, Ant, and Gradle.
- It can be easily incorporated into the build process to generate code coverage reports automatically.
- Continuous Integration (CI) Support:
- Incorporating JaCoCo into Continuous Integration (CI) pipelines enables automated code coverage analysis with each build.
- It helps ensure that code changes are adequately tested before being deployed and provides immediate feedback on code coverage metrics.
- Integration with IDEs:
- JaCoCo integrates with popular Java Integrated Development Environments (IDEs) such as IntelliJ IDEA, Eclipse, and NetBeans.
- Developers can view code coverage information directly within their IDEs and use it to guide test development and debugging.
JaCoCo’s architecture involves bytecode instrumentation, test execution, data collection, coverage analysis, and report generation to provide insights into code coverage and facilitate the improvement of test suites.
How to Install JaCoCo it?
Installing JaCoCo depends on your specific needs and environment. Here are the main options:
1. Using JaCoCo with Maven:
This is the most common approach for Java projects using Maven for build management. Here’s how to install it:
- Add the JaCoCo plugin to your
pom.xmlfile:
XML
<plugin>
  <groupId>org.jacoco</groupId>
  <artifactId>jacoco-maven-plugin</artifactId>
  <version>0.8.11</version>
  <executions>
    <execution>
      <id>prepare-agent</id>
      <goals>
        <goal>prepare-agent</goal>
      </goals>
    </execution>
    <execution>
      <id>report</id>
      <phase>verify</phase>
      <goals>
        <goal>report</goal>
      </goals>
    </execution>
  </executions>
</plugin>
Code language: HTML, XML (xml)- Run your tests: Apply
mvn testto run your tests with JaCoCo instrumentation. - View the coverage report: The coverage report will be generated in the
target/site/jacocodirectory.
2. Using JaCoCo with Gradle:
Similar to Maven, you can integrate JaCoCo with Gradle projects using the JaCoCo plugin. Here’s how:
- Add the JaCoCo plugin to your
build.gradlefile:
Groovy
plugins {
  jacoco
}

jacoco {
  toolVersion = "0.8.11"
}

tasks.withType(Test) {
  useJUnitPlatform()
  jacoco.includeNoClasses = true
}

tasks.withType(JacocoReport) {
  reports.html.enabled = true
  reports.xml.enabled = false
}
Code language: JavaScript (javascript)- Run your tests: Use
gradlew testto run your tests with JaCoCo instrumentation. - View the coverage report: The coverage report will be generated in the
build/reports/jacocodirectory.
3. Using JaCoCo Standalone:
This approach is useful if you’re not using a build tool like Maven or Gradle. You need to manually download the JaCoCo library and configure it for your project.
Notes:
- You can customize the JaCoCo configuration to exclude certain packages or classes from coverage measurement.
- Explore more advanced features like code coverage for integration tests and historical code coverage analysis.
- Remember to choose the appropriate installation method based on your project setup and preferred tools.
Basic Tutorials of JaCoCo: Getting Started
Now, Let’s walk through the step-by-step process of setting up JaCoCo for code coverage in your Java project. JaCoCo (Java Code Coverage) is a powerful tool that calculates test coverage by analyzing the percentage of branches and lines accessed by unit tests. Here’s how to get started:
- Create a Simple Java Application:
- Write some test cases inside your Java application using JUnit or you can also use Mockito.
- For example, create a sample project with a simple Java function that checks whether a string is a palindrome.
2. Add the JaCoCo Maven Plugin:
- Open your project’s
pom.xmlfile. - Add the following configuration for the JaCoCo Maven plugin:
<build>
<plugins>
<plugin>
<groupId>org.jacoco</groupId>
<artifactId>jacoco-maven-plugin</artifactId>
<version>0.8.5</version>
<executions>
<execution>
<goals>
<goal>prepare-agent</goal>
</goals>
</execution>
<execution>
<id>report</id>
<phase>test</phase>
<goals>
<goal>report</goal>
</goals>
</execution>
</executions>
</plugin>
</plugins>
</build>
- This configuration sets up JaCoCo to generate code coverage reports during the
testphase.
3. Update Code and Run Tests:
- After adding the JaCoCo plugin, update your code as needed.
- Run your tests using JUnit. JaCoCo will automatically collect coverage data.
- The coverage report will be created in binary format in the
targetdirectory (e.g.,target/jacoco.exec).
4. Generate Readable Reports:
- To generate human-readable code coverage reports, use the following Maven goal:
mvn jacoco:report - This will create reports in formats like HTML, CSV, and XML.
- You can view the HTML report at
target/site/jacoco/index.html.
5. Integrate with IDEs:
- Inside Eclipse, you can use the EclEmma plugin for seamless code coverage visualization.
- In IntelliJ IDEA, JaCoCo integrates well with the IDE.
Always remember to adapt these steps to your specific project needs. Happy coding and may your tests be ever in your favor! 🚀🔍

Find Trusted Cardiac Hospitals
Compare heart hospitals by city and services — all in one place.
Explore Hospitals