What is Jaeger?

Jaeger is an open-source, distributed tracing platform released by Uber Technologies. It helps monitor and debug microservices-based distributed systems by allowing you to visualize the flow of requests across different services in your application. This makes it easier to understand how your application works and identify performance bottlenecks or other issues.
Here are some key features of Jaeger:
- Distributed tracing: It tracks the entire journey of a request across multiple services, providing insights into how each service contributes to the overall performance.
- Real-time visualization: You can see the request trace in a user-friendly web interface, showing the duration of each step and any errors that occurred.
- Root cause analysis: Jaeger helps you pinpoint the exact source of performance issues by identifying the service that is causing the bottleneck.
- Extensible: Jaeger integrates with various programming languages and libraries, making it easy to instrument your application for tracing.
Top 10 use cases of Jaeger?
Top 10 Use Cases of Jaeger:
- Troubleshooting performance bottlenecks: Identify which service is slowing down your application and what needs to be optimized.
- Debugging errors: Quickly understand the sequence of events that led to an error and fix it faster.
- Understanding service dependencies: Visualize how different services interact with each other and identify potential coupling issues.
- Monitoring service health: Jaeger provides insights into the performance and availability of individual services.
- Performance optimization: Use tracing data to identify areas for improvement and optimize your application’s performance.
- Improving developer productivity: Developers can use Jaeger to understand the behavior of their code and debug issues more efficiently.
- Enhancing user experience: Trace user requests to understand their journey and identify any pain points.
- Compliance with regulations: Jaeger can help you track data flow and demonstrate compliance with data privacy regulations.
- Microservices migration: Use Jaeger to monitor and debug your application during and after migrating to a microservices architecture.
- Continuous monitoring and alerting: Set up alerts to be notified when specific performance thresholds are exceeded, allowing you to proactively address issues.
Overall, Jaeger is a powerful tool for anyone working with microservices-based distributed systems. It can help you improve performance, identify and resolve issues, and gain deeper insights into how your application works.
What are the feature of Jaeger?
Jaeger boasts a rich suite of features for tracing, analyzing, and visualizing the distributed landscape of your microservices architecture. Here are some highlights:
Distributed Tracing:
- Cross-service tracking: Follow the complete journey of a request across all your microservices, understanding inter-service communication and dependencies.
- Span collection and context propagation: Automatically capture detailed data (spans) of each stage in the request’s journey and seamlessly propagate context across services.
- Flexible instrumentation: Integrate Jaeger with popular programming languages and frameworks for effortless tracing in your code base.
Real-time Visualization and Analysis:
- Interactive UI: Explore traces through a user-friendly web interface with customizable views, highlighting key metrics and timelines.
- Rich data exploration: Filter, search, and aggregate trace data to identify patterns and pinpoint potential issues.
- Advanced analytics: Leverage built-in dashboards and reporting tools to gain deeper insights into service performance and health.
Root Cause Analysis and Error Handling:
- Pinpoint bottleneck services: Identify the service responsible for performance degradations in the request flow.
- Detailed diagnostics: Analyze individual spans within a trace to understand specific bottlenecks and error causes.
- Incident investigation: Streamline troubleshooting by visualizing and correlating traces with logs and other monitoring data.
Scalability and Performance:
- Distributed storage: Horizontally scalable storage options like Cassandra and Elasticsearch handle massive volumes of trace data seamlessly.
- Microservices-native design: Scalable architecture adapts to complex systems with numerous microservices without performance penalties.
- Integration and extensibility: Integrate Jaeger with other APM platforms and monitoring tools for a unified view of your IT landscape.
Additional Features:
- Security and access control: Secure storage and access management ensure data privacy and control who can view trace data.
- Open-source community: Active community of developers providing support, libraries, and extensions for continuous improvements.
- Cloud-native deployments: Supports deployment on major cloud platforms for easy integration with your cloud infrastructure.
These features make Jaeger a powerful tool for:
- Identifying and resolving performance bottlenecks.
- Understanding service interactions and dependencies.
- Debugging errors and anomalies quickly.
- Optimizing microservices architecture and code.
- Gaining comprehensive insights into your distributed system.
How Jaeger works and Architecture?
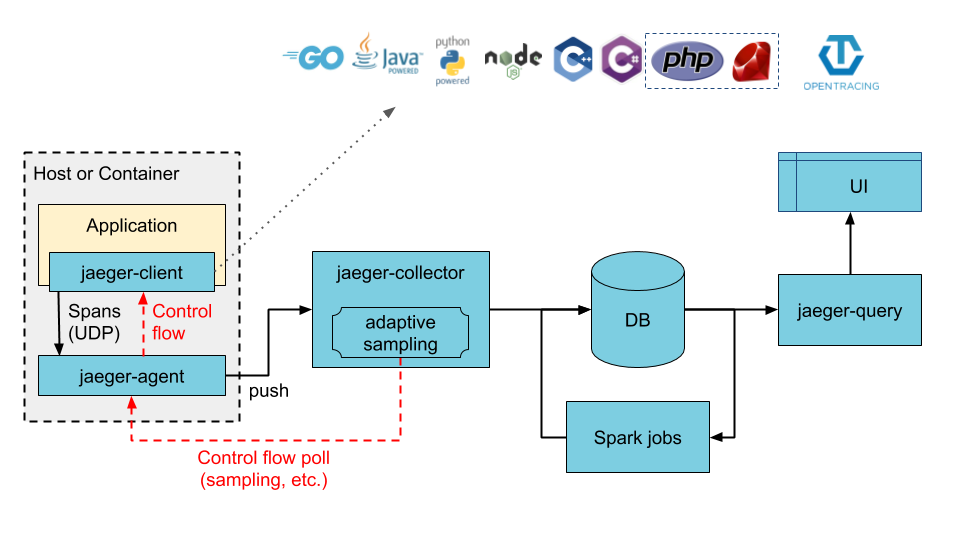
Jaeger’s power lies in its distributed architecture, designed to efficiently trace requests across diverse microservices at scale. Here’s a breakdown of the key components:
Data Ingestion:
- Agents: Installed on service instances, agents intercept and inject trace context into outgoing requests. They also collect and forward trace data (spans) to the collector.
- Collectors: Receive spans from agents, validate and buffer them, and forward them to the storage backend. They handle load balancing and initial processing for efficient data handling.
- Span Storage: Spans are stored in a horizontally scalable database like Cassandra or Elasticsearch, allowing high-volume data ingest and fast retrieval.
Data Analysis and Visualization:
- Query Engine: Users submit queries through the Jaeger UI or API to analyze stored trace data. The engine filters, aggregates, and presents relevant information based on query parameters.
- Visualization and Reporting: Traces are displayed in the user interface with interactive timelines, highlighting service calls, durations, and potential errors. Users can customize views and generate reports for further analysis.
Key Architectural Highlights:
- Distributed Agents: Collect data directly from services, minimizing network overhead and reducing impact on performance.
- Scalable Collectors and Storage: Handles large volumes of traces efficiently, adapting to growing microservices architectures.
- Flexible Query Engine: Enables detailed analysis of trace data using various parameters and filters.
- User-friendly Visualization: Presents complex trace data in clear and actionable ways for easier understanding and troubleshooting.
Additional Layers:
- API Access: Integrate Jaeger with other tools and monitoring platforms for automated workflows and data exchange.
- Span Sampling: Reduce data volume by statistically sampling a subset of traces for analysis, balancing comprehensiveness with resource usage.
- Distributed Tracing Libraries: Libraries provided for various languages simplify instrumentation and trace context propagation within your code.
Benefits of this architecture:
- Efficient Data Collection: Minimizes impact on production systems while capturing comprehensive trace data.
- Scalability and Performance: Handles large-scale microservices environments with minimal latency and resource consumption.
- Flexible Analysis and Visualization: Empowers users to explore trace data in depth and discover hidden patterns or issues.
- Open-source and Extensible: Adapts to diverse needs and integrates with existing IT infrastructure.
How to Install Jaeger it?
Installing Jaeger can be tailored to your needs and environment. Here’s an outline of the different methods:
1. Binary Installation:
- Download pre-built binaries: Choose suitable binaries for your OS from the Jaeger releases page. https://github.com/jaegertracing/jaeger/releases
- Extract and configure: Extract the binaries and set up configuration files for agents, collectors, and the query service.
- Run services: Start the respective services (agent, collector, and query service) manually.
2. Dockerized Deployment:
- Pull Docker images: Use commands like
docker pull jaegertracing/all-in-oneto fetch pre-built Docker images. - Run container: Launch a container with the desired image, specifying environment variables for configuration.
- Access UI: Browse to the exposed port (default: 16686) to access the Jaeger web interface.
3. Kubernetes Deployment:
- Download YAML manifests: Utilize the provided YAML files for deploying Jaeger components as Kubernetes resources.
- Apply manifests: Execute
kubectl applycommands to deploy agents, collectors, and the query service on your Kubernetes cluster. - Access Jaeger: Use the service address within your cluster or service mesh to access the Jaeger UI.
4. Cloud Provider Deployments:
- Cloud-specific guides: Major cloud providers like AWS, Azure, and GCP offer deployment guides for Jaeger on their platforms.
- Follow instructions: These guides typically involve managing resources like VMs or serverless functions through the cloud provider’s console or CLI.
Additional Tips:
- Choose based on expertise: Binary installation offers more control but requires manual configuration. Docker and Kubernetes simplify deployments but have less flexibility.
- Start with All-in-One: Use the
all-in-oneimage or deployment option for initial evaluation and testing, later scaling based on your needs. - Community resources: Leverage the active Jaeger community forum for troubleshooting and advanced usage.
Always remember, the specific installation method depends on your needs and preferences. Don’t hesitate to ask if you need further assistance with any particular step or face any difficulties during the installation process.
Basic Tutorials of Jaeger: Getting Started

Getting started with Jaeger can be confusing due to its various components and installation options. Let’s break it down into basic tutorials, focusing on three main approaches:
1. Simple Local Setup with Docker:
a) Setup:
- Pull the All-in-One image:
docker pull jaegertracing/all-in-one - Run the image:
docker run -p 16686:16686 jaegertracing/all-in-one - Access Jaeger UI: http://localhost:16686
b) Tracing your application:
- Choose your programming language and install the Jaeger client library.
- Instrument your code to create Spans for operations/functions.
- Inject the trace context into outgoing requests.
- Run your application and observe traces in the Jaeger UI.
2. Installing Jaeger Components Individually:
a) Prerequisites:
- Familiarity with running services like collectors and agents.
- Choose a storage backend (Cassandra, Elasticsearch, MySQL).
b) Setup:
- Download and install Jaeger components (collector, agent, query).
- Configure each component with options like storage connection details.
- Start the Collector service.
- Start the Agent service with configuration pointing to the Collector.
- Run your instrumented application with agent configuration.
3. Using Jaeger with OpenTelemetry:
a) Setup:
- Install OpenTelemetry SDK in your application.
- Configure OpenTelemetry to use Jaeger exporter with Collector connection details.
- Instrument your application using OpenTelemetry APIs.
- Run your application and observe traces in the Jaeger UI.
Note: Choose the approach that best suits your environment and technical expertise. Start with the simple Docker setup and gradually progress to individual components or OpenTelemetry when comfortable.

Find Trusted Cardiac Hospitals
Compare heart hospitals by city and services — all in one place.
Explore Hospitals
Thanks for this clear and practical breakdown of Jaeger! I liked how the article not only explains what Jaeger is but also highlights real use cases — like distributed tracing to visualize request flows, identifying performance bottlenecks in microservices, and helping teams improve application observability. The real‑world examples really make it easier to understand why Jaeger is valuable for troubleshooting complex systems. Great job on making a technical topic feel understandable and actionable!