What is JProfiler?

JProfiler is a Java profiling tool developed by ej-technologies GmbH. It provides developers and performance engineers with a powerful set of features for analyzing and optimizing the performance of Java applications.
Top 10 use cases of JProfiler?
Some of the top use cases for JProfiler include:
- Performance Profiling: JProfiler allows developers to profile the performance of Java applications, including CPU usage, memory consumption, thread activity, and method execution times. This helps identify performance bottlenecks and areas for optimization.
- Memory Analysis: Developers can use JProfiler to analyze the memory usage of Java applications, including heap memory, garbage collection behavior, memory leaks, and object allocation patterns. This helps optimize memory usage and prevent memory-related issues.
- Thread Analysis: JProfiler provides insights into thread activity within Java applications, including thread states, thread synchronization, and thread contention. Developers can identify threading issues and optimize concurrency for better performance.
- Database Profiling: JProfiler includes features for profiling database interactions within Java applications, such as JDBC calls and database query execution times. This helps identify slow database queries and optimize database access for improved performance.
- Integration Testing: Developers can use JProfiler to profile Java applications during integration testing to identify performance issues under realistic usage scenarios. This helps ensure that applications meet performance requirements before deployment.
- Continuous Integration (CI): JProfiler can be integrated into CI/CD pipelines to automate performance testing as part of the software development lifecycle. This allows developers to detect performance regressions early in the development process.
- Memory Leak Detection: JProfiler includes tools for detecting memory leaks in Java applications by analyzing heap dumps and identifying objects that are not being garbage collected properly. This helps developers identify and fix memory leaks before they impact application stability.
- Application Tuning: Developers can use JProfiler to tune various aspects of Java applications, including JVM parameters, garbage collection settings, and thread pool configurations. This helps optimize application performance and resource utilization.
- Production Monitoring: JProfiler can be used for lightweight profiling and monitoring of Java applications in production environments. Developers can capture performance snapshots and analyze them offline to diagnose production issues.
- Distributed Profiling: JProfiler supports distributed profiling of Java applications running in clustered or distributed environments. Developers can profile multiple nodes simultaneously and analyze the performance of distributed systems.
JProfiler is a versatile tool for Java performance analysis and optimization, offering a wide range of features to help developers improve the performance and reliability of their Java applications.
What are the feature of JProfiler?
JProfiler offers a comprehensive set of features for Java performance analysis, profiling, and optimization. Here are some of its key features:
- CPU Profiling:
- Provides insights into CPU usage by profiling method execution times, call trees, and hot spots.
- Helps identify performance bottlenecks and optimize code for better CPU utilization.
- Memory Profiling:
- Analyzes memory usage, including heap memory, object allocations, and garbage collection behavior.
- Detects memory leaks and excessive memory consumption to optimize memory usage.
- Thread Profiling:
- Monitors thread activity, including thread states, synchronization, and contention.
- Helps optimize concurrency and identify threading issues in Java applications.
- Database Profiling:
- Profiles database interactions, such as JDBC calls and SQL query execution times.
- Identifies slow database queries and optimizes database access for improved performance.
- Java EE Profiling:
- Profiles Java EE components, including servlets, EJBs, and JMS messaging.
- Analyzes performance metrics for Java EE applications and identifies areas for optimization.
- Integration with IDEs:
- Integrates seamlessly with popular Java IDEs such as IntelliJ IDEA, Eclipse, and NetBeans.
- Provides a familiar development environment for profiling and optimizing Java applications.
- Heap Walker:
- Analyzes heap dumps to visualize object allocations, references, and memory usage.
- Helps detect memory leaks and optimize memory allocation in Java applications.
- Live Profiling:
- Profiles Java applications in real-time without requiring application restarts or code instrumentation.
- Allows developers to capture performance data and analyze it dynamically during runtime.
- Distributed Profiling:
- Profiles distributed Java applications running on multiple nodes or servers.
- Collects performance data from distributed systems and aggregates it for analysis.
- Performance Tuning:
- Provides recommendations and suggestions for optimizing JVM settings, garbage collection parameters, and thread configurations.
- Helps fine-tune Java applications for optimal performance and resource utilization.
- Continuous Integration Support:
- Integrates with CI/CD pipelines for automated performance testing during the software development lifecycle.
- Allows developers to detect performance regressions early and ensure application performance meets requirements.
- Remote Profiling:
- Profiles Java applications running on remote servers or virtual machines.
- Enables performance analysis of production applications without impacting production environments.
- Custom Probes:
- Allows developers to create custom probes to profile specific parts of their Java applications.
- Provides flexibility for profiling custom frameworks, libraries, or application components.
These features make JProfiler a powerful tool for Java developers and performance engineers, offering comprehensive insights and tools for optimizing the performance of Java applications.
How JProfiler works and Architecture?
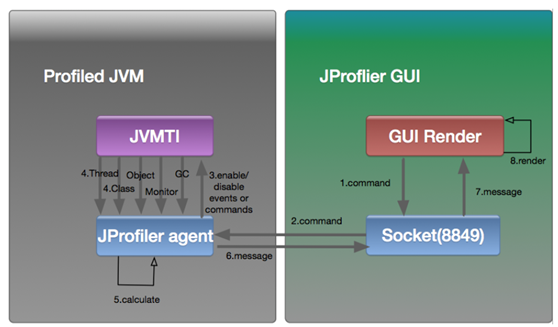
JProfiler works by attaching to Java applications and analyzing their runtime behavior to provide insights into performance bottlenecks, memory usage, and thread activity. Here’s an overview of how JProfiler works and its architecture:
- Agent-Based Profiling:
- JProfiler operates using an agent-based approach, where a lightweight agent is attached to the Java Virtual Machine (JVM) running the target application.
- The JProfiler agent injects bytecode instrumentation into the JVM to collect runtime data and metrics without modifying the application code.
- Integration with JVM:
- Upon startup, the JProfiler agent attaches to the JVM process hosting the Java application being profiled.
- It communicates with the JProfiler GUI (Graphical User Interface) client, allowing users to interactively monitor and analyze the application’s performance.
- Profiling Triggers:
- JProfiler allows users to define profiling triggers, such as CPU usage thresholds, memory allocations, or method invocations.
- When a trigger condition is met, the agent collects profiling data and sends it to the JProfiler client for analysis.
- Profiling Modes:
- JProfiler offers different profiling modes to capture various aspects of application behavior, including CPU profiling, memory profiling, thread profiling, and JDBC profiling.
- Users can configure profiling settings and select the desired profiling mode based on their analysis requirements.
- Data Collection:
- The JProfiler agent collects runtime data from the JVM, including method execution times, memory allocations, garbage collection events, thread states, and database interactions.
- Collected data is aggregated and transmitted to the JProfiler client for visualization and analysis.
- Visual Representation:
- The JProfiler client provides a visual interface for analyzing profiling data, including interactive charts, graphs, and tables.
- Users can navigate through the collected data, drill down into specific components, and identify performance bottlenecks and optimization opportunities.
- Heap Analysis:
- JProfiler includes a heap walker tool that analyzes heap dumps generated by the JVM.
- The heap walker visualizes object allocations, references, and memory usage patterns to identify memory leaks and optimize memory consumption.
- Live Profiling:
- JProfiler supports live profiling, allowing users to monitor and analyze Java applications in real-time.
- Live profiling enables dynamic analysis during application runtime without requiring restarts or code modifications.
- Remote Profiling:
- JProfiler can remotely profile Java applications running on remote servers or virtual machines.
- Remote profiling allows users to analyze performance data from distributed systems and aggregate it for analysis.
- Integration with IDEs:
- JProfiler integrates with popular Java IDEs such as IntelliJ IDEA, Eclipse, and NetBeans.
- Integration allows developers to profile and analyze Java applications directly within their development environments.
JProfiler’s architecture enables comprehensive profiling and analysis of Java applications, providing developers and performance engineers with valuable insights into application behavior and performance characteristics.
How to Install JProfiler it?
Now, Let’s explore how to install JProfiler, a powerful Java profiler:
- Windows Installation:
- Download the JProfiler executable installer for Windows from the official website.
- Run the installer (
jprofiler_windows-x64.exe). - Follow the installation wizard:
- Select the installation directory.
- Accept the license agreement.
- Configure additional options if needed.
- Complete the installation.
- Linux/Unix Installation:
- Download the JProfiler installer for Linux/Unix from the official website.
- Open a terminal.
- Make the installer executable (if needed):
chmod +x jprofiler_linux-x64.sh - Run the installer:
./jprofiler_linux-x64.sh - Follow the installation prompts.
- macOS Installation:
- Download the JProfiler DMG archive for macOS from the official website.
- Mount the DMG archive by double-clicking on it in Finder.
- Pull the JProfiler application bundle to the
/Applicationsfolder.
- Start JProfiler:
- Execute
bin/jprofilerin the extracted directory (Linux/Unix) or open the application from/Applications(macOS).
- Execute
- Remote Profiling:
- For remote profiling, you only need the profiling agent on the remote side.
- Use the remote integration wizards in the JProfiler GUI to create a minimal package with the profiling agent.
- Distribute the profiling agent to remote machines for troubleshooting.
Basic Tutorials of JProfiler: Getting Started
Now, Here’s a basic step-by-step tutorial to help you get started with JProfiler:
- Installation:
- Download and install JProfiler from the official website.
- Follow the installation instructions given for your operating system.
- Launching JProfiler:
- Start JProfiler by executing the appropriate launcher for your platform.
- Upon launching, you’ll be presented with options to start a new profiling session or open an existing one.
- Creating a New Profiling Session:
- Click on “New Session” to create a new profiling session.
- Choose the type of application you want to profile (e.g., local application, remote application, Java EE server).
- Configure the profiling settings based on your requirements (e.g., profiling mode, JVM parameters).
- Starting the Profiling Session:
- After configuring the session settings, click on the “Start” button to begin profiling.
- If you’re profiling a local application, you may need to select the Java process you want to profile from a list.
- Profiling Views:
- Once the profiling session starts, you’ll see various profiling views in the JProfiler interface.
- Explore the different views, such as CPU profiling, memory profiling, thread profiling, and JDBC profiling.
- CPU Profiling:
- In the CPU profiling view, you’ll see method call trees, hot spots, and thread activity.
- Identify CPU-intensive methods and performance bottlenecks by analyzing the method call tree and hot spot lists.
- Memory Profiling:
- Switch to the memory profiling view to analyze memory usage, object allocations, and garbage collection behavior.
- Use the heap walker tool to analyze heap dumps and identify memory leaks and excessive memory consumption.
- Thread Profiling:
- Explore the thread profiling view to monitor thread activity, synchronization, and contention.
- Identify threading issues and optimize concurrency by analyzing thread states and lock contention.
- JDBC Profiling:
- If your application interacts with databases, use the JDBC profiling view to analyze database queries and connection usage.
- Identify slow database queries and optimize database access for improved performance.
- Analyzing Results:
- Analyze the profiling results and identify performance bottlenecks, memory leaks, and other optimization opportunities.
- Use the visualizations and reports provided by JProfiler to gain insights into your application’s behavior and performance characteristics.
- Stopping the Profiling Session:
- Once you’ve finished analyzing the application, stop the profiling session by clicking on the “Stop” button.
- Review the profiling results and save the session for future reference if needed.
- Integration with IDEs:
- Optionally, integrate JProfiler with your preferred Java IDE (e.g., IntelliJ IDEA, Eclipse) for seamless profiling directly within your development environment.
By following these steps, you’ll be able to start profiling your Java applications with JProfiler and analyze their performance characteristics effectively. As you become more familiar with the tool, explore advanced features and optimization techniques to further enhance your application’s performance.

Find Trusted Cardiac Hospitals
Compare heart hospitals by city and services — all in one place.
Explore Hospitals