What is Matplotlib?
Matplotlib is a comprehensive 2D plotting library for the Python programming language. It is widely used for creating static, animated, and interactive visualizations in Python. Matplotlib was developed by John D. Hunter and is now maintained by a huge team of developers.
What is top use cases of Matplotlib?
Top Use Cases of Matplotlib:
- Data Visualization:
- Matplotlib is extensively used for visualizing data in various formats, including line plots, scatter plots, bar charts, histograms, and more. It is a go-to tool for creating static visualizations of datasets.
- Scientific Plotting:
- In scientific computing and research, Matplotlib is commonly used to plot experimental results, mathematical functions, and scientific data. It is a key tool for researchers and scientists in various fields.
- Statistical Data Analysis:
- Matplotlib is integrated with libraries like NumPy and Pandas for statistical data analysis. Users can create informative and visually appealing plots to explore and communicate data insights.
- Machine Learning and Data Science:
- Matplotlib is employed in machine learning and data science projects to visualize model performance, data distributions, and various metrics. It helps analysts and data scientists understand the behavior of models and datasets.
- Time Series Analysis:
- Time series data, common in finance, economics, and other domains, can be effectively visualized using Matplotlib. It supports the creation of line plots and candlestick charts for time-dependent data.
- Geospatial Data Visualization:
- Matplotlib can be used to create maps and visualize geospatial data. Its toolkit,
basemap, provides functionality for plotting on geographic maps, making it useful for tasks related to geography and mapping.
- Matplotlib can be used to create maps and visualize geospatial data. Its toolkit,
- Image Processing and Computer Vision:
- Matplotlib is utilized for displaying and analyzing images in fields such as computer vision. It can visualize image data, including pixel values, histograms, and overlays.
- Custom Plots and Visualization:
- Matplotlib is highly customizable, allowing users to create a wide range of custom plots and visualizations. This flexibility makes it suitable for addressing diverse visualization requirements.
- Publication-Quality Plots:
- Matplotlib is capable of creating publication-quality plots with fine-grained control over details like font sizes, colors, and annotations. It is commonly used for generating figures for academic papers and publications.
- Interactive Data Exploration:
- Matplotlib can be integrated with interactive backends like Jupyter Notebooks to support real-time data exploration. This is particularly useful for interactive analysis and presentations.
- Dashboard Development:
- Matplotlib can be part of dashboard development, where dynamic and interactive visualizations are incorporated into web-based dashboards for data monitoring and reporting.
- Educational Use:
- Matplotlib is widely used in educational settings for teaching data visualization and programming. Its ease of use and extensive documentation make it accessible for learners.
- Quality Control and Process Monitoring:
- In manufacturing and industry, Matplotlib can be applied for quality control and process monitoring. Plots and charts help visualize trends and identify anomalies in production data.
- Financial Data Visualization:
- Financial analysts use Matplotlib to create various charts such as candlestick charts, line charts, and bar charts for visualizing stock prices, market trends, and financial indicators.
- Network Visualization:
- Matplotlib can be used for visualizing network structures, graphs, and connectivity. It supports the creation of graphs and charts to represent relationships and connections in network data.
Matplotlib’s versatility, ease of use, and extensive community support make it a popular choice for a wide range of data visualization tasks across different domains and industries.
What are feature of Matplotlib?
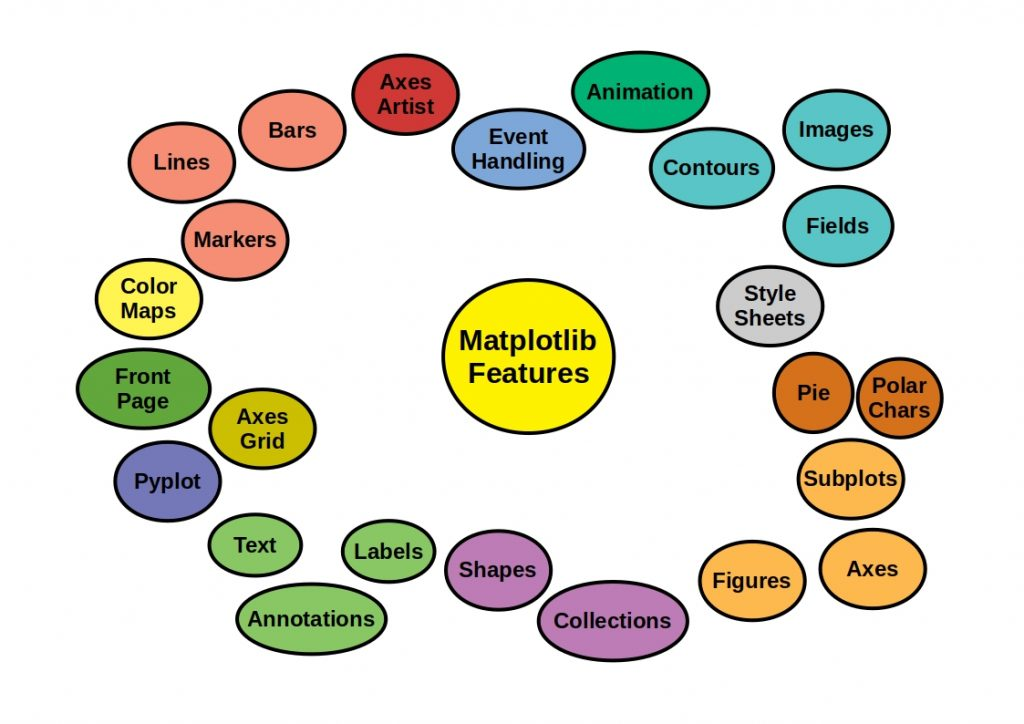
Features of Matplotlib:
- Wide Range of Plot Types:
- Matplotlib supports a variety of plot types, including line plots, scatter plots, bar charts, histograms, pie charts, 3D plots, and more.
- Highly Customizable:
- Plots and visualizations created with Matplotlib are highly customizable. Users have fine-grained control over details such as colors, line styles, markers, labels, and annotations.
- Publication-Quality Plots:
- Matplotlib is designed to produce publication-quality plots suitable for inclusion in academic papers, presentations, and reports. The resulting visualizations can be exported to various file formats, including PNG, PDF, SVG, and more.
- Support for LaTeX:
- Matplotlib supports LaTeX for mathematical expressions and text rendering, allowing users to include complex mathematical notation in their plots.
- Extensive Toolkit:
- Matplotlib includes toolkits and modules that extend its functionality, such as the
mplot3dtoolkit for 3D plotting, thebasemaptoolkit for geographic mapping, and theanimationmodule for creating animated plots.
- Matplotlib includes toolkits and modules that extend its functionality, such as the
- Integration with NumPy:
- Matplotlib seamlessly integrates with NumPy, allowing users to plot NumPy arrays directly. This is particularly useful in scientific computing and data analysis.
- Interactivity:
- Matplotlib can be used interactively within Jupyter Notebooks, providing a dynamic environment for data exploration and analysis.
- Backend Support:
- Matplotlib supports multiple backends, including the default Agg backend for creating raster graphics, and other backends such as TkAgg, GTKAgg, Qt5Agg, and more. This flexibility allows users to choose the appropriate backend for their needs.
- Animation Support:
- The
animationmodule in Matplotlib enables the creation of animated plots, allowing users to visualize changes and trends over time.
- The
- Seamless Integration with Pandas:
- Matplotlib integrates well with Pandas, a popular data manipulation library in Python. Pandas DataFrames can be directly plotted using Matplotlib.
- Extensive Documentation:
- Matplotlib has thorough documentation, including tutorials, examples, and a gallery showcasing various types of plots. This makes it accessible to both beginners and experienced users.
- Community and Ecosystem:
- Matplotlib has a large and active community, contributing to ongoing development and support. The library is part of the broader Python ecosystem for data science and scientific computing.
What is the workflow of Matplotlib?
The typical workflow for creating visualizations with Matplotlib involves the following steps:
- Import Matplotlib:
- Import the Matplotlib library in your Python script or Jupyter Notebook using the
import matplotlib.pyplot as pltstatement.
- Import the Matplotlib library in your Python script or Jupyter Notebook using the
- Create Data:
- Define or import the data you want to visualize. This could be NumPy arrays, Pandas DataFrames, or other Python data structures.
- Create a Figure and Axes:
- Use the
plt.figure()function to create a figure and theplt.subplots()function to create one or more axes (subplots) within the figure. The axes serve as the containers for your plots.
- Use the
- Plot Data:
- Use plotting functions such as
plot(),scatter(),bar(), etc., to plot your data on the axes.
- Use plotting functions such as
- Customize Plots:
- Customize your plots by adjusting attributes like colors, markers, labels, titles, and axis limits. Matplotlib gives a wide range of customization options.
- Add Annotations and Legends:
- Use functions like
annotate()andlegend()to add annotations, text, and legends to your plots.
- Use functions like
- Save or Display:
- Save your plots using
plt.savefig()if needed, or display them in the interactive mode if you are using Jupyter Notebooks.
- Save your plots using
- Show the Plot:
- Use
plt.show()to display the plot. This step may be optional in Jupyter Notebooks.
- Use
- Explore Further:
- Explore additional features such as creating multiple subplots, adding colorbars, using LaTeX for text, and exploring advanced plotting options based on your requirements.
- Iterate and Refine:
- Iterate on your plot, refine it based on feedback or analysis, and make adjustments to improve its clarity and effectiveness.
This workflow provides a structured approach to creating a wide range of visualizations using Matplotlib. The library’s flexibility allows users to adapt the workflow to their specific needs and the nature of the data being visualized.
How Matplotlib Works & Architecture?
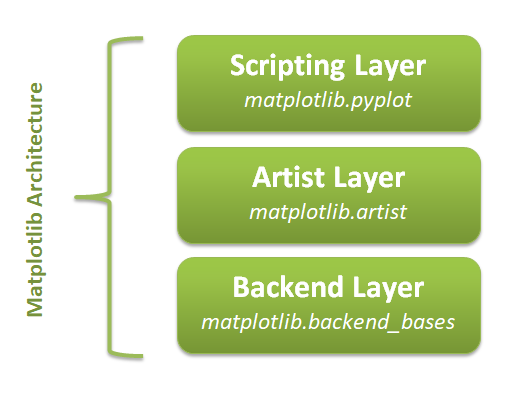
Matplotlib is a powerful and versatile Python library for creating 2D visualizations of data. Its architecture consists of three main layers:
1. Backend Layer:
- FigureCanvas: Imagine this as the canvas you draw on. It provides the surface where the figure is drawn and interacts with the operating system’s drawing toolkit.
- Renderer: This acts like the artist who translates data into graphical elements on the canvas. It knows how to draw different elements like lines, bars, and text based on the backend toolkit’s capabilities.
- Event: This layer handles user interaction with the plot, such as mouse clicks and keystrokes.
2. Artist Layer:
- This is the core of Matplotlib where the actual visualization elements reside. Everything in a Matplotlib plot is an “Artist” object, including axes, labels, lines, and even the figure itself.
- Artists are organized in a hierarchical structure:
- Composite Artists: These are containers that hold other artists, like the
FigureandAxes. - Primitive Artists: These are the basic building blocks of a plot, like
Line2D,Rectangle, andText.
- Composite Artists: These are containers that hold other artists, like the
3. Scripting Layer:
- This layer provides a simpler and more concise way to interact with Matplotlib, especially for quick exploration and prototyping.
- The most common interface in this layer is
matplotlib.pyplot, which offers functions for creating figures, plotting data, adding labels, and customizing the plot appearance.
Understanding this architecture helps you leverage Matplotlib’s full potential:
- Fine-grained control: The Artist layer gives you complete control over every aspect of the plot, allowing for highly customized visualizations.
- Flexibility: The scripting layer makes it easy to create basic plots and explore data quickly.
- Backend independence: Matplotlib can work with different drawing toolkits on various platforms, ensuring portability.
Overall, Matplotlib’s layered architecture provides a powerful and flexible foundation for creating stunning and informative data visualizations in Python.
How to Install and Configure Matplotlib?
Here’s a guide on installing and configuring Matplotlib:
1. Check for Existing Installation:
- Open a terminal or command prompt and type: Bash
python -c "import matplotlib; print(matplotlib.__version__)" - If it’s installed, you’ll see the version. If not, proceed to installation.
2. Installation Methods:
A. Using pip (Recommended):
- Open a terminal or command prompt and type: Bash
pip install matplotlib
B. Using a Package Manager (Linux):
- For Ubuntu/Debian: Bash
sudo apt-get install python3-matplotlib - For Fedora/Red Hat: Bash
sudo dnf install python3-matplotlib - For Arch Linux: Bash
sudo pacman -S python-matplotlib
C. Using Anaconda/Miniconda:
- Open a terminal or Anaconda prompt and type: Bash
conda install matplotlib
3. Verification:
- Open a Python interpreter and type: Python
import matplotlib print(matplotlib.__version__) - If it runs without errors, Matplotlib is installed correctly.
4. Configuring the Backend (Optional):
- Matplotlib can use different backends for rendering plots. The default might not be the best for your needs.
- To check the current backend: Python
import matplotlib print(matplotlib.get_backend()) - To set a different backend: Python
import matplotlib matplotlib.use('TkAgg') # Example for TkAgg backend - Common backends include:
- TkAgg (default for Python’s Tkinter)
- Qt5Agg (for Qt5)
- Agg (for PNG and other file formats, no interactive window)
5. Additional Dependencies (Optional):
- For features like LaTeX rendering, saving animations, and more file formats: Bash
pip install -U pillow # For image processing pip install -U numpy # For numerical computations pip install -U scipy # For advanced scientific computing
Now you’re ready to create stunning visualizations with Matplotlib!
Fundamental Tutorials of Matplotlib: Getting started Step by Step
Let’s have a look at some step-by-step fundamental tutorials to get you started with Matplotlib:
1. Importing Matplotlib:
Python
import matplotlib.pyplot as plt
Code language: JavaScript (javascript)
2. Creating a Simple Line Plot:
Python
x = [1, 2, 3, 4, 5]
y = [3, 5, 7, 1, 4]

plt.plot(x, y)
plt.show()  # Display the plot
Code language: PHP (php)
3. Adding Labels and Title:
Python
plt.plot(x, y)
plt.xlabel("X-axis")
plt.ylabel("Y-axis")
plt.title("Line Plot Example")
plt.show()
Code language: CSS (css)
4. Customizing Line Style and Color:
Python
plt.plot(x, y, color='red', linestyle='dashed', linewidth=2)
plt.show()
Code language: JavaScript (javascript)
5. Creating Scatter Plots:
Python
plt.scatter(x, y)
plt.show()
Code language: CSS (css)
6. Creating Bar Charts:
Python
plt.bar(x, y)
plt.show()
Code language: CSS (css)
7. Creating Histograms:
Python
plt.hist(y)
plt.show()
Code language: CSS (css)
8. Saving Plots to Files:
Python
plt.plot(x, y)
plt.savefig('my_plot.png')
Code language: JavaScript (javascript)
9. Adding Multiple Plots in One Figure:
Python
plt.subplot(1, 2, 1)  # Create subplot 1 in a 1x2 grid
plt.plot(x, y)

plt.subplot(1, 2, 2)  # Create subplot 2 in the same grid
plt.scatter(x, y)

plt.show()
Code language: CSS (css)
10. Customizing Plot Appearance (Optional):
- Adjust axes limits:
plt.xlim(0, 6),plt.ylim(0, 8) - Add gridlines:
plt.grid(True) - Set tick frequency:
plt.xticks(range(0, 6)) - Set labels and title font sizes:
plt.xlabel("X-axis", fontsize=12) - And more!
Notes:
- Explore Matplotlib’s documentation for more advanced features and customization options.
- Practice regularly to master the library’s capabilities.
- Experiment with different plot types and visual styles to find what best suits your data and storytelling goals.

Find Trusted Cardiac Hospitals
Compare heart hospitals by city and services — all in one place.
Explore Hospitals