What is Microsoft Power BI?
Microsoft Power BI is a business analytics service and toolset that enables users to visualize data, share insights, and make informed decisions. It allows users to connect to various data sources, transform and model data, create interactive reports and dashboards, and collaborate with others. Power BI is known for its integration with other Microsoft products and services, making it a popular choice for organizations using the Microsoft ecosystem.
Top 10 use cases of Microsoft Power BI:
Here are the top 10 use cases of Microsoft Power BI:
- Data Visualization: Power BI provides a wide range of visualization options, including charts, graphs, maps, and more. Users can create interactive and visually appealing representations of their data.
- Business Reporting: Users can build interactive reports that showcase key performance indicators (KPIs), financial metrics, and operational insights. Reports can be customized to fit specific business needs.
- Dashboard Creation: Power BI allows users to create interactive dashboards that consolidate visualizations and reports in one place. Dashboards help decision-makers quickly understand the state of their business.
- Data Exploration: With Power BI, users can explore data by drilling down, filtering, and interacting with visualizations. This enables discovering insights and identifying trends within datasets.
- Real-Time Analytics: Power BI supports real-time data streaming, enabling users to monitor and analyze data as it’s generated. This is useful for tracking live events or operational data.
- Self-Service BI: Power BI empowers business users to create their own reports and visualizations without relying on IT departments. This promotes data-driven decision-making throughout the organization.
- Data Collaboration: Power BI allows users to share reports and dashboards with colleagues and stakeholders. Collaboration features enable commenting, annotations, and discussions within the tool.
- Embedded Analytics: Power BI reports and dashboards can be embedded into other applications, websites, or portals, allowing users to access insights within familiar contexts.
- Predictive Analytics: While not as advanced as dedicated machine learning platforms, Power BI supports some predictive analytics capabilities. Users can create forecasts and perform basic predictive modeling.
- Sales and Marketing Analysis: Power BI can be used to analyze sales data, track customer behavior, evaluate marketing campaigns, and gain insights into customer preferences and trends.
These use cases demonstrate Power BI’s versatility across various industries and scenarios. Its integration with other Microsoft products like Excel, SharePoint, and Teams further enhances its capabilities, making it a valuable tool for organizations looking to transform data into actionable insights.
What are the feature of Microsoft Power BI?
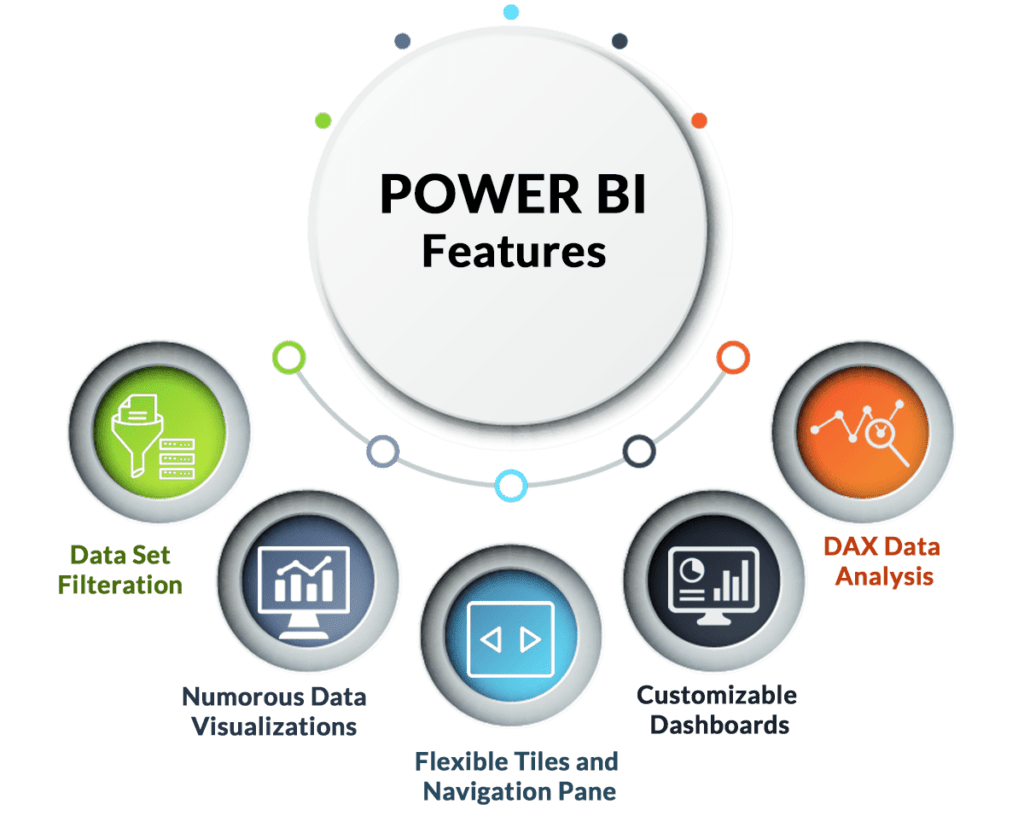
Microsoft Power BI offers a robust set of features that enable users to transform data into meaningful insights and interactive visualizations. Here are some of the main features of Power BI:
- Data Connectivity: Power BI allows you to connect to a wide range of data sources, including databases, spreadsheets, cloud services, APIs, and more. It supports both on-premises and cloud-based data sources.
- Data Transformation and Modeling: Power BI provides data transformation capabilities, allowing users to clean, reshape, and combine data using the Power Query Editor. The Data Modeling view enables defining relationships between tables and creating calculated columns and measures.
- Data Visualization: Power BI offers a variety of visualization options, such as charts, graphs, maps, and tables. Users can customize colors, styles, and formatting to create visually appealing reports and dashboards.
- Interactive Reports and Dashboards: Users can create interactive reports and dashboards by dragging and dropping visualizations onto a canvas. Interactivity includes filtering, highlighting, drill-down, and cross-filtering.
- Natural Language Queries: Power BI supports natural language queries, allowing users to ask questions about their data in plain language and receive relevant visualizations as answers.
- Quick Insights: The Quick Insights feature automatically analyzes data and generates visualizations to reveal potential patterns, trends, and outliers.
- Data Sharing and Collaboration: Power BI supports sharing reports and dashboards with colleagues, stakeholders, and clients. Users can collaborate on datasets and reports in real time.
- Mobile Accessibility: Reports and dashboards created in Power BI are responsive and can be accessed on various devices through dedicated mobile apps.
- Power BI Service: Power BI offers a cloud-based service where you can publish, share, and collaborate on reports and dashboards. It also provides capabilities for automatic data refresh and scheduled report delivery.
- Power BI Embedded: Organizations can embed Power BI reports and dashboards directly into their applications, portals, and websites to provide data insights to their users.
- Custom Visuals: Power BI allows developers to create custom visualizations using the Power BI developer tools. These custom visuals can be added to reports and dashboards.
- Advanced Analytics Integration: Power BI integrates with Azure Machine Learning and other analytics services, enabling users to perform advanced analytics and predictive modeling.
How Microsoft Power BI works and Architecture?
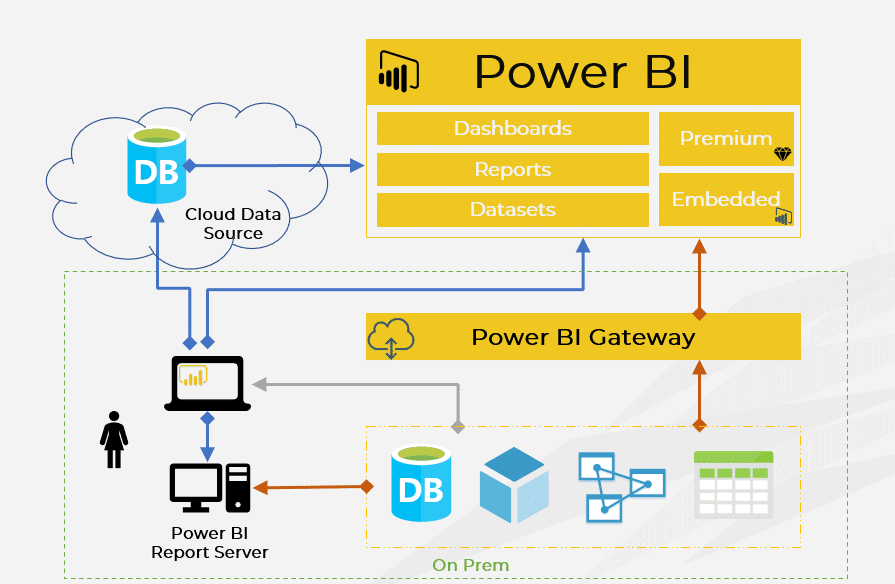
Power BI operates within a comprehensive architecture that encompasses various components and services. Here’s an overview of its architecture:
- Data Sources: Power BI can connect to various data sources, both on-premises and in the cloud, through data connectors.
- Power Query: Power Query is used for data transformation and loading. It can extract, transform, and load data from different sources into the Power BI model.
- Data Model: The Power BI data model consists of tables, relationships, calculated columns, and measures. The model is created and managed in Power BI Desktop.
- Power BI Desktop: Power BI Desktop is a desktop application where users design and build reports and dashboards. It includes a data modeling component, visualization canvas, and report layout area.
- Power BI Service: The Power BI Service is a cloud-based platform for publishing, sharing, and collaborating on reports and dashboards. It allows users to view and interact with reports through web browsers and mobile apps.
- Data Refresh: The Power BI Service supports automatic data refresh, ensuring that reports and dashboards display the most up-to-date information.
- Gateways: Gateways enable secure and efficient data transfer between on-premises data sources and the cloud-based Power BI Service. They ensure data consistency and security.
- Power BI Mobile Apps: Power BI mobile apps allow users to access and interact with reports and dashboards on smartphones and tablets.
- Power BI Embedded: This feature allows organizations to embed Power BI reports and dashboards within their applications, extending the reach of data insights.
- Azure Integration: Power BI can integrate with Azure services, including Azure Machine Learning and Azure SQL Database, to enable advanced analytics and machine learning capabilities.
The architecture of Power BI is designed to provide a seamless flow of data from various sources to interactive visualizations accessible through both desktop and cloud-based interfaces.
How to Install Microsoft Power BI?
There are two ways to install Microsoft Power BI:
- Using the Microsoft Power BI Desktop installer:
- Go to the Microsoft Power BI website and download the Microsoft Power BI Desktop installer for your operating system.
- Run the installer and apply the live-screen instructions.
- Using the Microsoft Power BI service:
- Go to the Microsoft Power BI website and sign in with your Microsoft account.
- Click Get started.
- Follow the on-screen instructions to create a Power BI workspace.
- Once you have created a workspace, you can start creating reports and dashboards.
Once you have installed Microsoft Power BI, you can start creating reports and dashboards.
Here are the detailed steps on how to install Microsoft Power BI using the Microsoft Power BI Desktop installer:
- Go to the Microsoft Power BI website and download the Microsoft Power BI Desktop installer for your operating system.
- Run the installer and apply the live-screen instructions.
- On the first screen, accept the terms of the license agreement and click Next.
- On the second screen, select the installation options that you want and click Next.
- On the third screen, select the folder where you want to install Power BI and click Install.
- The installer will start installing Power BI. This may take a few minutes.
- Once the installation is complete, click Finish.
Once you have installed Power BI Desktop, you can start creating reports and dashboards.
Here are the detailed steps on how to install Microsoft Power BI using the Microsoft Power BI service:
- Go to the Microsoft Power BI website and sign in with your Microsoft account.
- Click Get started.
- Follow the on-screen instructions to create a Power BI workspace.
- Once you have created a workspace, you can start creating reports and dashboards.
Once you have created a workspace, you can start creating reports and dashboards. Reports are visualizations of data that you can create using Power BI. Dashboards are collections of reports that you can use to monitor your data.
Basic Tutorials of Microsoft Power BI: Getting Started
Sure, here are some stepwise basic tutorials of Microsoft Power BI:
- Step 1: Install Power BI Desktop: You can download the Power BI Desktop installer from the Microsoft Power BI website. Once you have downloaded the installer, run it and follow the on-screen instructions to install Power BI Desktop.
- Step 2: Connect to a Data Source: Once you have installed Power BI Desktop, you can connect to different data sources. Some of the data sources that you can connect to include:
- Microsoft Excel spreadsheets
- Microsoft SQL Server databases
- Cloud-based data sources such as Azure Data Lake Storage and Amazon Redshift
- Additionally, Power BI supports enterprise Power BI connectors, which enable seamless integration with a wide range of enterprise applications and data platforms, enhancing analytics capabilities across the organization.
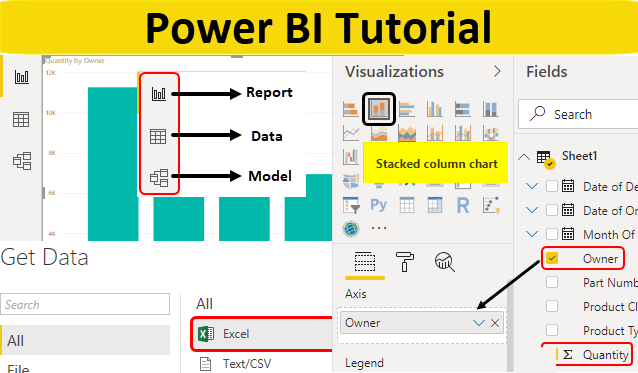
- Step 3: Create a Report: Once you have connected to a data source, you can start creating a report. A report is a visualization of your data. You can create different types of visualizations in Power BI, such as:
- Bar charts
- Line charts
- Pie charts
- Maps
- Step 4: Create a Dashboard: A dashboard is a collection of reports that you can use to monitor your data. You can create different dashboards for different purposes, such as:
- A dashboard for tracking sales performance
- A dashboard for monitoring customer satisfaction
- A dashboard for tracking inventory levels
- Step 5: Share Your Report or Dashboard: Once you have created a report or dashboard, you can share it with others. You can share your report or dashboard by:
- Exporting it to a file format such as PDF or Excel
- Publishing it to the Power BI service
- Sending it to others via email

👤 About the Author
Ashwani is passionate about DevOps, DevSecOps, SRE, MLOps, and AiOps, with a strong drive to simplify and scale modern IT operations. Through continuous learning and sharing, Ashwani helps organizations and engineers adopt best practices for automation, security, reliability, and AI-driven operations.
🌐 Connect & Follow:
- Website: WizBrand.com
- Facebook: facebook.com/DevOpsSchool
- X (Twitter): x.com/DevOpsSchools
- LinkedIn: linkedin.com/company/devopsschool
- YouTube: youtube.com/@TheDevOpsSchool
- Instagram: instagram.com/devopsschool
- Quora: devopsschool.quora.com
- Email– contact@devopsschool.com
Find Trusted Cardiac Hospitals
Compare heart hospitals by city and services — all in one place.
Explore Hospitals