What is Nagios?

Nagios is an open-source monitoring and alerting system that is widely used for tracking the health and performance of IT infrastructure, networks, and applications. Nagios provides a flexible and extensible platform for monitoring various components within an organization.
Top 10 use cases of Nagios?
Here are ten common use cases for Nagios:
- Server Monitoring:
- Monitor the health and performance of servers, including CPU usage, memory utilization, disk space, and system load.
- Set up alerts for critical conditions and potential issues.
- Network Monitoring:
- Monitor network devices such as routers, switches, and firewalls for availability and performance.
- Track network traffic, bandwidth usage, and detect network anomalies.
- Service Availability:
- Ensure the availability of critical services and applications.
- Monitor web servers, databases, email servers, and other services to detect and respond to outages.
- Resource Utilization:
- Track resource utilization metrics to identify trends and potential bottlenecks.
- Monitor the usage of CPU, memory, disk I/O, and other resources on monitored systems.
- Performance Metrics and Trend Analysis:
- Collect performance metrics over time to analyze trends and forecast potential issues.
- Use historical data for capacity planning and optimization.
- Log File Monitoring:
- Monitor log files for specific events, errors, or patterns.
- Set up alerts based on log file entries to identify issues in real-time.
- Alerting and Notification:
- Set up alerts to notify administrators or support teams when predefined thresholds are breached.
- Configure notification methods such as email, SMS, or integration with ticketing systems.
- Application Monitoring:
- Monitor the performance and availability of custom applications.
- Integrate Nagios with plugins or agents to collect application-specific metrics.
- Security Monitoring:
- Monitor security-related events and log entries to detect potential security threats.
- Integrate Nagios with security information and event management (SIEM) solutions.
- Environmental Monitoring:
- Monitor environmental conditions such as temperature, humidity, and power supply in data centers or server rooms.
- Set up alerts for environmental conditions that may impact hardware reliability.
- Database Monitoring:
- Monitor database servers for performance metrics, query execution times, and overall database health.
- Ensure the availability and responsiveness of database services.
- Cloud Infrastructure Monitoring:
- Extend Nagios to monitor cloud-based infrastructure in platforms like AWS, Azure, or Google Cloud.
- Monitor virtual machines, storage, and other cloud services.
Nagios is highly extensible and can be customized to meet specific monitoring requirements. Its core functionality can be enhanced with plugins, extensions, and integrations with other tools and services. Nagios has been a foundational tool in the field of IT monitoring for many years and continues to be widely used in various industries.
What are the feature of Nagios?
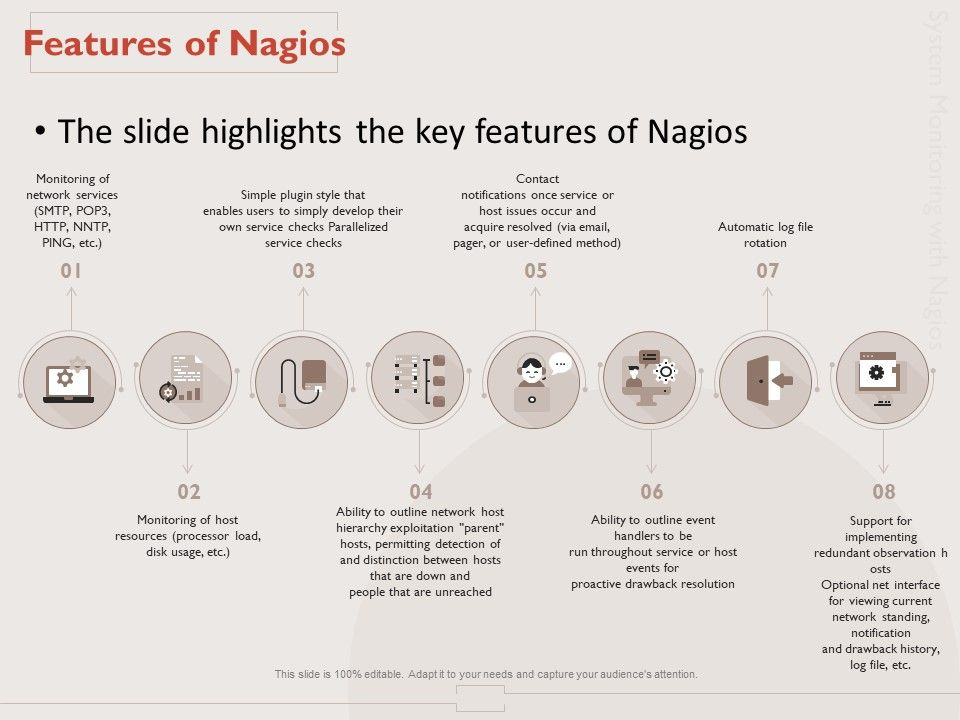
Nagios boasts a powerful set of features designed to help you monitor your IT infrastructure and ensure consistent uptime and performance. Here are some highlights:
Monitoring Capabilities:
- Extensive coverage: Monitor network devices, servers, applications, services, and more.
- Scalability: Manage thousands of IT components across your network with ease.
- Flexibility: Define custom checks and plugins to monitor specific metrics and applications.
- Multiple platforms: Supports Linux, Windows, macOS, and various server platforms.
Alerting and Reporting:
- Proactive notifications: Receive immediate alerts via email, SMS, or other channels when issues arise.
- Escalation: Configure escalating alerts to ensure critical notifications reach the right people.
- Reporting and logs: Generate comprehensive reports and analyze historic data to identify trends and optimize performance.
- Visualization: View your monitoring data in real-time through dashboards and graphs.
Other Key Features:
- High availability: Achieve redundancy and prevent single points of failure with clustering and failover options.
- Security: Secure your monitoring environment with authentication, authorization, and encryption features.
- Community and support: Extensive community resources and paid support options are available.
- Plugins and extensions: Extend Nagios functionality with the vast plugin ecosystem for various applications and services.
Benefits of using Nagios:
- Reduced downtime: Proactive monitoring helps prevent outages and minimize recovery time.
- Improved performance: Optimize your infrastructure based on data insights and identify bottlenecks.
- Enhanced decision-making: Gain visibility into your IT health and make informed decisions about resource allocation and maintenance.
- Cost savings: Prevent costly downtime and optimize IT resource usage.
Whether you’re managing a small network or a large data center, Nagios offers a comprehensive suite of features to ensure the smooth operation of your IT infrastructure.
How Nagios works and Architecture?
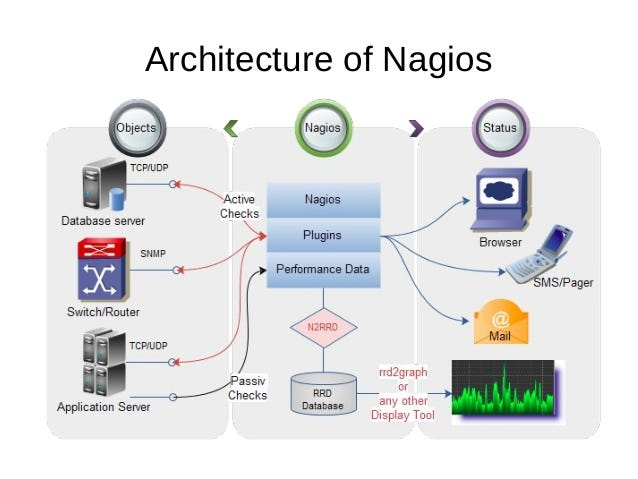
Nagios boasts a powerful set of features designed to help you monitor your IT infrastructure and ensure consistent uptime and performance. Here are some highlights:
Monitoring Capabilities:
- Extensive coverage: Monitor network devices, servers, applications, services, and more.
- Scalability: Manage thousands of IT components across your network with ease.
- Flexibility: Define custom checks and plugins to monitor specific metrics and applications.
- Multiple platforms: Supports Linux, Windows, macOS, and various server platforms.
Alerting and Reporting:
- Proactive notifications: Receive immediate alerts via email, SMS, or other channels when issues arise.
- Escalation: Configure escalating alerts to ensure critical notifications reach the right people.
- Reporting and logs: Generate comprehensive reports and analyze historic data to identify trends and optimize performance.
- Visualization: View your monitoring data in real-time through dashboards and graphs.
Other Key Features:
- High availability: Achieve redundancy and prevent single points of failure with clustering and failover options.
- Security: Secure your monitoring environment with authentication, authorization, and encryption features.
- Community and support: Extensive community resources and paid support options are available.
- Plugins and extensions: Extend Nagios functionality with the vast plugin ecosystem for various applications and services.
Benefits of using Nagios:
- Reduced downtime: Proactive monitoring helps prevent outages and minimize recovery time.
- Improved performance: Optimize your infrastructure based on data insights and identify bottlenecks.
- Enhanced decision-making: Gain visibility into your IT health and make informed decisions about resource allocation and maintenance.
- Cost savings: Prevent costly downtime and optimize IT resource usage.
Whether you’re managing a small network or a large data center, Nagios offers a comprehensive suite of features to ensure the smooth operation of your IT infrastructure.
How to Install Nagios it?
Installing Nagios can be done through different methods based on your preference and environment. Here’s a breakdown of the options:
1. Package Manager:
This is the easiest method for most Linux distributions. Here’s an example for Ubuntu:
- Add the Nagios repository:
sudo apt-get install -y apt-transport-https software-properties-common wget - Add the GPG key:
wget -q -O - https://packages.nagios.com/gpg.key | sudo apt-key add - - Add the repository:
echo "deb https://packages.nagios.com/ubuntu focal main" | sudo tee -a /etc/apt/sources.list.d/nagios.list - Update package lists:
sudo apt-get update - Install Nagios:
sudo apt-get install nagios
Remember to adjust the commands and repository URL based on your specific OS and version.
2. Binary Download:
Download the pre-built binary for your OS from the Nagios website. Extract the contents and apply the installation instructions provided in the official site.
3. Docker:
Deploy Nagios as a container using Docker. This method offers a lightweight and portable approach. Refer to the official Docker Hub page for Nagios for detailed instructions.
4. Source Code Compilation:
For advanced users, you can download the Nagios source code and compile it yourself. This provides the most customization options but requires more technical expertise.
Common Post-Installation Steps:
- Configure the
nagios.cfgfile: This file defines your monitoring environment, checks, contacts, and notification settings. - Install required plugins: Download and install the necessary plugins for the components you want to monitor.
- Start the Nagios server: Use your system’s service manager to start the Nagios daemon.
- Access the web interface: Open
http://localhost:8080in your web browser and log in with the default credentials (admin:admin).
Remember to adjust the configuration and settings based on your specific needs and monitoring requirements. Consider consulting the community forums or paid support options if you encounter any difficulties during installation or configuration.
Basic Tutorials of Nagios: Getting Started
Ready to unleash Nagios’ monitoring power? This guide will walk you through essential steps to get started:
1. Installation:
Choose your desired method:
- Package Manager: Easiest for Linux users. Refer to the previous answer for specific commands based on your distribution.
- Binary Download: Download the pre-built binary and follow the included instructions.
- Docker: Deploy Nagios as a container using Docker Hub.
2. Configuration:
- Configure
nagios.cfg: Edit this file to define your monitoring environment, checks, contacts, and notification settings. - Install Plugins: Download and install plugins for the specific systems and applications you want to monitor. Examples include ping (for server uptime), http (for website availability), etc.
3. Basic Checks:
- Ping Check: Define a ping check in the
cfgfile to monitor server or device uptime. For instance:
define service {
    host         localhost
    service_name       ping
    check_command       ping!localhost
}
- HTTP Check: Monitor website availability:
define service {
    host         www.example.com
    service_name       http
    check_command       check_http -H www.example.com
}
4. Starting and Accessing:
- Start the Nagios server using your system’s service manager (e.g.,
sudo systemctl start nagios). - Access the web interface at
http://localhost:8080(default port). Login with the default credentials (admin:admin).
5. Exploring the Interface:
- Navigation: The interface includes menus for “Hosts,” “Services,” “Alerts,” “Reports,” and more.
- Hosts: View the status of all monitored systems and individual checks.
- Services: Drill down into specific services like ping or HTTP checks for detailed information and metrics.
- Alerts: See ongoing alerts and their details, including triggered notifications.
- Reports: Generate reports for historical data analysis and performance insights.
6. Learning and Expanding:
- Community Resources: Utilize online forums and community guides for support and knowledge sharing.
- Plugins: Explore the vast plugin ecosystem to monitor diverse aspects of your infrastructure.
Note: This is a basic introduction. As you gain confidence, delve deeper into features like scheduled checks, escalations, advanced notifications, and custom plugin development to tailor Nagios to your specific monitoring needs.
Happy monitoring!
Tips:
- Start with a small set of monitored systems and services to get comfortable with the basics.
- Pay attention to notification thresholds and customize them to avoid receiving too many alerts for minor issues.
- Regularly update Nagios and plugins to ensure you have the latest fixes and features.
With dedication and exploration, you’ll master Nagios and gain valuable insights into the health and performance of your IT infrastructure.

Find Trusted Cardiac Hospitals
Compare heart hospitals by city and services — all in one place.
Explore Hospitals
This blog gives a clear and easy explanation of Nagios and its important use cases. I like how it explains monitoring of servers, networks, and applications along with alerting features. It’s very helpful for understanding how Nagios improves system performance and reduces downtime in IT environments.