What is New Relic?
New Relic is a leading observability platform designed to help you monitor, analyze, and optimize your software systems. It goes beyond traditional monitoring by providing a holistic view of your entire infrastructure, from code to customer experience, in real-time.
Here’s a breakdown of its key features:
- Full-Stack Observability: Monitor any data source, including metrics, traces, logs, and events, regardless of where it originates.
- AI-powered Insights: Get proactive alerts and actionable recommendations based on your data analysis.
- Unified Data Platform: Analyze all your data in one place with a single unified data platform.
- Developer-friendly Tools: Debug code faster with code-level insights and integrated profiling tools.
- Collaboration Features: Share dashboards and insights with your team to work together effectively.
Top 10 use cases of New Relic?
Top 10 Use Cases of New Relic:
- Performance Monitoring: Track key metrics like response times, throughput, and resource utilization to identify and resolve performance bottlenecks.
- Application Debugging: Quickly pinpoint the root cause of errors and exceptions in your code.
- Incident Response: Respond quickly to outages and critical issues with real-time alerts and detailed visualizations.
- Continuous Integration and Delivery (CI/CD): Monitor deployments and rollbacks to ensure smooth software updates.
- Infrastructure Monitoring: Get visibility into the health and performance of your servers, network, and other infrastructure components.
- Log Analysis: Analyze application logs to detect errors, security threats, and compliance issues.
- Cloud-native Monitoring: Gain insights into the performance and health of applications running in the cloud.
- Cost Optimization: Monitor resource usage and optimize your cloud spend based on your actual needs.
- Digital Customer Experience (DX) Monitoring: Understand how users interact with your applications and identify areas for improvement.
- Security Monitoring: Detect potential security threats and investigate suspicious activity across your systems.
New Relic helps organizations of all sizes improve the performance, reliability, and scalability of their software systems. It empowers developers, operations teams, and business leaders to make data-driven decisions and deliver exceptional user experiences.
What are the feature of New Relic?
New Relic boasts a rich suite of features designed to provide comprehensive observability across your entire software stack. Here are some key highlights:
Full-Stack Observability:
- Application Performance Monitoring (APM): Monitor application performance across every layer, from frontend to backend, with deep code-level insights.
- Infrastructure Monitoring: Gain visibility into the health and performance of your servers, network, containers, and cloud resources.
- Log Management: Ingest and analyze logs from any source to identify errors, security threats, and operational issues.
- Real User Monitoring (RUM): Track real user experience (UX) metrics like page load times, errors, and user journeys to ensure optimal performance.
AI-powered Insights:
- Applied Intelligence (NRAI): Leverage machine learning and AI to gain automated insights, anomaly detection, and proactive recommendations.
- Predictive Analytics: Identify potential issues before they occur and proactively take preventive measures.
- Root Cause Analysis: Use AI-powered tools to quickly pinpoint the source of performance problems and errors.
Unified Data Platform:
- New Relic One: Ingest, explore, and analyze all your data, including metrics, traces, logs, and events, in one central location.
- Flexible Querying: Use intuitive dashboards and custom queries to explore your data from any angle and gain actionable insights.
- Integrations: Integrate New Relic with your existing tools and workflows for seamless data exchange and collaboration.
Developer-friendly Tools:
- Code-level Insights: Debug code faster with profiling tools, error tracking, and distributed tracing.
- Developer Workflows: Integrate New Relic into your development process for better monitoring, testing, and troubleshooting.
- API and SDKs: Access New Relic data and functionality through robust APIs and SDKs for custom integrations.
Collaboration Features:
- Shared Dashboards: Share visual dashboards and reports with your team for real-time visibility and collaborative problem-solving.
- Alerts and Notifications: Set up custom alerts to notify relevant individuals about critical issues or performance anomalies.
- Team Insights: Foster collaborative understanding of system health and performance through shared data and insights.
Additional Features:
- Scalability and flexibility: New Relic scales horizontally to handle growing data volumes and diverse infrastructure.
- Security and compliance: New Relic adheres to strict security standards and data privacy regulations.
- Open source adoption: New Relic supports open-source technologies and offers integrations with various open-source tools.
These features make New Relic a powerful tool for teams of all sizes to:
- Monitor and troubleshoot performance issues efficiently.
- Gain deep insights into the health and behavior of their systems.
- Improve development processes and deliver high-quality software.
- Optimize resource utilization and costs.
- Provide excellent user experiences and ensure business continuity.
How New Relic works and Architecture?
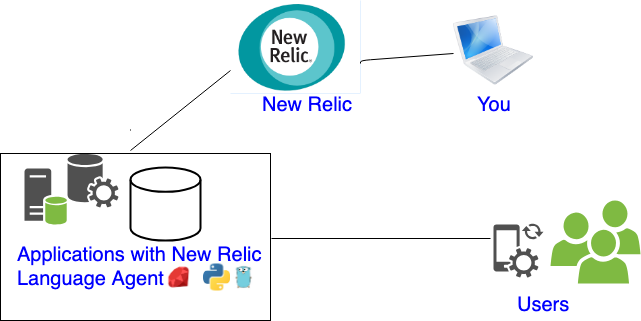
New Relic’s power lies in its distributed architecture, designed to handle massive data volumes from diverse sources with high performance and flexibility. Here’s a breakdown of its key components:
Data Ingestion:
- Data sources: Applications, infrastructure components, logs, and other sources push data to New Relic via agents or integrations.
- Collectors: Regional “Collector” nodes receive data, perform initial processing, and route it to the appropriate destination.
- Normalization and pre-aggregation: Data is normalized for consistency and pre-aggregated for faster analysis.
- Storage: Processed data is distributed across a geographically distributed cluster of nodes for redundancy and scalability.
Data Analysis and Querying:
- Query engine: Users submit queries through the New Relic One platform interface or APIs.
- Distributed query execution: The query engine analyzes the data location and distributes the workload to relevant storage nodes.
- Parallel processing: Each node processes the query on its local data shard, leveraging pre-processing for efficiency.
- Aggregated results: Partial results from each node are combined and returned to the user in real-time.
Key Architectural Highlights:
- Distributed Collectors: Handle high-volume data ingestion efficiently from various sources worldwide.
- Geo-distributed storage: Ensures high availability and redundancy even if regional outages occur.
- Pre-processed data: Minimizes processing overhead during query execution, providing faster response times.
- Parallel query execution: Leverages the power of multiple nodes for rapid data analysis.
Benefits of this architecture:
- Highly scalable: Can handle massive data volumes without performance degradation.
- Fast queries: Responds to complex queries in milliseconds, ideal for real-time analysis.
- Fault-tolerant: Distributed design ensures high availability and resilience even if nodes fail.
- Cost-effective: Efficient data storage and processing optimizes resource utilization.
Additional layers:
- Applied Intelligence (NRAI): This layer utilizes machine learning and AI algorithms to analyze data, discover anomalies, and provide proactive insights.
- Integration platform: New Relic integrates with various tools and platforms to provide a unified view of your entire technology ecosystem.
How to Install New Relic it?
Installing New Relic depends on how you want to monitor your systems and what resources you have available. Here are several options:
1. Guided Install:
This is the easiest and most recommended method for beginners. New Relic provides a platform-specific guided install process that automatically installs the necessary agents and configures them for basic monitoring.
- New Relic One: Visit New Relic One and click “Get Started.” Select your data center and apply the on-screen instructions.
- Specific Agents: For specific agents like APM or Infrastructure, navigate to the agent page within New Relic One and launch the guided install for your platform (Linux, Windows, etc.).
2. Manual Installation:
This method offers more control over the configuration but requires manual setup of agents and configuration files.
- Download agent: Download the appropriate agent installer for your platform and system type from the New Relic website.
- Install agent: Follow the provided installation instructions for your platform.
- Configure agent: Edit the agent configuration file to specify your New Relic license key and other settings.
- Verify installation: Once installed, start the agent and verify it’s connected to New Relic by logging into New Relic One.
3. Docker Deployment:
For a containerized environment, you can deploy New Relic agents as Docker containers.
- Pull container image: Use the
docker pullcommand to pull the relevant New Relic agent image for your platform. - Run container: Run the image with required options, including your New Relic license key and environment variables.
- Verify installation: Verify the container is running and connected to New Relic by logging into New Relic One.
Remember to choose the installation method that suits your experience, technical skills, and environment. If you encounter any difficulties during installation, refer to the provided resources or reach out to New Relic support for assistance.
Basic Tutorials of New Relic: Getting Started
New Relic offers a powerful platform for monitoring and analyzing your applications and infrastructure. Ready to take your first steps? Let’s explore some basic tutorials to unlock its potential:
1. Set Up Your Account:
- Head to the New Relic official site and create a free account.
- You’ll receive an API key, crucial for connecting your environment to New Relic.
2. Install an APM Agent:
- Choose the appropriate agent for your application’s technology (e.g., Java, Node.js, PHP).
- Follow the provided instructions to install and configure the agent, providing your API key for connection.
3. Explore Your Application Performance:
- After the agent collects data, navigate to the APM section in New Relic.
- You’ll see dashboards visualizing key metrics like response times, errors, and resource utilization.
- Drill down into specific transactions and code traces to pinpoint performance bottlenecks.
4. Monitor Infrastructure with Infrastructure Agent:
- Install the Infrastructure Agent on your servers and systems.
- This agent collects metrics like CPU, memory, disk usage, and network traffic.
- Access the Infrastructure section to view dashboards and analyze these metrics for resource utilization and potential issues.
5. Set Up Alerts and Notifications:
- Define custom alerts based on specific thresholds for your application and infrastructure metrics.
- Choose how you want to receive notifications, such as email, SMS, or integrations with other tools.
- Receive timely alerts for potential problems, allowing proactive troubleshooting.
Note:
- Start small by monitoring a single application or server initially.
- Customize dashboards and alerts to focus on your critical metrics.
- Leverage New Relic’s resources and community to enhance your monitoring and observability capabilities.
Bonus Tutorial: Try Quickstarts:
- New Relic offers pre-built dashboards, alerts, and configurations for specific technologies and use cases.
- Explore the Quickstarts library to find one relevant to your application or infrastructure.
- Implement a Quickstart in minutes to experience New Relic’s power and get a head start on monitoring your environment.
With these basic tutorials and a spirit of exploration, you’ll be well on your way to optimizing your applications and infrastructure with New Relic. Remember, this is just the beginning! Have fun learning and monitoring your systems with New Relic!

Find Trusted Cardiac Hospitals
Compare heart hospitals by city and services — all in one place.
Explore Hospitals