What is OpenTelemetry?
OpenTelemetry is an open-source framework that provides a vendor-neutral and unified way to collect and export telemetry data (metrics, traces, and logs) from your applications and infrastructure. It aims to eliminate the need for multiple, specific tooling solutions for each type of data, simplifying observability across complex IT environments.
Think of OpenTelemetry as a standardized language for your applications and instruments to speak with various monitoring tools and platforms. It offers several key benefits:
- Vendor neutrality: Works with diverse monitoring tools and platforms, promoting flexibility and future-proofing.
- Unified data collection: Standardizes data collection and export, removing data silos and offering holistic insights.
- Simplified instrumentation: Provides consistent APIs for integrating telemetry collection into your applications.
- Reduced complexity: Eliminates the need for managing multiple, disparate tools, streamlining your observability workflow.
Top 10 use cases of OpenTelemetry?
Top 10 Use Cases of OpenTelemetry:
- Monitoring application performance: Track response times, errors, resource utilization, and other metrics across your distributed applications.
- Troubleshooting and debugging: Identify bottlenecks, root causes of errors, and performance issues using trace data.
- Understanding user experience: Analyze how users interact with your applications and identify areas for improvement.
- Optimizing resource utilization: Gain insights into resource usage across your infrastructure and optimize costs.
- Securing your systems: Monitor security events, detect anomalies, and investigate potential threats.
- Compliance reporting: Collect and aggregate data for regulatory compliance requirements.
- Improving development workflows: Analyze code performance, identify regressions, and facilitate better decision-making.
- Building custom dashboards and visualizations: Combine different types of telemetry data (metrics, traces, logs) for comprehensive insights.
- Integrating with existing tools: OpenTelemetry seamlessly integrates with popular monitoring platforms and observability tools.
- Future-proofing your observability strategy: OpenTelemetry’s vendor-neutral approach ensures adaptability and compatibility with future monitoring solutions.
By mastering OpenTelemetry, you can unlock a powerful and flexible approach to observability, gaining deeper insights into your applications and infrastructure and making data-driven decisions for continuous improvement.
Whether you’re a developer, an operations team member, or simply someone interested in understanding application performance, OpenTelemetry is worth exploring. Its versatility and ease of integration make it a valuable tool for building a robust and insightful observability strategy.
What are the feature of OpenTelemetry?
OpenTelemetry boasts a rich set of features that elevate your observability experience. Here are some key highlights:
Data Types:
- Metrics: Collect and export quantitative data points like CPU usage, request latency, and memory consumption.
- Traces: Record the flow of requests through your distributed systems, pinpointing performance bottlenecks and error sources.
- Logs: Capture text-based events and messages for richer context and debugging information.
Vendor Neutrality:
- OpenTelemetry integrates seamlessly with various monitoring and observability platforms like Prometheus, Jaeger, Grafana, and ELK Stack.
- This flexibility empowers you to choose the tools that best suit your needs without being locked into specific vendor ecosystems.
Unified Data Collection:
- OpenTelemetry provides consistent APIs for instrumenting your applications and automatically exporting data in a standardized format.
- This eliminates the need for managing multiple, disparate agent solutions and offers a holistic view of your telemetry data.
Simplified Instrumentation:
- OpenTelemetry offers language-specific SDKs and libraries for popular programming languages and frameworks.
- These libraries provide ready-made instrumentation options, reducing the complexity of integrating telemetry collection into your codebase.
Extensible and Customizable:
- OpenTelemetry allows you to extend its capabilities by writing custom exporters and propagators.
- This enables integration with specialized monitoring tools or customization of how data is exported and handled.
Resource Management:
- OpenTelemetry provides sampling strategies to manage the volume of trace data, especially for large production environments.
- This ensures efficient data collection without overwhelming your monitoring systems.
Community-Driven:
- OpenTelemetry is an open-source project backed by a vibrant community of developers and monitoring tool vendors.
- This ongoing collaboration ensures continuous improvement, feature additions, and long-term support for the framework.
Beyond Basic Features:
- OpenTelemetry supports semantic conventions, a standardized naming scheme for telemetry data, making it easier to interpret and analyze across different tools.
- It also integrates with context propagation protocols like W3C Trace Context, facilitating trace propagation across diverse application boundaries.
By leveraging these features, OpenTelemetry empowers you to build a comprehensive and adaptable observability strategy for your applications and infrastructure. Its flexibility, vendor neutrality, and ease of use make it a valuable tool for gaining deeper insights and optimizing your IT environment for performance, efficiency, and reliability.
How OpenTelemetry works and Architecture?
OpenTelemetry’s working principle and architecture can be divided into distinct stages:
1. Instrumentation:
- Developers integrate OpenTelemetry SDKs (libraries) into their applications and services.
- These SDKs provide APIs for:
- Defining signals (metrics, traces, logs) to collect.
- Adding context and attributes to signals for rich insights.
- Exporting signals in the OpenTelemetry data format.
2. Data Collection:
- OpenTelemetry agents receive exported signals from instrumented applications.
- Agents can be:
- Local: Runs alongside the application on the same system.
- Remote: Deployed on a dedicated server to collect data from multiple applications.
- Agents apply sampling strategies to manage data volume in large environments.
3. Data Processing:
- Collected signals are processed by the OpenTelemetry Collector:
- Signals are converted to the internal Protocol Buffer format for efficient data storage and transmission.
- Data can be enriched with additional context or transformed before export.
4. Data Export:
- The Collector pushes processed data to chosen backend destinations:
- Observability tools like Prometheus, Jaeger, and Grafana.
- Cloud monitoring platforms like Azure Monitor, AWS CloudWatch, and Google Cloud Monitoring.
- Custom backends using OpenTelemetry exporters.
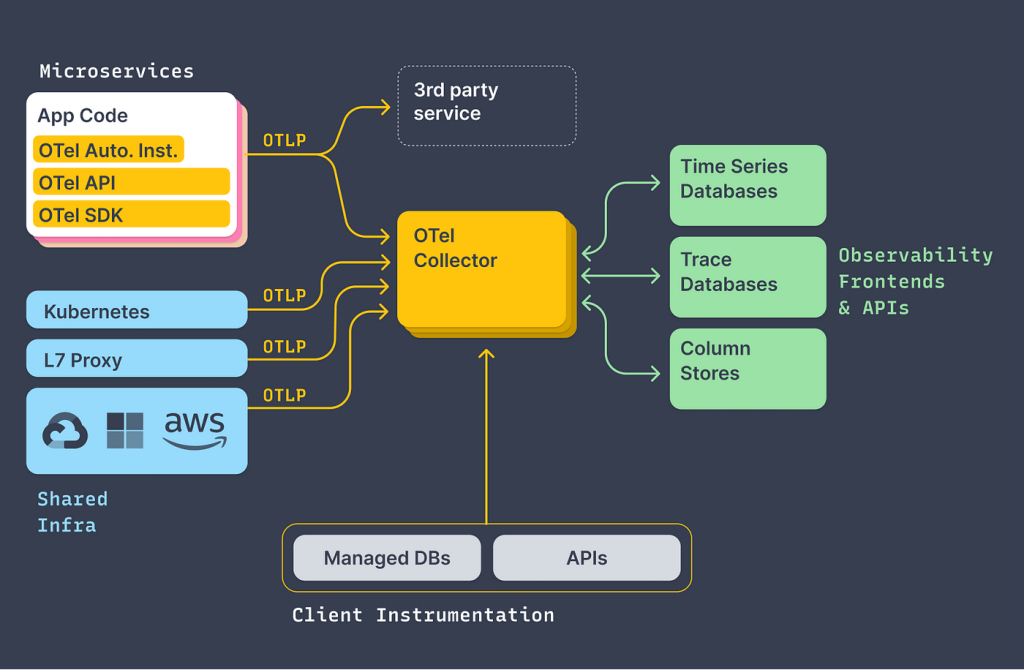
OpenTelemetry Architecture:
- Signals: Represent the data collected, categorized into metrics, traces, and logs.
- SDKs: Language-specific libraries for adding instrumentation to applications.
- Agents: Gather data from local or remote instrumented applications and apply sampling strategies.
- Collector: Central component for processing, enriching, and exporting data to various destinations.
- Exporters: Plugins for sending data to specific monitoring tools or custom backends.
Key Takeaways:
- OpenTelemetry provides a standardized approach for collecting and exporting telemetry data.
- SDKs simplify instrumentation, while agents and the Collector manage data efficiently.
- Exporters offer flexibility to integrate with diverse monitoring tools or custom platforms.
This architecture allows for:
- Vendor neutrality: OpenTelemetry data can be used with various monitoring tools.
- Unified data collection: Provides a consistent way to gather metrics, traces, and logs.
- Scalability: Agents and the Collector can handle large data volumes in distributed environments.
Note: OpenTelemetry is young and under continuous development. Its architecture and features might evolve over time, but the core principles of vendor neutrality and unified data collection remain central to its mission.
How to Install OpenTelemetry it?
Installing OpenTelemetry can be done in various ways, depending on your desired approach and environment. Here are some options:
1. Installing the Collector:
- Manual Downloads: Download pre-built binaries for Linux, macOS, Windows, or ARM platforms from the OpenTelemetry official website.
- Package Managers: Use system package managers (e.g.,
apt,yum) if available for your platform. - Docker Images: Pull official Docker images (
otel/opentelemetry-collector) for easy deployment in containerized environments.
2. Installing Instrumentation SDKs:
- OpenTelemetry provides language-specific SDKs for popular programming languages and frameworks (e.g., Python, Java, Node.js, Go).
- Choose the relevant SDK for your application programming language and follow the installation instructions from the javadoc.io official site.
3. Additional Options:
- Distributions: Use pre-packaged distributions like OpenTelemetry Distro that bundle the Collector and popular SDKs for simplified installation and configuration.
- Cloud Providers: Some cloud providers offer managed OpenTelemetry services for easy integration with their platform.
Choosing the Right Method:
- Local Development: Manual downloads or package managers are ideal for quick testing and local development setups.
- Production Environments: Docker images or cloud services offer greater scalability and manageability for larger deployments.
- Specific needs: Consider specialized distributions or custom configurations for specific monitoring tools or integrations.
Tip:
- Adjust configuration files to specify data export destinations and any desired customizations.
- Start small by instrumenting a single component and gradually expand your monitoring scope as needed.
Basic Tutorials of OpenTelemetry: Getting Started
OpenTelemetry can be daunting at first, but we can break it down into bite-sized tutorials to get you started:
1. Hello World Example:
a) Choose your language:
- Start with a language you’re comfortable with, like Node.js, Go, Java, or Python.
- Each language has official OpenTelemetry SDKs and examples.
b) Set up a basic application:
- Create a simple application (e.g., HTTP server) with basic functionality.
- Ensure it functions before adding instrumentation.
c) Add OpenTelemetry dependencies:
- Install the relevant OpenTelemetry SDK and any language-specific instrumentation libraries.
- Refer to the official documentation for your chosen language and SDK.
d) Initialize the SDK:
- Configure the SDK with exporter details (e.g., Jaeger, Prometheus) and other settings.
- Create a trace provider and exporter based on your chosen backend.
e) Instrument your application:
- Add tracing calls at key points in your code, typically before and after operations.
- Use language-specific APIs to create spans and add attributes/events.
f) Run your application and check traces:
- Start your application and observe traces in your chosen exporter’s UI (e.g., Jaeger, Prometheus).
- Verify that Spans are created for your instrumented sections and visualize the call flow.
2. Monitoring Metrics:
a) Add a meter provider:
- After tracing setup, configure a meter provider for instrumentation metrics.
- Choose a relevant exporter (e.g., Prometheus) for metric data collection.
b) Create and use meters:
- Define meters for specific metrics you want to collect (e.g., HTTP request count).
- Use meter APIs to record measurements within your instrumented code.
c) Observe collected metrics:
- Verify that metrics are exported and view them in your chosen exporter’s dashboard.
3. Custom Instrumentation:
a) Understand context propagation:
- Learn how trace context is propagated between services/processes using headers or custom formats.
b) Instrument external calls:
- Use context injection/extraction APIs to propagate trace context in outgoing requests.
- Consider libraries/frameworks for automatic instrumentation when available.
c) Instrument background tasks:
- Use context propagation mechanisms to associate background tasks with existing traces.
- Consider asynchronous context propagation libraries for easier handling.
Always remember, these are just basic introductory steps. Each step can be further explored and customized based on your specific needs and application complexity.

Find Trusted Cardiac Hospitals
Compare heart hospitals by city and services — all in one place.
Explore Hospitals
Thanks for this clear and practical guide on OpenTelemetry! I really liked how you explained not just what it is — a unified observability framework — but also the real use cases like distributed tracing, metrics collection, and improving visibility across microservices. The examples made it easy to understand how OpenTelemetry helps teams troubleshoot performance issues and get consistent telemetry data across platforms. Great job making a technical topic feel accessible and useful!