What is Pandas?

Pandas is a data manipulation and analysis open-source library for the Python programming language. It provides data structures for efficiently storing and manipulating large datasets and tools for working with structured data, such as spreadsheets or SQL tables. Pandas is widely used in data science, machine learning, and other domains where data analysis and manipulation are key tasks.
Key Features of Pandas:
- DataFrame: The primary data structure in Pandas is the DataFrame, a two-dimensional table with labeled axes (rows and columns). It can hold heterogeneous data types and is similar to a spreadsheet or SQL table.
- Series: An array that can hold any data type is a one-dimensional labeled array. Series are the building blocks of a DataFrame.
- Data Cleaning and Transformation: Pandas provides functions and methods for cleaning and transforming data, including handling missing values, reshaping datasets, and applying functions to data.
- Data Alignment: Data alignment is a powerful feature of Pandas. Operations automatically align on the labels of the objects, which makes it easy to work with datasets that need to be combined or merged.
- Handling Missing Data: Pandas provides methods for detecting, removing, and filling missing data. This is crucial in real-world datasets where missing values are common.
- GroupBy: Pandas supports the “split-apply-combine” paradigm through the GroupBy functionality. It allows you to split a DataFrame into groups, apply a function to each group independently, and then combine the results.
- Merging and Joining: Pandas supports various methods for combining datasets through merging and joining operations. It’s specifically useful for combining data from different sources.
- Time Series Data: Pandas includes functionality for handling time series data, making it easy to work with dates and time-related operations.
What is top use cases of Pandas?
- Data Cleaning and Preprocessing:
- Handling missing values.
- Removing duplicates.
- Transforming data types.
- Replacing values.
- Exploratory Data Analysis (EDA):
- Descriptive statistics.
- Data visualization (integrated with Matplotlib and Seaborn).
- Distribution analysis.
- Data Wrangling:
- Merging and joining datasets.
- Reshaping and pivoting data.
- Grouping and aggregating data.
- Time Series Analysis:
- Handling time series data.
- Resampling and frequency conversion.
- Date shifting and lagging.
- Statistical Analysis:
- Hypothesis testing.
- Correlation and covariance analysis.
- Regression analysis.
- Machine Learning Data Preparation:
- Feature engineering.
- Data normalization and scaling.
- One-hot encoding and categorical variable handling.
- Data Import and Export:
- Reading and writing data in various formats (CSV, Excel, SQL, HDF5, JSON, etc.).
- Connecting to databases.
- Web Scraping:
- Extracting data from websites.
- Cleaning and transforming web data.
- Social Media Analytics:
- Analyzing and visualizing social media data.
- Extracting insights from social media platforms.
- Finance and Economics:
- Analyzing financial data.
- Working with stock prices and time series data.
- Portfolio analysis.
- Biology and Bioinformatics:
- Analyzing biological datasets.
- Genomic data analysis.
Pandas is an essential tool for data scientists, analysts, and engineers working with Python for data manipulation and analysis tasks. Its intuitive and expressive API makes it a go-to library for various data-related challenges.
What are feature of Pandas?
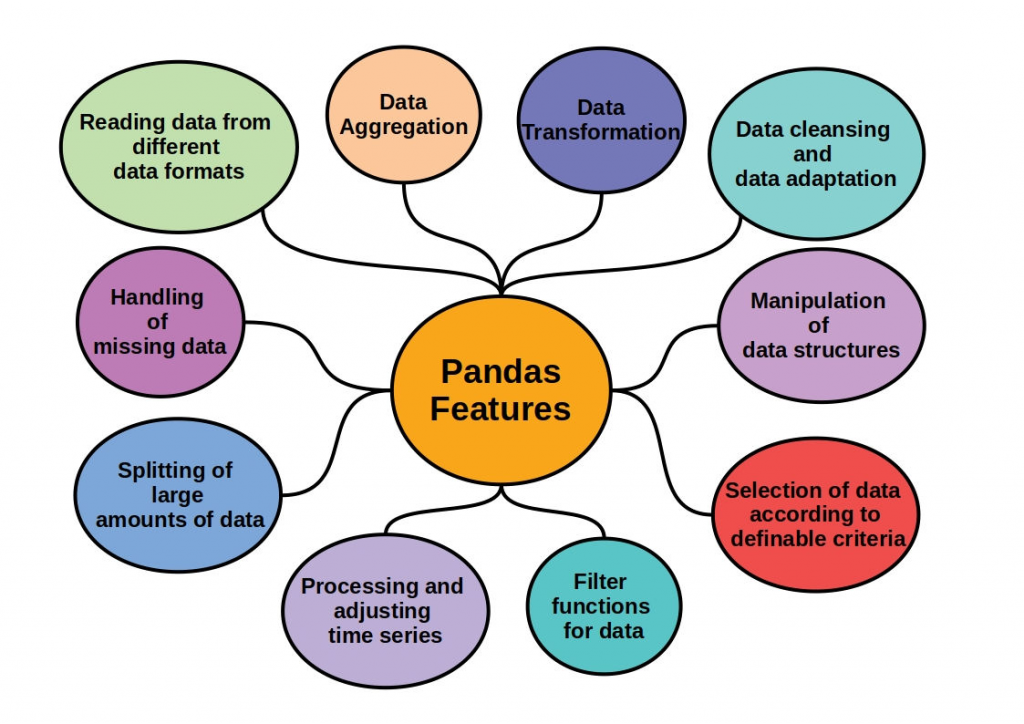
Features of Pandas:
- DataFrame and Series:
- Pandas introduces two main data structures: DataFrame and Series. A DataFrame is a two-dimensional table, and a Series is a one-dimensional labeled array. These structures are made on top of NumPy arrays.
- Data Alignment:
- Operations between DataFrame and Series automatically align the data based on labels, simplifying data manipulations.
- Missing Data Handling:
- Pandas provides methods for handling missing data, such as dropping or filling missing values. This is crucial for real-world datasets.
- GroupBy:
- The GroupBy functionality allows grouping data based on specific criteria and performing operations on each group. This is useful for data aggregation and analysis.
- Merging and Joining:
- Pandas supports merging and joining data from different sources. This is essential for combining datasets with a common key.
- Data Input/Output:
- Pandas favors reading and writing data in various formats, including CSV, SQL databases, Excel, JSON, and more.
- Data Filtering and Selection:
- Pandas provides powerful tools for filtering and selecting data based on conditions. This includes boolean indexing and query methods.
- Multi-level Indexing:
- Pandas supports multi-level indexing, allowing users to create complex hierarchical index structures for better organization of data.
- Reshaping and Pivoting:
- Pandas provides tools for reshaping and pivoting data, making it easy to transform datasets into different structures.
- Time Series Functionality:
- Pandas includes robust time series functionality, allowing users to work with time-based data and perform operations on time indices.
- Statistical and Mathematical Operations:
- Pandas provides a wide range of statistical and mathematical functions for analyzing data. This includes descriptive statistics, correlation, and regression.
- Plotting and Visualization:
- Pandas integrates with Matplotlib for data visualization. It provides convenient methods for creating plots directly from DataFrame and Series objects.
- Integration with Other Libraries:
- Pandas integrates well with other data science libraries such as NumPy, Scikit-learn, and Seaborn, providing a comprehensive ecosystem for data analysis.
- Memory Efficiency:
- Pandas is designed for memory efficiency and can handle large datasets efficiently. It optimizes memory usage through various data structures and algorithms.
What is the workflow of Pandas?
Following is a workflow of Pandas:
- Import Pandas:
- Import the Pandas library into your Python script or Jupyter notebook.
import pandas as pdCode language: JavaScript (javascript)- Load Data:
- Read data from external sources using Pandas functions such as
pd.read_csv(),pd.read_excel(), or others.
df = pd.read_csv('your_data.csv')Code language: JavaScript (javascript)- Explore the Data:
- Use various methods to explore the dataset, including
head(),info(), anddescribe().
   print(df.head())
   print(df.info())
print(df.describe())Code language: CSS (css)- Data Cleaning:
- Handle missing data using methods like
dropna()orfillna(). Remove duplicates usingdrop_duplicates().
   df.dropna(inplace=True)
df.drop_duplicates(inplace=True)Code language: PHP (php)- Data Selection and Filtering:
- Select columns or rows using square bracket notation or methods like
loc[]andiloc[]. Filter data based on conditions.
   selected_columns = df[['column1', 'column2']]
filtered_data = df[df['column1'] > 10]Code language: JavaScript (javascript)- GroupBy and Aggregation:
- Use the
groupby()method to group data based on specific criteria and perform aggregations.
grouped_data = df.groupby('category')['value'].mean()Code language: JavaScript (javascript)- Merging and Joining:
- Combine datasets using methods like
merge()orconcat().
merged_data = pd.merge(df1, df2, on='common_column')Code language: JavaScript (javascript)- Data Visualization:
- Use Pandas’ built-in plotting functions or integrate with Matplotlib for data visualization.
df.plot(kind='bar', x='category', y='value')Code language: JavaScript (javascript)- Export Data:
- Save the cleaned and processed data back to external files.
df.to_csv('cleaned_data.csv', index=False)Code language: PHP (php)- Further Analysis:
- Perform additional statistical analysis, machine learning, or exploration based on the specific objectives of your project.
This workflow provides a general outline of how Pandas is commonly used in data analysis tasks. The specific steps may vary based on the nature of the data and the analysis goals.
How Pandas Works & Architecture?
Following is a detailed overview of how Pandas works and its underlying architecture:
It is widely used for data manipulation, analysis, and visualization. Pandas is built on top of NumPy, which provides efficient numerical operations, and Matplotlib, which provides powerful data visualization capabilities.
Pandas Data Structures
Pandas’ core data structures are:
- Series: A one-dimensional labeled array, similar to a list or column in a spreadsheet.
- DataFrame: A two-dimensional labeled array, similar to a table or spreadsheet. It is composed of rows and columns, where each row represents an observation and each column represents a variable.
- Panel: A three-dimensional labeled array, similar to a collection of DataFrames. It can be used to represent data with multiple dimensions.
These data structures provide efficient ways to store, manipulate, and analyze data.
Pandas Architecture
Pandas’ architecture is modular and flexible, allowing it to handle a wide range of data analysis tasks. Its key components include:
- Indexing: Pandas provides efficient indexing mechanisms to access specific elements or subsets of data within Series, DataFrames, and Panels.
- Data Manipulation: Pandas offers a comprehensive set of functions for data manipulation, including data filtering, sorting, cleaning, and merging.
- Data Analysis: Pandas provides statistical functions and tools for data analysis, such as descriptive statistics, correlation analysis, and hypothesis testing.
- Data Visualization: Pandas integrates with Matplotlib to provide powerful data visualization capabilities.
- Memory Management: Pandas utilizes efficient memory management techniques to handle large datasets effectively.
How Pandas Works
When you work with Pandas, you typically follow these steps:
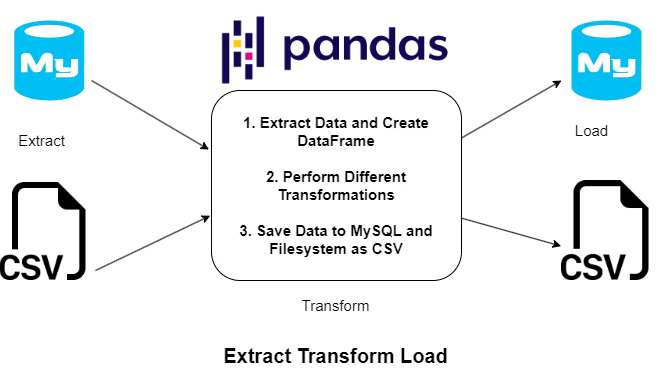
- Data Import: Import data from various sources, such as CSV files, Excel files, or databases, into Pandas data structures.
- Data Cleaning: Clean and prepare the data for analysis by handling missing values, removing outliers, and correcting data inconsistencies.
- Data Manipulation: Manipulate the data using Pandas functions to filter, sort, and transform data as needed.
- Data Analysis: Perform data analysis using Pandas statistical functions and tools to derive insights from the data.
- Data Visualization: Create visualizations, such as charts and graphs, using Matplotlib to visualize the data and communicate findings.
Pandas simplifies data analysis tasks by providing a consistent and user-friendly interface for working with data. Its powerful data structures and functions make it a versatile tool for data scientists, analysts, and researchers.
How to Install and Configure Pandas?
Installing and configuring Pandas is a straightforward process. Following is a step-by-step guide for both Windows and macOS systems:
Installing Pandas on Windows:
Prerequisites:
- Python: Ensure you have Python installed on your system. You can easily install Python from the official website.
- Pip: Pip is the package installer for Python. If you haven’t installed Pip yet, you can get it by running the following command in the Command Prompt:
   curl -sSL https://bootstrap.pypa.io/get-pip.py | python -
Code language: JavaScript (javascript)
Installation Steps:
- Open Command Prompt: Open the Command Prompt or Terminal window.
- Install Pandas: Use the following command to install Pandas:
pip install pandas
This command will download and install the Pandas library into your Python environment.
Installing Pandas on macOS:
Prerequisites:
- Homebrew: Homebrew is a package manager for macOS. If you haven’t installed Homebrew yet, you can install it by following the instructions on the official website.
- Python: Once Homebrew is installed, you can install Python using the following command in Terminal:
brew install python
Installation Steps:
- Activate Python Environment: Activate the Python environment where you want to install Pandas. For example, if you’re using a virtual environment, activate it using the appropriate command.
- Install Pandas: Use the following command to install Pandas:
pip install pandas
This command will download and install the Pandas library into your Python environment.
Configuring Pandas:
Once Pandas is installed, you don’t need any additional configuration to use it in your Python scripts. Simply import the Pandas library using the following statement:
   import pandas as pd
Code language: JavaScript (javascript)
This statement imports the Pandas library and assigns it the alias pd, which is commonly used in Pandas code.
You can now start using Pandas to read, manipulate, and analyze data in your Python programs.
Fundamental Tutorials of Pandas: Getting started Step by Step

Let’s have a look at a step-by-step fundamental tutorial of Pandas, covering essential concepts and operations:
Step 1: Introduction to Pandas
- Importing Pandas: Import the Pandas library using the
importstatement:
   import pandas as pd
Code language: JavaScript (javascript)- Creating a DataFrame: A DataFrame is the primary data structure in Pandas. Create a DataFrame from a list of dictionaries:
   data = [{'name': 'Alice', 'age': 30}, {'name': 'Bob', 'age': 25}]
   df = pd.DataFrame(data)
Code language: JavaScript (javascript)
Step 2: Exploring DataFrames
- Viewing DataFrame Information: Use the
info()method to get information about the DataFrame:
   df.info()
Code language: CSS (css)- Accessing DataFrame Elements: Access DataFrame elements using row and column indices:
   print(df.loc[0, 'name'])  # Access first row's 'name' value
Code language: PHP (php)- Selecting Subsets of Data: Use selection methods like
head(),tail(), andiloc[]to select specific rows or columns:
   print(df.head(2))  # Display the first two rows
Code language: PHP (php)
Step 3: Data Manipulation and Cleaning
- Adding and Deleting Rows and Columns: Use
append(),drop(), andinsert()methods to manipulate DataFrame structure. - Handling Missing Values: Use methods like
fillna(),dropna(), andisna()to deal with missing values. - Data Type Conversion: Use
astype()method to convert data types of columns or specific values.
Step 4: Data Analysis and Statistical Operations
- Descriptive Statistics: Use
describe()method to get summary statistics for each column. - Data Aggregation: Use
groupby()and aggregation functions likemean(),sum(),max(),min()to aggregate data. - Data Sorting: Use
sort_values()method to sort the DataFrame by specific columns.
Step 5: Data Visualization
- Importing Matplotlib: Import Matplotlib for data visualization.
- Creating Basic Plots: Use Matplotlib functions like
plot(),bar(),hist()to create basic plots. - Using Pandas Plotting Functions: Pandas provides built-in plotting functions for various types of data visualizations.
These steps provide a basic foundation for using Pandas. For more advanced topics and comprehensive learning, refer to the official Pandas documentation and tutorials.

Find Trusted Cardiac Hospitals
Compare heart hospitals by city and services — all in one place.
Explore Hospitals