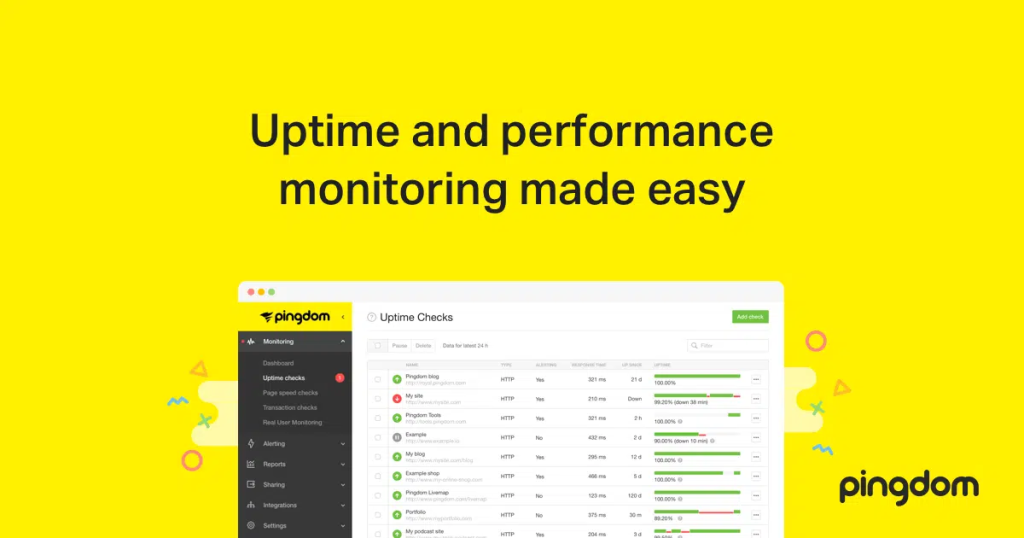
What is Pingdom?

Pingdom is a powerful website monitoring and performance optimization tool, essentially acting as your website’s watchdog. It offers a variety of features to help you ensure your website is always up and running smoothly, delivering a great experience for your users.
Top 10 use cases of Pingdom?
Here are the top 10 use cases of Pingdom:
1. Uptime Monitoring: Continuously monitor your website’s availability from multiple global locations, instantly alerting you to any outages or downtime.
2. Performance Insights: Gain valuable insights into your website’s loading speed, identify bottlenecks, and track performance metrics like page load times, transaction times, and resource usage.
3. Real User Monitoring (RUM): See how your website performs for real users across different devices and locations, pinpointing issues affecting specific user segments.
4. Waterfall Analysis: Analyze detailed waterfall charts to understand the order and timing of each element during page load, helping you identify and prioritize optimization efforts.
5. Synthetic Monitoring: Simulate user interactions with your website to proactively detect and troubleshoot potential performance issues before they impact real users.
6. Alerting and Reporting: Set up custom alerts to receive immediate notifications via email, SMS, or integrations with other tools, and generate comprehensive reports to track progress and identify trends.
7. API Monitoring: Monitor the performance and uptime of your APIs, ensuring smooth functioning and preventing disruptions to dependent applications.
8. Transaction Monitoring: Track the performance of specific user journeys on your website, like checkout processes or login forms, to ensure a seamless user experience.
9. Front-End Monitoring: Monitor the performance of your website’s front-end elements like JavaScript and CSS, identifying issues affecting rendering and responsiveness.
10. Competitor Benchmarking: Compare your website’s performance against competitors to identify areas for improvement and stay ahead of the curve.
Pingdom is a valuable tool for web developers, IT professionals, and anyone who wants to ensure their website is delivering the best possible experience for their users. Its combination of uptime monitoring, performance insights, and user-centric features makes it a powerful ally in the quest for a fast, reliable, and engaging website.
What are the feature of Pingdom?
Pingdom boasts a comprehensive set of features, catering to various website performance monitoring needs. Here’s a breakdown of some key highlights:
Uptime Monitoring:
- Monitor website availability from multiple global locations.
- Instant alerts for outages and downtime.
- Historical uptime data and reports.
- Advanced configuration options like custom check intervals and ignore patterns.
Performance Insights:
- Page load time tracking with detailed waterfall charts.
- Analysis of performance metrics like transaction times, resource usage, and first byte time.
- Page speed optimization recommendations based on best practices.
- Comparison of performance across different locations and devices.
Real User Monitoring (RUM):
- Monitor website performance for real users in real-time.
- Insights into user experience based on browser, device, and geographic location.
- Identification of slow-loading pages and problematic elements.
- Session recordings to visualize user journeys and diagnose issues.
Additional Features:
- Synthetic Monitoring: Simulate user interactions and proactively identify performance bottlenecks.
- Alerting and Reporting: Set up custom alerts for critical metrics and generate comprehensive reports.
- Collaboration Tools: Share monitoring data and insights with team members.
- API Monitoring: Ensure the performance and uptime of your APIs.
- Transaction Monitoring: Track specific user journeys for a smooth user experience.
- Front-End Monitoring: Monitor the performance of JavaScript, CSS, and other front-end elements.
- Competitor Benchmarking: Compare your website’s performance against competitors.
This is just a glimpse into Pingdom’s feature set. Depending on your specific needs, you may find additional functionalities valuable, like web vitals monitoring, advanced reporting options, and integrations with other tools.
How Pingdom works and Architecture?
Pingdom’s architecture revolves around a distributed network of probes strategically located around the globe. These probes act as remote agents, simulating user interactions and gathering performance data from your website. Here’s a breakdown of the key components and their interplay:
1. Probes:
- Located in various data centers worldwide, ensuring geographically diverse monitoring.
- Initiate website requests at set intervals or based on synthetic monitoring configurations.
- Measure various performance metrics like response times, page load times, and resource usage.
2. Data Collection and Aggregation:
- Probe data is transmitted to Pingdom’s central servers for analysis and processing.
- Performance metrics are combined and analyzed to provide insights into overall website health.
- Real user monitoring data from user browsers is also collected and integrated.
3. Analysis and Visualization:
- Pingdom’s platform translates raw data into actionable insights through:
- Waterfall charts depicting the loading sequence of page elements.
- Performance reports with detailed metrics and historical trends.
- Page speed optimization recommendations based on best practices.
- User experience reports based on real user data.
4. Alerting and Notification:
- Customizable alert thresholds are set for critical metrics like uptime and page load times.
- When thresholds are breached, Pingdom triggers instant notifications via email, SMS, or integrations with other tools.
- This enables for proactive issue identification and resolution.
5. User Interface and Reporting:
- Pingdom provides a user-friendly web interface for accessing all monitoring data and reports.
- Users can:
- View real-time performance overviews.
- Analyze historical trends and identify patterns.
- Share reports and collaborate with team members.
- Customize dashboards and monitoring configurations.
Additional Architectural Aspects:
- Scalability: Pingdom’s distributed architecture allows it to handle large volumes of data and monitor websites of all sizes efficiently.
- Security: Data transmission and storage are secured with industry-standard encryption protocols.
- Reliability: Redundancy measures ensure high uptime and minimize the impact of potential probe or server issues.
Overall, Pingdom’s architecture focuses on collecting comprehensive performance data from diverse locations, analyzing it intelligently, and presenting it in a way that empowers users to optimize their website’s performance and deliver a seamless user experience.
How to Install Pingdom it?
It’s important to clarify that Pingdom is actually a web-based service, not a software you install on your own server. Therefore, there’s no installation process involved in the traditional sense.
Here’s how you get started with Pingdom:
1. Sign Up:
- Head over to Pingdom’s website.
- Click on the “Start Free Trial” button.
- Generate an account by providing your email address and setting a password.
2. Choose Your Plan:
- Pingdom offers various plans with different features and monitoring limits.
- Discover the available plans and select the one that best suits your needs.
- You can always upgrade or downgrade your plan later as your monitoring requirements evolve.
3. Add Your Website:
- Once you’ve chosen a plan, click on “Add New Check” in your Pingdom dashboard.
- Enter your site URL in the designated field.
- Configure the check settings, such as check type (uptime, page speed, etc.) and monitoring locations.
- Save the check.
4. Start Monitoring:
- Pingdom will automatically start monitoring your website based on your chosen settings.
- You can access real-time and historical performance data, reports, and insights within your Pingdom dashboard.
Remember, you can try Pingdom for free with their 14-day trial before committing to a paid plan. This allows you to explore the platform, test its features, and see how it can benefit your website performance monitoring needs.
Basic Tutorials of Pingdom: Getting Started
Ready to dive into Pingdom and analyze your website’s performance? Let’s have a look at some step-by-step basic tutorials to get you started:
1. Setting Up a Free Account:
- Head over to pingdom official site and click “Sign Up”.
- Enter your email address and create a password.
- Verify your email and log in to your new account.
2. Running a Basic Website Speed Test:
- Click “New Test” on the dashboard.
- Enter the URL of the website you want to test.
- Optionally, choose a test location from the dropdown menu.
- Click “Start Test”.
3. Understanding the Test Results:
- Page Load Time: This is the overall time it takes for the entire page to fully load. Aim for under 3 seconds for optimal user experience.
- Performance Grade: Pingdom assigns a letter grade (A-F) based on the overall page load time. Ideally, you want an A or B.
- Waterfall Chart: This graph visually displays the loading sequence of all page elements, like images, scripts, and CSS files. Analyze it to identify potential bottlenecks.
- Page Insights: Get detailed information on elements impacting your page speed, including their size and loading times.
4. Exploring Advanced Features:
- Custom Alerts: Set up email or SMS alerts to notify you when your website’s performance falls below certain thresholds.
- Transaction Monitoring: Simulate user interactions like clicking buttons or filling forms to measure specific page interactions.
- Comparison Tests: Compare your website’s performance against competitors or against previous tests to track progress.
These are just basic steps. As you get comfortable with Pingdom, you can delve deeper into its advanced features and customize its functionality to suit your specific website performance needs.
Bonus Tip: Combine Pingdom with other website optimization tools like Google PageSpeed Insights and GTmetrix for a comprehensive understanding of your website’s performance and actionable insights for improvement.

Find Trusted Cardiac Hospitals
Compare heart hospitals by city and services — all in one place.
Explore Hospitals
Thanks for this clear and practical breakdown of Pingdom! I found the explanation of key use cases — like uptime monitoring from global locations, real‑user performance insights, synthetic checks, and alerting/reporting — especially useful because it shows how Pingdom helps teams stay ahead of issues rather than just react to them. The way you describe monitoring real user experiences and transaction paths makes it easy to see why it’s valuable for both developers and site owners. Great job on making a technical topic easy to understand!