What is Prometheus?

Prometheus is an open-source monitoring and alerting toolkit designed for reliability and scalability. It is particularly well-suited for monitoring dynamic, cloud-native environments. Prometheus focuses on providing a time-series-based data model and supports a pull-based architecture, where the monitoring system periodically scrapes metrics from various targets.
Top 10 use cases of Prometheus?
Here are ten common use cases for Prometheus:
- Monitoring Containerized Environments:
- Prometheus is well-suited for monitoring containerized environments, such as those orchestrated by Kubernetes or Docker Swarm.
- It provides insights into container performance, resource utilization, and orchestration metrics.
- Infrastructure Monitoring:
- Monitor the health and performance of servers, virtual machines, and other infrastructure components.
- Track CPU usage, memory utilization, disk I/O, and other system-level metrics.
- Application Performance Monitoring (APM):
- Use Prometheus to collect and analyze metrics related to application performance.
- Monitor response times, error rates, and throughput of applications.
- Service Discovery and Dynamic Environments:
- Prometheus supports service discovery, allowing it to dynamically discover and monitor targets in dynamic environments.
- Automatically discover and monitor instances as they are added or removed from the environment.
- Alerting and Notification:
- Set up alerts based on predefined thresholds and conditions.
- Receive notifications when metrics indicate potential issues or breaches of specified thresholds.
- Time-Series Data Analysis:
- Leverage Prometheus’ time-series data model for analyzing trends and patterns over time.
- Conduct historical analysis of metrics to identify performance trends and anomalies.
- Multi-dimensional Data Model:
- Utilize the multi-dimensional data model of Prometheus to add labels and metadata to metrics.
- Facilitate efficient querying and filtering of metrics based on various dimensions.
- Scalable and High Availability:
- Prometheus is designed to be horizontally scalable and supports high availability configurations.
- Deploy multiple Prometheus instances to handle large-scale monitoring environments.
- Federation for Centralized Monitoring:
- Use Prometheus Federation to aggregate and centralize metrics from multiple Prometheus servers.
- Facilitate monitoring across distributed and geographically dispersed environments.
- Grafana Integration:
- Integrate Prometheus with Grafana for creating rich dashboards and visualization of metrics.
- Leverage Grafana’s features for interactive exploration and analysis of Prometheus data.
- Blackbox Monitoring:
- Implement blackbox monitoring to monitor the availability and response times of external services or endpoints.
- Use Prometheus’ blackbox exporter for this purpose.
- Batch Job Monitoring:
- Monitor the performance of batch jobs, cron jobs, or scheduled tasks using Prometheus.
- Track metrics related to job execution, completion, and resource usage.
Prometheus is a versatile tool that can be applied to various monitoring scenarios. Its flexible architecture and support for modern application and infrastructure patterns make it a popular choice in the monitoring and observability landscape.
What are the feature of Prometheus?
Prometheus is a popular open-source system for monitoring and alerting in cloud-native environments. Its feature set makes it a versatile tool for gaining insights into your applications and infrastructure. Here’s a breakdown of its key capabilities:
1. Multi-Dimensional Data Model:
- Time-Series Data: Tracks data over time with timestamps and key-value pairs (metrics).
- Flexibility: Define metrics with any relevant identifier for granular insights.
- Rich Data Structure: Combine multiple labels to create sophisticated metrics for analysis.
2. Efficient Metric Collection:
- Pull Model: Servers actively report metrics to Prometheus via HTTP endpoints.
- Scrape Configuration: Flexible configuration allows targeting specific servers and metrics.
- Support for Various Services: Scrapes metrics from diverse sources like containers, databases, and applications.
3. Powerful Query Language (PromQL):
- Filter and Aggregate Data: Extract specific data points or aggregate over time for analysis.
- Advanced Functions: Utilize built-in and custom functions for complex analyses and calculations.
- Easy-to-Read Syntax: Familiar query language makes data exploration accessible.
4. Robust Alerting System:
- Rule-Based Alerts: Define rules that trigger notifications when specific conditions are met.
- Multiple Notification Channels: Receive alerts via email, Slack, PagerDuty, or other integrations.
- Alert Silencing: Temporarily mute alerts for planned maintenance or false positives.
5. Integration with Other Tools:
- Grafana: Visualize dashboards for monitoring and insights.
- Alertmanager: Manage and route alerts with advanced notification options.
- PromQL Exporters: Extend Prometheus to collect data from additional sources.
6. Open-Source and Community-Driven:
- Freely Available: No licensing fees or limitations for basic usage.
- Active Community: Extensive documentation, tutorials, and contributions.
- Continuous Development: Regular updates and new features bring ongoing improvements.
Additional Benefits:
- Lightweight and Scalable: Runs efficiently on single servers or large clusters.
- Standardized Format: Metrics follow an open standard for easy adoption and integration.
- Highly Configurable: Tailor Prometheus to your specific monitoring needs.
Prometheus’ feature set makes it a valuable tool for anyone managing and monitoring cloud-native systems. Its flexibility, power, and open-source nature have made it a popular choice for developers, operations teams, and IT professionals seeking deep insights and effective control over their infrastructure.
How Prometheus works and Architecture?
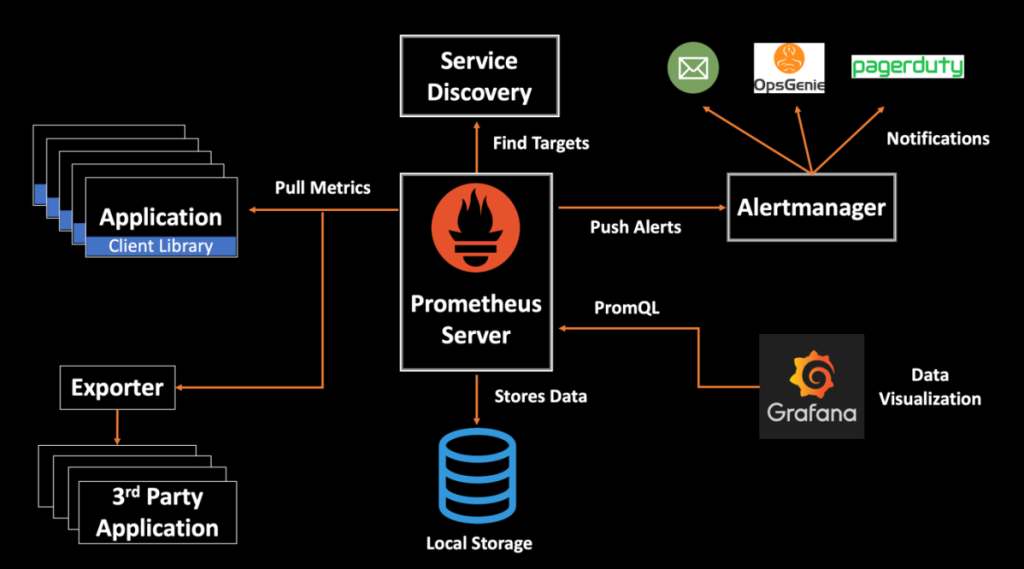
Prometheus’ ability to monitor and alert for your cloud-native environment stems from its well-defined architecture, designed for efficient data collection, analysis, and visualization. Following is a breakdown of its key components:
1. Data Acquisition:
- Scraping Servers: Lightweight, single-purpose applications installed on your systems.
- Target Configuration: Define which servers and metrics Prometheus should scrape via YAML files.
- HTTP Pull Model: Scrapers actively pull data from target servers through dedicated HTTP endpoints.
2. Data Storage and Processing:
- Local Time-Series Database: Each Prometheus server stores scraped data locally in a time-series database.
- Metric Format: Data is stored in a standardized format (OpenMetrics) with timestamps and label-based identifiers.
- Rule Engine: Evaluates configured rules against stored data to detect anomalies and trigger alerts.
3. Query and Analysis:
- PromQL: Powerful query language to filter, aggregate, and analyze time-series data.
- Expression Parser: Parses PromQL queries and performs data retrieval and manipulations.
- Remote Write API: Optionally, data can be sent to a dedicated storage or analysis platform.
4. Alerting and Notification:
- Alertmanager: Manage and route alerts triggered by Prometheus rule engine.
- Alert Rules: Define conditions for triggering alerts based on specific metric thresholds or patterns.
- Notification Channels: Send alerts via email, Slack, PagerDuty, or other integrations.
5. Visualization and Access:
- Grafana (Optional): Popular tool for creating dashboards and visualizations from Prometheus data.
- API Access: Prometheus data can be accessed and manipulated through a flexible API.
Important Points:
- Open-Source: Freely available with a vibrant community providing contributions and support.
- Highly Scalable: Can handle data from small deployments to large-scale environments.
- Federated Architecture: Distributed architecture allows for multiple Prometheus servers working together.
By understanding how Prometheus works, you can utilize its features effectively to monitor your infrastructure, gain insights into system health, and proactively address potential issues.
How to Install Prometheus it?
I will guide you through the general steps of installing Prometheus, and you can further refine them based on your specific operating system and desired configuration.
1. Choose your installation method:
- Binary Download: Download the pre-built binary for your operating system from the official Prometheus website.
- Package Manager: If your system uses a package manager like apt or yum, you can install it directly through a pre-packaged version.
- Docker Container: Run Prometheus in a Docker container for easy deployment and isolation.
2. Configure Prometheus:
- Create a configuration file (
prometheus.yaml) specifying scrape targets, rule files, and other settings. - Configure firewall rules to allow incoming connections on the Prometheus port (default 9090).
- Optionally, set up additional components like Alertmanager and Grafana.
3. Run Prometheus:
- Start the Prometheus server using the downloaded binary, package manager command, or Docker container invocation.
- Verify that Prometheus is running and accessible on the configured port.
4. Access and use Prometheus:
- Navigate to the Prometheus web interface (http://localhost:9090) to explore metrics and configure alerts.
- Use PromQL to query specific metrics and gain insights into your system health.
Remember to adapt these steps to your specific environment and choose the most suitable installation method for your needs. You can find detailed instructions and troubleshooting tips in the resources listed above.
Basic Tutorials of Prometheus: Getting Started

Ready to unlock the power of Prometheus for monitoring your systems? Let’s delve into a step-by-step guide to get you started with the basics:
1. Download and Install:
- Choose your platform (Linux, macOS, Windows) and head to the Prometheus website to download the appropriate binary.
- Extract the downloaded file and make the
prometheusbinary executable. - Add the
prometheusdirectory containing the binary to your system path for easy access.
2. Configure Prometheus:
- Create a configuration file named
prometheus.ymlin the same directory as theprometheusbinary. - Add essential configurations like
scrape_configsto define targets for Prometheus to fetch metrics from (e.g., servers, applications). - Specify the scraping interval, port number (default: 9090), and any additional settings desired.
3. Launch Prometheus:
- Open a terminal and navigate to the directory containing
prometheus.ymland theprometheusbinary. - Run the
prometheuscommand to start the server. - Verify if Prometheus is up and running by accessing its web interface on
http://localhost:9090.
4. Explore and Learn:
- Use the Prometheus expression browser to explore available metrics and learn about their details.
- Try querying metrics, filtering them by labels, and visualizing them as graphs.
- Install and configure exporters like
node_exporterto gain access to system-level metrics for deeper monitoring. - Experiment with alerting rules to automatically notify you of specific metric thresholds being crossed.
Note: Start with the basics and gradually progress. Familiarize yourself with the Prometheus ecosystem and keep practicing to unlock its full potential for efficient system monitoring.
Happy monitoring!

Find Trusted Cardiac Hospitals
Compare heart hospitals by city and services — all in one place.
Explore Hospitals
This blog provides a clear and easy explanation of Prometheus and its key use cases. I like how it highlights monitoring, alerting, and real-time metrics in a simple way. It’s very helpful for understanding how Prometheus improves system reliability and performance in modern DevOps environments.