What is QlikView?
QlikView is a revolutionary business intelligence tool that allows organizations to make data-driven decisions and gain valuable insights. It allows users to connect to various data sources, combine data from multiple sources, and create interactive visualizations and dashboards. QlikView is known for its associative data model, which enables users to explore data relationships and make data-driven decisions.
Top 10 use cases of QlikView:
Here are the top 10 use cases of QlikView:
- Data Visualization: QlikView offers a wide range of visualization options, including charts, graphs, tables, and maps. Users can create interactive and dynamic visualizations to explore and analyze data.
- Business Reporting: Users can create interactive reports that provide insights into business performance, key metrics, and trends. Reports can be customized to match specific business needs.
- Dashboard Creation: QlikView allows users to build interactive dashboards that consolidate multiple visualizations into a single view. This enables decision-makers to quickly grasp the overall picture.
- Data Exploration: With its associative data model, QlikView lets users explore data relationships, helping them discover hidden insights and correlations within their datasets.
- Self-Service Analytics: QlikView empowers business users to create their own visualizations and perform ad-hoc analyses without relying on IT departments.
- Real-Time Analytics: QlikView supports real-time data streaming, allowing users to monitor live data and gain immediate insights into changing conditions.
- Comparative Analysis: Users can compare data from different sources, time periods, or segments to understand performance variations and make informed decisions.
- Supply Chain Analysis: QlikView can be used to analyze and optimize supply chain operations, track inventory levels, monitor supplier performance, and improve logistics.
- Sales and Customer Analysis: Organizations can analyze sales data, customer behavior, and buying patterns to identify opportunities for revenue growth and customer satisfaction.
- Financial Analysis: QlikView can be applied for financial analysis, including examining budget vs. actuals, cash flow analysis, and identifying areas for cost reduction.
These use cases demonstrate QlikView’s versatility in helping organizations across various industries extract insights from their data, make informed decisions, and drive business growth.
What are the feature of QlikView?
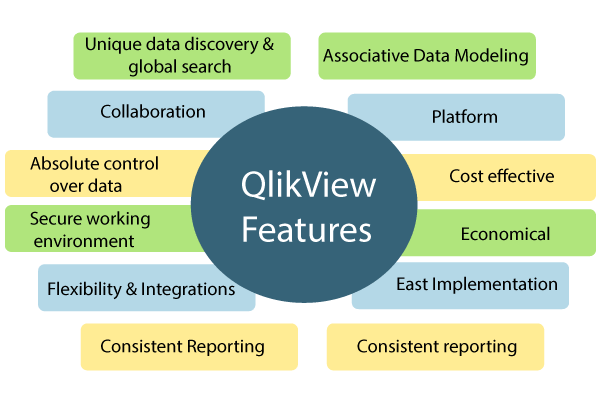
QlikView is a feature-rich business intelligence and data visualization platform that provides a range of tools for data exploration, visualization, and analysis. Here are some of the key features of QlikView:
- Associative Data Model: QlikView’s unique associative data model enables users to explore data relationships intuitively. This means that selections made in one visualization automatically affect all other related visualizations, allowing for interactive and dynamic analysis.
- In-Memory Processing: QlikView utilizes in-memory technology to load and store data in RAM, enabling fast data retrieval and analysis without the need for repeated database queries.
- Data Transformation: QlikView’s ETL (Extract, Transform, Load) capabilities allow users to transform, clean, and prepare data before visualizing it. This includes data aggregation, calculations, and data modeling.
- Data Visualization: QlikView offers a wide range of visualization options, including charts, graphs, tables, pivot tables, and more. Users can create custom visualizations using drag-and-drop interfaces.
- Interactivity and Exploration: QlikView supports interactive exploration of data through selection, filtering, and drilling down into details. Users can gain insights by asking ad-hoc questions and dynamically changing perspectives.
- Dashboards and Reports: Users can build interactive dashboards and reports that provide a comprehensive view of their data. Dashboards can be customized and arranged to meet specific business needs.
- Search and Natural Language: QlikView includes a search feature that allows users to search for data and insights using natural language queries, making data discovery more intuitive.
- Collaboration and Sharing: QlikView enables collaboration by allowing users to share their analyses, visualizations, and insights with colleagues and stakeholders. Shared content can be accessed via the QlikView client or web browser.
- Security and Governance: QlikView provides features for data security and governance, including user authentication, role-based access control, and data encryption.
- Mobile Accessibility: QlikView offers mobile apps that allow users to access and interact with data visualizations on smartphones and tablets.
How QlikView works and Architecture?
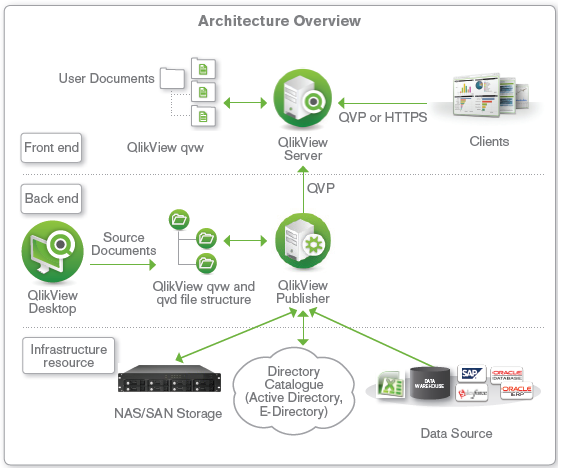
QlikView’s architecture is designed to efficiently manage data processing, visualization, and interaction. Here’s an overview of its architecture:
- Data Sources: QlikView can connect to various data sources, including databases, files, spreadsheets, and web services.
- Data Extraction and Transformation: QlikView’s ETL process involves extracting data from sources, transforming it using the QlikView Scripting Language, and loading it into an in-memory data model.
- In-Memory Data Model: QlikView’s associative data engine stores the transformed data in memory, enabling fast and interactive querying.
- Data Visualization: Users create visualizations by dragging and dropping fields onto the visualization canvas. The associative engine dynamically generates visualizations based on user selections.
- Client: The QlikView client, installed on user machines, provides the interface for data exploration, visualization, and analysis.
- Server: The QlikView Server manages document distribution, user access, and security. It can distribute documents to the QlikView clients and web browsers.
- Publisher: The QlikView Publisher automates the distribution of QlikView documents, ensuring that users receive up-to-date insights.
- AccessPoint: The QlikView AccessPoint is a web portal that allows users to access and interact with QlikView documents through a web browser.
QlikView’s architecture is optimized for delivering a responsive and interactive user experience, making it an effective tool for data exploration and visualization.
How to Install QlikView?
There are two ways to install QlikView:
- Using the QlikView installer:
- Go to the Qlik website and download the QlikView installer for your operating system.
- Run the installer and use the instructions over the screen.
- Using the QlikView subscription:
- Go to the Qlik website and create a Qlik account.
- Subscribe to QlikView.
- Once you have subscribed to QlikView, you will be able to download the QlikView installer.
Once you have installed QlikView, you can start creating visualizations and dashboards.
Here are the detailed steps on how to install QlikView using the QlikView installer:
- Go to the Qlik website and download the QlikView installer for your operating system.
- Run the installer and use the instructions over the screen.
- On the first screen, accept the terms of the license agreement and click Next.
- On the second screen, select the installation options that you want and click Next.
- On the third screen, select the folder where you want to install QlikView and click Install.
- The installer will start installing QlikView. This may take a few minutes.
- Once the installation is complete, click Finish.
Once you have installed QlikView, you can start creating visualizations and dashboards.
Here are the detailed steps on how to install QlikView using the QlikView subscription:
- Go to the Qlik website and create a Qlik account.
- Subscribe to QlikView.
- Once you have subscribed to QlikView, you will be able to download the QlikView installer.
Once you have downloaded the QlikView installer, run it and follow the on-screen instructions to install QlikView.
Once you have installed QlikView, you can start creating visualizations and dashboards.
Basic Tutorials of QlikView: Getting Started
Let’s have a look at basic tutorials of QlikView:
- Getting Started with QlikView: This tutorial shows you how to install QlikView, create a new document, import data, and create visualizations.
- Go to the Qlik website and download the QlikView installer for your operating system.
- Run the installer and follow the on-screen instructions to install QlikView.
- Once QlikView is installed, open it and click on the File menu.
- Select New.
- Select the Document option.
- Click on the Create button.
- In the Data Manager, select the Import tab.
- Select the data source that you want to import from.
- Click on the Open button.
- In the Objects pane, drag and drop the Chart object onto the canvas.
- In the Properties pane, configure the chart.
- Click on the Run button to view the visualization.
- Connecting to Data in QlikView: This tutorial shows you how to connect to different data sources in QlikView.
- QlikView can connect to a wide variety of data sources, including:
- Microsoft Excel spreadsheets
- Microsoft SQL Server databases
- Cloud-based data sources such as Azure Data Lake Storage and Amazon Redshift
- To connect to a data source, you can use the Data Manager.
- In the Data Manager, select the Connections tab.
- Click on the New button.
- Select the data source type that you want to connect to.
- Enter the connection details.
- Click on the Test button to test the connection.
- Click on the OK button to save the connection.
- QlikView can connect to a wide variety of data sources, including:
- Creating Visualizations in QlikView: This tutorial shows you how to create different visualizations in QlikView.
- QlikView provides a wide variety of visualizations that you can use to represent your data.
- Some of the visualizations that you can create in QlikView include:
- Bar charts
- Line charts
- Pie charts
- Maps
- To create a visualization, drag and drop the fields from the Fields pane to the Canvas pane.
- You can then format the visualizations in your document by changing the colors, fonts, and sizes.
- Creating Dashboards in QlikView: This tutorial shows you how to create dashboards in QlikView.
- A dashboard is a bunch of visualizations that you may apply to monitor your data.
- You can create different dashboards for different purposes, such as:
- A dashboard for tracking sales performance
- A dashboard for monitoring customer satisfaction
- A dashboard for tracking inventory levels
- To create a dashboard, drag and drop the visualizations that you want to include in the dashboard to the Canvas pane.
- You can then format the dashboard by changing the colors, fonts, and sizes.

👤 About the Author
Ashwani is passionate about DevOps, DevSecOps, SRE, MLOps, and AiOps, with a strong drive to simplify and scale modern IT operations. Through continuous learning and sharing, Ashwani helps organizations and engineers adopt best practices for automation, security, reliability, and AI-driven operations.
🌐 Connect & Follow:
- Website: WizBrand.com
- Facebook: facebook.com/DevOpsSchool
- X (Twitter): x.com/DevOpsSchools
- LinkedIn: linkedin.com/company/devopsschool
- YouTube: youtube.com/@TheDevOpsSchool
- Instagram: instagram.com/devopsschool
- Quora: devopsschool.quora.com
- Email– contact@devopsschool.com
Find Trusted Cardiac Hospitals
Compare heart hospitals by city and services — all in one place.
Explore Hospitals